Equilibrium Phase Relationship between SiC and a Liquid Phase
in the Fe-Si-C System at 1523–1723 K
Sakiko Kawanishi
*1, Takeshi Yoshikawa
*2and Toshihiro Tanaka
Division of Materials and Manufacturing Science, Osaka University, Suita 565-0871, Japan
Fe-Si melt is a candidate for use as an alloy solvent for rapid liquid phase growth of SiC because of the high solubility of carbon in molten iron. In this work, the equilibrium phase relationship between SiC and the liquid phase of the Fe-Si-C system was studied to determine the optimal composition of a high SiC content solvent. The solubility of carbon in molten silicon was examined and the thermodynamic properties of the liquid phase in the Si-C system were reassessed. The phase relationship between SiC and Fe-Si melt was investigated by the equilibration technique at 1523–1723 K. It was found that Fe-36 mol% Si alloy equilibrates with SiC at the corresponding temperatures. The equilibrium phase relationship between SiC and various compositions of Fe-Si melts was studied by using thermodynamic calculations. The results indicated that SiC is far more soluble in iron-rich Fe-Si melt than in silicon-rich melt. The Fe-Si melt of Fe-36 mol% Si composition possessing high SiC solubility should be a suitable solvent for rapid liquid phase growth of SiC. [doi:10.2320/matertrans.MRA2008404]
(Received October 28, 2008; Accepted January 8, 2009; Published March 4, 2009)
Keywords: silicon carbide, solubility, equilibrium, iron-silicon melt, solution growth
1. Introduction
Silicon carbide (SiC) has attracted attention as a basic semiconducting material for high temperature electronics and high power switching devices due to its wide bandgap, high electrical breakdown field and high thermal conductivity.
Physical vapor deposition (PVD) is the standard method for bulk growth of SiC but it requires high temperatures of above 2200 K. The development of a low temperature method for SiC material production is required before wide-scale use of SiC. The liquid phase growth technique is a possible method for the low temperature production of SiC. Several researchers have investigated liquid phase growth of SiC using silicon-based alloy solvents such as Ge or Si-Ti melts for epitaxial growth on a SiC substrate.1,2) It was
found that although epitaxial growth is achieved the growth rate is not as high as that obtained with the PVD method. This may be caused by the low solubility of carbon in the solvent which is 80 ppmw at 1800 K in molten silicon.3) We thus
focused on the Fe-Si solvent because of the high solubility of carbon in molten iron. The low eutectic points of the Fe-Si system can be effectively used for liquid phase growth at lower temperatures than has previously been done.1,2)
Information on the Fe-Si-C ternary phase diagram is limited in the iron-rich corner4) and only a few reports dealing with the liquid phase region saturated with SiC are available.5)The objective of this study is to investigate the
equilibrium phase relationship between SiC and the liquid phase for the purpose of Fe-Si solvent design. The Gibbs energy for the liquid phase in the Fe-Si-C system was investigated to clarify its equilibrium phase relationship. Unreliability in the thermodynamic properties of the Si-C system was found from the disagreement in the calculated liquidus4)with the experimental compositions3)while precise
data was reported for the Fe-Si and Fe-C systems.6,7) We measured carbon solubility in molten silicon at 1873 K by equilibration of silicon with SiC to confirm the validity of
the previously reported values. Thermodynamic properties of the liquid phase in the Si-C system were reassessed based on reliable solubility data.
The phase relationship between the Fe-Si melt and SiC in the Fe-Si-C ternary system was investigated by an equilibra-tion technique at 1523–1723 K and was studied using thermodynamic calculations.
It was found that the Fe-Si melt of Fe-36 mol% Si composition which possesses high SiC solubility should be a suitable solvent for the liquid phase growth of SiC.
2. Equilibrium Phase Relationship between SiC and Molten Silicon
2.1 Measurement of carbon solubility in molten silicon
A measurement of carbon solubility in molten silicon was carried out in an induction furnace (400 kHz). Four grams of semiconductor grade polycrystalline silicon (12N) and a piece of single crystalline hexagonal SiC were inserted into an alumina Tammann tube (12 mm). The sample was placed in a graphite container and heated at 1873 K for 15 and 30 min under an Ar-10% H2 atmosphere. After heating, the
sample was crushed into lumps and surface polished to remove attached SiC particles. Carbon analysis was con-ducted by the combustion-IR absorption method.
Figure 1 shows the time dependence of the carbon content in molten silicon at 1873 K. Although scattering was observed the minimum values were in agreement regardless of the holding time. The deviation from minimum values may be attributed to entrapped SiC inclusions due to the good wettability of molten silicon with SiC.8)The carbon solubility
in molten silicon at 1873 K was thus estimated to be 120 ppmw from the average of the minimum values.
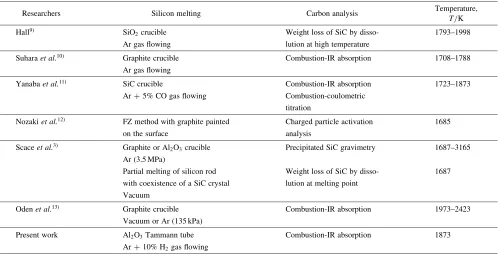
Previous work measuring the carbon solubility in molten silicon is summarized in Table 1. The measured solubility from this work is plotted in Fig. 2 together with the literature values. A large scattering is observed and values are dependent on the experimental conditions. Hall9)placed the SiC crystals on molten silicon in a quartz crucible and determined the solubility from the weight loss of SiC. The
*1Graduate Student, Osaka University
loss of SiC mass is inevitable, however, due to its reaction with dissolved oxygen from the crucible to form mainly CO gas and may give larger values than other methods. Suhara
et al.10)added SiC crystals to molten silicon and removed the suspended SiC in the molten silicon with a SiO2filter. In this
method the measured carbon content may include an error due to minute particles that remain in the filtered silicon. Yanaba et al.11) conducted a phase equilibration of silicon
with SiC under an ArþCO atmosphere, but in this method, additional SiC is formed by the reaction between silicon and CO gas leading to SiC contamination in the melt. Nozaki
et al.12)carried out the float zone method on a carbon-doped
silicon rod and reported an equilibrium distribution coeffi-cient together with the carbon solubility in SiC saturated solidified silicon. In this method, however, solute trapping to solid silicon is inevitable at the rapid solidification of over 3.5 mm/min, and the carbon solubility in molten silicon is thus probably overestimated. Scaceet al.3)investigated the phase equilibrium between molten silicon and SiC in graphite
or alumina crucibles and measured carbon solubility by SiC gravimetric analysis after precipitation of soluble carbon as SiC during solidification. They also reported a value for carbon solubility at the melting point of silicon which was determined from the weight loss of SiC during partial melting of silicon. Odenet al.13)melted silicon in a graphite crucible
and measured carbon solubility by a combustion-IR absorp-tion method in the temperature range of 1973–2423 K. Although Scace et al.3)and Oden et al.13) conducted their
experiments under equilibrium conditions Scace et al.3)
reported slightly greater carbon solubility. Analytical errors by Odenet al.13)could be responsible as the relatively low
temperature could cause difficulties in measuring the small amount of carbon as a result of the inadequate weight of silicon in the sample.
As the solubility value of 120 ppmw at 1873 K agrees with the tendency of the values obtained by Scace et al.,3) the liquidus in the Si-C system can thus be regarded to be well determined by Scaceet al.3)
0 10 20 30 40
0 100 200 300
Time, t / min
ppmw C
[image:2.595.312.538.74.227.2]Fig. 1 Time dependence of the carbon content in molten silicon at 1873 K.
Table 1 Research on the measurements of carbon solubility in molten silicon.
Researchers Silicon melting Carbon analysis Temperature,
T/K
Hall9Þ SiO
2crucible Weight loss of SiC by disso- 1793–1998
Ar gas flowing lution at high temperature
Suharaet al.10Þ Graphite crucible Combustion-IR absorption 1708–1788
Ar gas flowing
Yanabaet al.11Þ SiC crucible Combustion-IR absorption 1723–1873
Ar + 5% CO gas flowing Combustion-coulometric
titration
Nozakiet al.12Þ FZ method with graphite painted Charged particle activation 1685
on the surface analysis
Scaceet al.3Þ Graphite or Al
2O3crucible Precipitated SiC gravimetry 1687–3165
Ar (3.5 MPa)
Partial melting of silicon rod Weight loss of SiC by disso- 1687
with coexistence of a SiC crystal lution at melting point Vacuum
Odenet al.13Þ Graphite crucible Combustion-IR absorption 1973–2423
Vacuum or Ar (135 kPa)
Present work Al2O3Tammann tube Combustion-IR absorption 1873
Ar + 10% H2gas flowing
3 4 5 6
100 101 102 103 104 105
106 3000 2500 2000
Hall 9) Suhara et al. 10) Yanaba et al. 11) Nozaki et al. 12) Scace et al. 3) Oden et al. 13) Present work
Carbon solubility
, ppmw C
104 T-1 / K-1 M. P. of silicon Temperature, T / K
[image:2.595.78.263.74.213.2] [image:2.595.51.549.278.532.2]2.2 Assessment of the thermodynamic properties of the liquid phase in the Si-C system
Based on liquidus compositions thermodynamic parame-ters for the liquid phase in the Si-C system are assessed as follows:
The formation reaction of SiC is described by eq. (1).
SiðlÞ þCðlÞ ¼SiCðsÞ ð1Þ
G0¼ 233100þ61:01T (J/mol)14;15Þ
The standard Gibbs energy change of eq. (1) is thus ex-pressed by eq. (2).
G0¼ RTln aSiC aSiaC
¼RTlnaSiaC ð2Þ
¼RTlnxSixCþRTlnSiC
whereRis the gas constant andTis the absolute temperature. In addition,ai,iandxi are the activity, activity coefficient
and concentration of component i, respectively. Regular solution behavior of the melt is assumed at the silicon-rich composition. Equation (2) rearranges to eq. (3) by substitut-ing the regular solution parameter for activity coefficients of silicon and carbon.
G0¼RTlnxSixCþSi-Cðx2Siþx
2
CÞ ð3Þ
Therefore, the regular solution parameter for the Si-C system may be calculated by eq. (4).
Si-C ¼ ðG0RTlnxSixCÞ=ðx2Siþx
2
CÞ ð4Þ
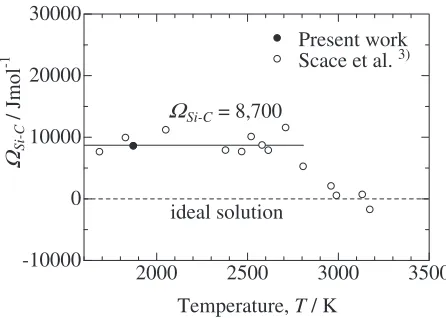
From the liquidus compositions of this work and the previous report by Scaceet al.3)
Si-Cvalues were calculated as shown
in Fig. 3. As no significant temperature dependence was observed in the temperature range of 1687–2800 K, where carbon content in molten silicon is below 6 mol%, the regular solution parameter was determined to be 8;7001;800(J/ mol)by a least squares regression. The Si-C melt exhibits a slight positive deviation from Raoult’s law. The obtained value was much larger than that reported by Lacazeet al.4)of
133;000þ30:97T (J/mol), which has been used for the thermodynamic evaluation of ternary Fe-Si-C system.16)This discrepancy might be caused by their inappropriate liquidus composition reference from the recommended phase diagram in the ASM handbook.17)
The phase diagram for the Si-C system was calculated using the assessed regular solution parameter in the liquid phase and the literature thermodynamic values for pure elements as well as for SiC.14,15) The calculated result is
shown in Fig. 4 together with a phase diagram produced by using the parameter reported by Lacazeet al.4)The liquidus line calculated with the assessed parameter reproduces the experimental liquidus well at compositions below 6 mol% C. The calculated decomposition temperature of SiC, estimated to be 3073 K, was similar to the 310340K reported by Scace et al.3)The assessed regular solution parameter used
for the Si-C system in the liquid phase was thus found to be appropriate for use below 6 mol% C.
3. Equilibrium Phase Relationship between SiC and Fe-Si Melt
3.1 Measurement of SiC solubility in the iron-rich Fe-Si melt
To achieve liquid phase growth of SiC at a high growth rate, the SiC should be highly soluble in the solvent, in addition to having a strong temperature dependence. The calculated phase diagram of the Fe-Si-C system as discussed in the following section indicated the existence of a liquid region with high SiC content of around Fe-35 mol% Si composition. The phase relationship between iron-rich Fe-Si melt and solid SiC was investigated at 1523–1723 K by the phase equilibration technique between two phases.
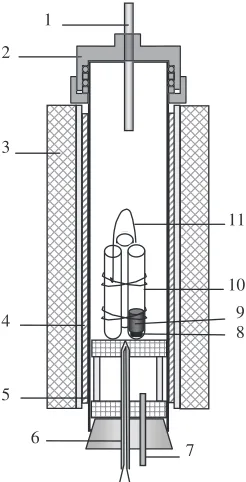
Experiments were carried out with a SiC resistance furnace as illustrated in Fig. 5. Fe-30, 33 and 36 mol% Si alloys were prepared by melting high purity electrolytic iron (99.992%) and semiconductor-grade polycrystalline silicon (12N) in an alumina crucible at 1733 K under an argon atmosphere for 30 minutes and then quenched in water. Five grams of Fe-Si alloy together with a dense graphite tablet or a SiC compact were inserted into an alumina Tammann tube (12 mm) and kept in a furnace at each desired temperature for 16 or 24 hours under an argon atmosphere. Water in the argon gas was removed to prevent oxidation of the specimen by passing it
2000 2500 3000 3500
-10000 0 10000 20000 30000
Ω
Si-C = 8,700Temperature, T / K
Ω
Si-C/ Jmol
-1
Present work Scace et al. 3)
ideal solution
Fig. 3 Temperature dependence of the Si-C regular solution parameter.
0
0.2
0.4
0.6
0.8
1
1500
2000
2500
3000
3500
Liq. + SiC
Si
C
Liq.
Mole fraction of carbon,
X
CT
emperature,
T
/ K
Experimental
Present work
Scace et al.
3)Calculation
Present work
Lacaze et al.
4) [image:3.595.57.280.73.232.2] [image:3.595.312.540.74.270.2]through a silica-gel and magnesium perchlorate packed bed filter before introduction to the reaction tube. The holding time was determined from preliminary runs where the carbon content of the alloy reached constant value within 4 hours. SiC compacts were prepared by the following methods: Equimolar powder mixtures of silicon (5N) and carbon (3N) were compressed to form a disk at 50 MPa and then subjected to reactive liquid phase sintering by induction heating or spark plasma sintering (SPS) at temperatures higher than 1723 K under vacuum. After holding at the desired temper-ature for a predetermined time the sample was quenched in water. Carbon analysis of the alloy was carried out by the combustion-IR absorption method. Silicon content was measured by SiO2 gravimetric analysis or ICP atomic
emission spectrometry.
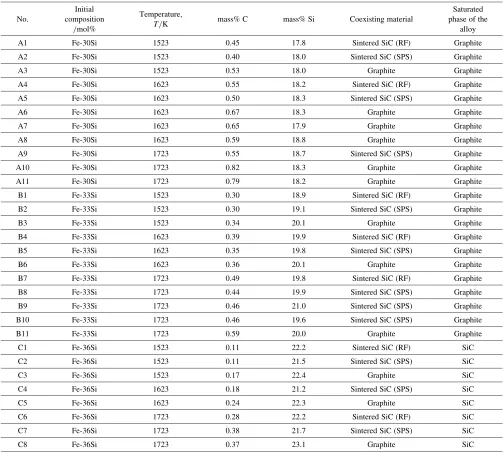
Experimental results for the equilibrium composition of Fe-Si alloys saturated with SiC or graphite are shown in Table 2. A typical microstructure of the interface between the Fe-Si alloy and a graphite tablet after equilibration (Sample C5) is shown in Fig. 6. Formation of a SiC layer onto graphite can be observed. The Fe-36 mol% Si alloy was in contact with SiC when the alloy was kept with either a graphite disk or a SiC compact. No SiC layers were seen in the Fe-30 and 33 mol% Si alloys. The double saturation compositions of graphite and SiC at 1523–1723 K thus exist between 33–36 mol% Si. Chipman et al.5) also reported
comparable silicon content for the double saturation compo-sition even though the carbon content seemed to be slightly lower than the content in this work.
The temperature dependence of SiC solubility in Fe-36 mol% Si alloy is shown in Fig. 7. The solubility of SiC was defined as a mole fraction of SiC in the liquid phase for the quasi-ternary Fe-Si-SiC system and is defined in eq. (5).
xSiC¼
NSiC
NFeþNSiþNSiC
¼ N
0
C
N0
FeþNSi0
ð5Þ
whereNiandN0
iare the molar amounts of componentiin the
Fe-Si-SiC and Fe-Si-C systems, respectively.
The solubility of SiC was determined to be slightly higher when using a graphite block than a SiC compact. This is attributed to an increase in the composition ratio of (Fe/Si) in the melt for the reaction of silicon with carbon for the formation of SiC. An increasing tendency in SiC solubility was observed with an increase in temperature.
3.2 Thermodynamic calculations of the phase relation-ship between SiC and the liquid phase in the Fe-Si-C system
In this section, the equilibrium phase relationship between SiC and the liquid phase in the Fe-Si-C system is evaluated by thermodynamic calculations and compared with the experimental results to determine the optimal composition of the liquid phase with high SiC solubility. The measured SiC solubilities in the Fe-Si melt in the previous section were not used for the calculations.
The excess molar Gibbs energy in the liquid phase is described by a Redlich-Kister type polynomial given by
1
2
3
4
5
6
7 8 9 10 11
Fig. 5 A schematic diagram of the experimental apparatus: 1-gas inlet tube, 2-stainless steel flange, 3-porous alumina, 4-SiC heating element, 5-mullite tube, 6-thermocouple, 7-gas outlet tube, 8-graphite disk or SiC compact, 9-Fe-Si alloy, 10-alumina Tammann tube, 11-molybdenum wire.
Graphite
Fe-Si alloy
SiC layer
200
µ
m
Fig. 6 A microphotograph of the interface structure between the Fe-36 mol% Si alloy and a graphite tablet after holding for 24 hours at 1623 K (Sample C5).
1573 1673 1773
0 0.01 0.02 0.03 0.04 0.05
Solubility of SiC,
XSiC
Temperature, T / K
Coexisting material Sintered SiC(RF) Sintered SiC(SPS) Graphite
[image:4.595.310.543.70.245.2] [image:4.595.107.230.73.314.2] [image:4.595.320.532.309.462.2]eqs. (6) and (7). Contributions of the binary Fe-Si, Fe-C and Si-C systems are taken into account and that of the ternary Fe-Si-C system is omitted.
GExm;liq¼xFexSiLFe-Si,liqþxFexCLFe-C,liqþxSixCLSi-C,liq ð6Þ
Lij;liq¼
Xn
m¼0
fmLij;liqðTÞðxixjÞmg ð7Þ
where Lij;liq represents an interaction parameter between
componentsi and j in the liquid phase which is dependent on temperature and composition. The value of Lij;liq for
each binary system including the newly determined param-eter for the Si-C system is listed in Table 3. The excess Gibbs energy in the liquid phase of the Fe-Si system was formulated based on the thermodynamic data from Hultgren
[image:5.595.46.550.83.535.2]et al.6)The equilibrium phase relationship between SiC and
Table 2 Experimental results for the equilibrium composition of Fe-Si alloys saturated with SiC or graphite.
No.
Initial composition
/mol%
Temperature,
T/K mass% C mass% Si Coexisting material
Saturated phase of the
alloy
A1 Fe-30Si 1523 0.45 17.8 Sintered SiC (RF) Graphite
A2 Fe-30Si 1523 0.40 18.0 Sintered SiC (SPS) Graphite
A3 Fe-30Si 1523 0.53 18.0 Graphite Graphite
A4 Fe-30Si 1623 0.55 18.2 Sintered SiC (RF) Graphite
A5 Fe-30Si 1623 0.50 18.3 Sintered SiC (SPS) Graphite
A6 Fe-30Si 1623 0.67 18.3 Graphite Graphite
A7 Fe-30Si 1623 0.65 17.9 Graphite Graphite
A8 Fe-30Si 1623 0.59 18.8 Graphite Graphite
A9 Fe-30Si 1723 0.55 18.7 Sintered SiC (SPS) Graphite
A10 Fe-30Si 1723 0.82 18.3 Graphite Graphite
A11 Fe-30Si 1723 0.79 18.2 Graphite Graphite
B1 Fe-33Si 1523 0.30 18.9 Sintered SiC (RF) Graphite
B2 Fe-33Si 1523 0.30 19.1 Sintered SiC (SPS) Graphite
B3 Fe-33Si 1523 0.34 20.1 Graphite Graphite
B4 Fe-33Si 1623 0.39 19.9 Sintered SiC (RF) Graphite
B5 Fe-33Si 1623 0.35 19.8 Sintered SiC (SPS) Graphite
B6 Fe-33Si 1623 0.36 20.1 Graphite Graphite
B7 Fe-33Si 1723 0.49 19.8 Sintered SiC (RF) Graphite
B8 Fe-33Si 1723 0.44 19.9 Sintered SiC (SPS) Graphite
B9 Fe-33Si 1723 0.46 21.0 Sintered SiC (SPS) Graphite
B10 Fe-33Si 1723 0.46 19.6 Sintered SiC (SPS) Graphite
B11 Fe-33Si 1723 0.59 20.0 Graphite Graphite
C1 Fe-36Si 1523 0.11 22.2 Sintered SiC (RF) SiC
C2 Fe-36Si 1523 0.11 21.5 Sintered SiC (SPS) SiC
C3 Fe-36Si 1523 0.17 22.4 Graphite SiC
C4 Fe-36Si 1623 0.18 21.2 Sintered SiC (SPS) SiC
C5 Fe-36Si 1623 0.24 22.3 Graphite SiC
C6 Fe-36Si 1723 0.28 22.2 Sintered SiC (RF) SiC
C7 Fe-36Si 1723 0.38 21.7 Sintered SiC (SPS) SiC
C8 Fe-36Si 1723 0.37 23.1 Graphite SiC
(RF: prepared by induction heating, SPS: prepared by spark plasma sintering)
Table 3 Thermodynamic parameters describing excess properties of the liquid phase for each binary in the Fe-Si-C system.
Lij;liq/Jmol1 Reference
LFe-Si,liq¼ 151128þ29:125Tþ ð338822:5015TÞðxFexSiÞ Hultgrenet al.6Þ þð3395411:256TÞðxFexSiÞ2þ ð212890:8650TÞðxFexSiÞ3
LFe-C,liq¼ 124320þ28:500Tþ ð19300ÞðxFexCÞ Gustafson7Þ þð4926019:000TÞðxFexCÞ2
[image:5.595.46.549.586.668.2]the liquid phase in the Fe-Si-C system was then calculated using thermodynamic data for the liquid phase listed in Table 3, pure elements,14) SiC15) and FeSi.6) The data for bcc and fcc phases were obtained from Miettinen16) although they need to be reassessed because they do not agree with the activity data of silicon in the bcc phase of the Fe-Si system as measured by Sakaoet al.18)The
estima-tion was done with thermodynamic calculaestima-tion software (FactSage 5. 5).
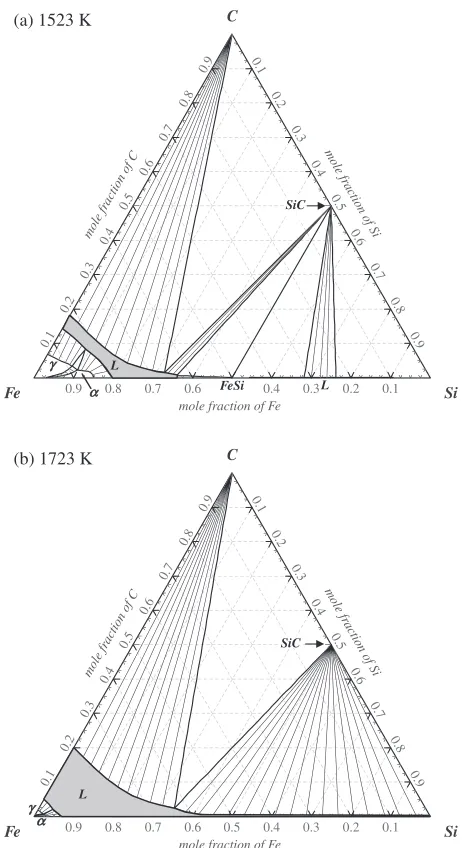
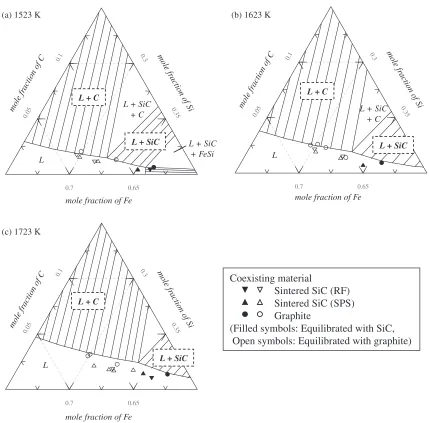
The calculated results of the isothermal section of the Fe-Si-C system at 1523 and 1723 K are shown in Fig. 8(a) and 8(b), respectively. These diagrams do not represent the solid-liquid phase equilibria in the Fe-Si system and thermody-namic properties for solid phases in the system should be revised in combination with activity data. The liquid phase saturated with SiC can be obtained in the iron-rich compo-sition as well as the silicon-rich compocompo-sition. The magnified fields around the calculated double saturation composition of SiC and graphite at 1523–1723 K are illustrated in Fig. 9(a)– 9(c) together with the experimental results from the previous
section. The double saturation compositions for SiC and graphite in the liquid phase at corresponding temperatures are estimated to be Fe-33, 34 and 35 mol% Si, respectively. Despite the solubility of SiC being slightly overestimated at high temperature, probably due to the influence of the ternary interaction on the Gibbs energy, a fairly good agreement was obtained between experiments and calculations. The validity of the estimated equilibrium relationship of the iron-rich liquid phase saturated with SiC in the Fe-Si-C system was thus confirmed.
The validity of the thermodynamic calculation for the phase relationship between graphite and the liquid phase was also examined. Schu¨rmann et al.19) investigated the equi-librium composition of the liquid phase saturated with graphite in the Fe-Si-C system. The liquidus compositions at 1623 and 1823 K are presented in Fig. 10 together with the calculated liquidus lines. Since the experimental and calcu-lated curves are similar at both temperatures the thermody-namic properties of the liquid phase can be applied to the graphite saturated iron-rich composition.
To optimize the Fe-Si solvent for rapid crystal growth of SiC the temperature dependence of SiC solubility in Fe-Si melts and molten silicon were calculated as shown in Fig. 11. The solubility of SiC in iron-rich Fe-Si alloy was found to be 100 times higher than in silicon-rich alloys. In addition, a strong temperature dependence is observed for the iron-rich alloy. The Fe-Si melt of Fe-36 mol% Si composition which possesses high SiC solubility is expected to be a suitable solvent for rapid liquid phase growth of SiC.
4. Conclusion
To design the Fe-Si solvent for the rapid growth of SiC we investigated the equilibrium phase relationship between SiC and the liquid phase in the Fe-Si-C system. The results are summarized as follows:
We measured carbon solubility in molten silicon at 1873 K by equilibration of silicon with SiC to verify previously reported measurements. Thermodynamic properties of the liquid phase in the Si-C system were reassessed based on reliable solubility data. The liquid phase of the Si-C system exhibited regular behavior below 6 mol% C and the regular solution parameter was determined to be 87001800
(J/mol).
The phase relationship between SiC and the liquid phase in the Fe-Si-C system was investigated by an equilibration technique at 1523–1723 K. It was found that the Fe-36 mol% Si alloy equilibrates with SiC at these temperatures. The obtained solubilities of SiC in the Fe-36 mol% Si melts were similar to results of the thermodynamic calculation. The calculated results showed much higher solubility of SiC in iron-rich Fe-Si melts than in silicon-rich melts. The Fe-Si melt of Fe-36 mol% Si composition is thus expected to be a suitable solvent for liquid phase growth of SiC.
Acknowledgement
This research is partly supported by a Grant-in-Aid for Young Scientists (Start-up) and Priority Assistance for the Formation of Worldwide Renowned Centers of Research
-0.1 0.2 0.3 0.4 0.5 0.6 0.7 0.8 0.9 0.1 0.2 0.3 0.4 0.6 0.7 0.8 0.9 0.1 0.2 0.3 0.4 0.5 0.6 0.7 0.8 0.9 mole fr
action of C
mole fraction of Fe mole fr
action of Si
C Fe Si 0.1 0.2 0.3 0.4 0.5 0.6 0.7 0.8 0.9 0.1 0.2 0.3 0.4 0.5 0.6 0.7 0.8 0.9 0.1 0.2 0.3 0.4 0.5 0.6 0.7 0.8 0.9 mole fr
action of C
mole fraction of Fe mole fr
action of Si
C
Fe Si
(a) 1523 K
(b) 1723 K
SiC L L γ α FeSi γ α SiC L
[image:6.595.53.286.70.494.2]The Global COE Program (Project: Center of Excellence for Advanced Structural and Functional Materials Design) from the Ministry of Education, Culture, Sports, Science and
Technology (MEXT), Japan. The authors are thankful to Prof. Kazuki Morita and Dr. YoungJo Kang in the University of Tokyo for their kind assistance on the measurement of carbon content of the sample.
0
0.1
0.2
0.3
0
0.1
0.2
Mole fraction of silicon,
X
SiMole fraction of carbon,
X
C1623 K
1823 K
Calculated;
Present work
Shurmann et al.
19) [image:7.595.83.512.67.490.2]1823 K
1623 K
¨
Fig. 10 Calculated liquidus lines of the liquid-graphite equilibrium in the Fe-Si-C system at 1623 and 1823 K with experimental values from Schu¨rmannet al.19)
1573 1673 1773
10-5 10-4 10-3 10-2 10-1 100
Fe-36 mol% Si
Fe-70 mol% Si
Fe-75 mol% Si Si
Temperature, T / K
Mole fraction of SiC,
[image:7.595.55.283.527.695.2]XSiC
Fig. 11 Temperature dependence of SiC solubility in Fe-Si melts and in molten silicon.
(a) 1523 K
0.05 0.1
0.65 0.7
0.3
0.3 5
mole fraction of Fe mole fr
action of C
mole fr
action of Si
L
L + SiC + C
L + SiC + FeSi
L + SiC L + C
(b) 1623 K
0.05 0.1
0.65 0.7
0.3
0.3 5
mole fraction of Fe mole fr
action of C
mole fr
action of Si
L + SiC L + C
L + SiC + C
L
(c) 1723 K
0.05 0.1
0.65 0.7
0.3
0.35
mole fraction of Fe mole fr
action of C
mole fr
action of Si
L + SiC L + C
L
Coexisting material
Sintered SiC (RF) Sintered SiC (SPS) Graphite
(Filled symbols: Equilibrated with SiC, Open symbols: Equilibrated with graphite)
[image:7.595.319.530.533.688.2]REFERENCES
1) O. Filip, B. Epelbaum, M. Bickermann and A. Winnacker: J. Crys. Growth271(2004) 142–150.
2) T. Ujihara, S. Munetoh, K. Kusunoki, K. Kamei, N. Usami, K. Fujiwara, G. Sazaki and K. Nakajima: Thin Solid Films476(2005) 206–209.
3) R. I. Scace and G. A. Slack: J. Chem. Phys.30(1959) 1551–1555. 4) J. Lacaze and B. Sundman: Metall. Trans. A22A(1991) 2211–2223. 5) J. Chipman, J. C. Fulton, N. Gokcen and G. R. Caskey, Jr.: Acta Metall.
2(1954) 439–450.
6) R. Hultgren, P. D. Desai, D. T. Hawkins, M. Gleiser and K. K. Kelley:
Selected Values of the Thermodynamic Properties of Binary Alloys, (American Society for Metals, Metals Park, Ohio, 1973) pp. 871–883. 7) P. Gustafson: Scand. J. Metall.14(1985) 259–267.
8) P. Nikolopoulos, S. Agatho Pou Los, G. N. Angelopoulos, A. Naoumidis and H. Gru¨bmeier: J. Mater. Sci.27(1992) 139–145. 9) R. N. Hall: J. Appl. Phys.29(1958) 914–917.
10) S. Suhara, N. Yuge, M. Fukai and F. Aratani: CAMP-ISIJ2(1989) 1341.
11) K. Yanaba, M. Akasaka, M. Takeuchi, M. Watanabe, T. Narushima and Y. Iguchi: Mater. Trans. JIM38(1997) 990–994.
12) T. Nozaki, Y. Yatsurugi and N. Akiyama: J. Electrochem. Soc.117
(1970) 1566–1568.
13) L. L. Oden and R. A. McCune: Metall. Trans. A18A(1987) 2005– 2014.
14) A. T. Dinsdale: Calphad15(1991) 317–425.
15) O. Kubaschewski, C. B. Alcock and P. J. Spencer: Materials Thermochemistry 6th Ed., (Pergamon press, New York, 1993) p. 308. 16) J. Miettinen: Calphad22(1998) 231–256.
17) T. B. Massalski, J. L. Murray, L. H. Bennett and H. Baker:Binary Alloy Phase Diagrams, vol. 1, (American Society for Metals, Metals Park, Ohio, 1986) p. 590.
18) H. Sakao, A. Kubo and Y. Ishino: Proc. Int. Conf. Sci. Tech. Iron Steel, (Tokyo Iron & Steel Inst. Japan, 1971) pp. 449–452.