Microstructural and Mechanical Study of the Al
20Sn (mass
%
) Alloy
Processed by Equal-Channel Angular Pressing by Route C
C. Hernández
1, I. A. Figueroa
1, C. Braham
2, O. Novelo-Peralta
1,
G. A. Lara-Rodriguez
1and G. Gonzalez
1,+1Instituto de Investigaciones en Materiales, Universidad Nacional Autónoma de México, Circuito exterior S/N, Cd. Universitaria,
A.P. 70-360, Coyoacán, C.P. 04510, Mexico
2Laboratoire Procédés et Ingénierie Mécanique et Matériaux ENSAM, 151, bd de l’Hôpital 75013, Paris, France
In this work, the feasibility of an Al20Sn (mass%) alloy to improve its mechanical properties through the Equal Channel Angular Pressing (ECAP) process is presented and discussed. Al20Sn (mass%) alloy samples with a square section of 16©16 mm and a length of 100 mm were subjected to the ECAP process through route C (i.e., rotation of 180 degrees between each pass). The characterization of the samples was carried out using X-ray diffraction and the sin2(¼) method for residual stresses. Scanning Electron Microscopy (SEM) was used to analyze the morphology and grain size. Vickers microhardness was carried out to analyze the homogeneity of the states of deformation and tensile testing to evaluate the yield strength, ultimate tensile strength and elongation. The results showed that the residual stresses were relatively low, confirming the effect of Sn as stress reliever. The grain size was refined to a sub-micron scale and a ribbon-like morphology was observed. The microhardness values of the severely deformed samples showed a significant increase when compared to the as-cast sample. The tensile tests showed an increase in the yield strength after thefirst pass, that doubled the yield strength of the as cast sample. A marginal increase in the yield strength after thefifth pass was observed; whilst the ductility remained very similar from 1 to 5 passes. [doi:10.2320/matertrans.M2012378]
(Received November 12, 2012; Accepted March 15, 2013; Published May 25, 2013)
Keywords: aluminum alloys, equal channel angular pressing, residual stress
1. Introduction
Equal-channel angular Pressing (ECAP) is a severe plastic deformation technique, which has shown the ability to process a metal with relatively large grain size (0.11 mm), achieving a significant grain refinement in the submicrometer or even nanometer range. With this, it is possible to improve the mechanical and physical properties, such as yield strength, ultimate tensile strength and hardness, without significant loss of ductility. To achieve this, it requires imposing high shear strains, introducing a high density of dislocations and dislocation cells. As a consequence new grain boundaries, sub-grains and therefore, due to the rotation process, new grains with relatively high misorientation are produced.16) In the literature, the vast majority of the systems that have been tested by ECAP possess a FCC Bravais lattice, being the aluminum (Al) based alloys the most frequently used.714)
The alloy Al20Sn (mass%) that has never been studied when subjected to the ECAP process is the industrial interest, since it could be used for the production of bearings and antifriction systems. K. Xu et al. studied AlSn alloys processed by conventional extrusion with high levels of deformation (©=7.41).15) They reported an enhancement in the tensile strength, but they did not report the ductility behavior of the investigated alloy. In the longitudinal section of extrusion, the presence of a microstructure with Sn filaments, parallels to the longitudinal section, were observed. Previous studies have shown that if the deformation is carried out by rolling,16)the microstructure displayed by Sn changes from filaments to plaques. It was found that the separation between these plaques is a function of the strain and followed a Hall-Petch relation with the hardness. For
alloys with 4 and 8 mass%of Sn, we reported17)a significant grain reduction with only 2 ECAP passes, and the formation of heterogeneous sub-grain microstructure. Based on the above, it is thought that Sn plays an important role on the reduction of the internal stresses, since Sn absorbs the mechanical energy generated during the deformation process, and during the recrystallization at room temperature this energy is dissipated. Besides, as the deformation increases, the thickness of such plaques decreases, forming a closed laminar structure. Therefore, we believe that an Al alloy with higher Sn content than the previously reported, will allow observing, in a more clearly fashion, the local deformation during the ECAP process. The purpose of this work is to observe the local mechanisms of deformation and hardening, produced during the ECAP process for an alloy with high Sn content, i.e., Al20Sn (mass%). The correlation between the microstructure and the mechanical properties, and the role of Sn on the deformation process will be also assessed.
2. Experimental
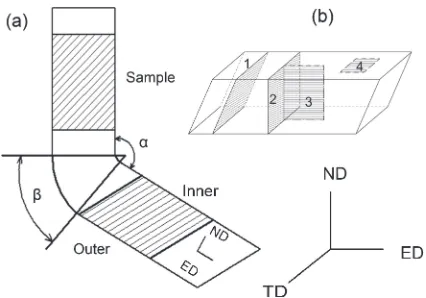
The alloy Al20Sn (mass%) was prepared in an induction furnace. The ingots obtained were machined into bars of dimensions of 16 mm©16 mm©100 mm. These bars were processed by ECAP at 298 K (room temperature) using a H13 heat treated steel die, which has a channel with internal angle, ¡, of 120° and an external angle, ¢, of 20°, as shown in Fig. 1(a). With this configuration, the deformation equivalent, ¾ECAP, for one pass by ECAP was¾ECAP=0.63 and forfive passes was¾ECAP=3.17.2)The bars were rotated 180° between successive steps of the ECAP process using the so-called “route C”. To reduce friction between the sample and walls of the ECAP die set, MoS2 was used as lubricant. A hydraulic press of 240 tons was used for this purpose.
In the ECAP processed square section samples, three distinctive directions can be defined, i.e., ED: extrusion direction, ND: normal direction and TD: transverse direction, as shown in Fig. 1(b). From thisfigure, four different planes were drawn in order to point out the zones of the bar, where the different characterizations were carried out. It is worth noting that for characterization purposes, plane 1 was chosen for odd ECAP passes (1, 3 and 5) and plane 2 for the even passes (2 and 4).
2.1 Structural characterization
The morphology and microstructure of the ECAP-processed Al20Sn (mass%) alloy samples were analyzed by SEM with a JEOL 7600FEG mode BSE (back-scattered electrons). These samples were taken from plane 1 for the odd ECAP passes and plane 2 for even passes (Fig. 1(b)) and prepared by conventional metallography. Transmission Electron Microscopy observations were done by means of a JEOL ARM 200 KV. For the TEM analysis, thin foils taken from plane 1 for odd ECAP passes and plane 2 for the even passes (Fig. 1(b)), were prepared with a focused ion beam apparatus (FIB JEOL JEM-9320). These planes were taken for the analysis, since they are perpendicular to the flow direction.
2.2 XRD characterization
The XRD characterization was mainly used for determin-ing the residual stresses for the ECAP-processed Al20Sn (mass%) alloy samples. For this purpose, a Bruker D8 Advance diffractometer using Cu-K¡wavelength, equipped with a K¡2-Ge primary monochromator and a linear detector VANTEC 2000 was used.
The residual stress analysis was carried out from the inner part of the highly deformed bar, plane 4 (Fig. 1(b)). In this particular case, the samples were chemically attacked with a solution of 80% of H3PO4 and 5% HNO3. The objective of this methodology is to determine the residual stress profile as a function of depth of the deformed sample. The plane (422) at 2ª=137.6° was used as reference. The residual stress values after each pass were corrected taking into account the redistribution of stresses induced by the removal of the outer layer.18)The residual stress (type I) was determined in three orientations: º=0, 45 and 90°, in order to calculate the complete stress tensor (where º, corresponds to the angle
formed between the residual stress measurement direction and ED).
The stresses can be determined from the measured strains using the following equation:
¾º¼¼S1ð·11þ·22þ·33Þ
þ12S2ð·11cos2ºþ·12sin 2ºþ·22sin2ºÞsin2¼
þ1
2S2ð·13cosºþ·23sinºÞsin 2¼
þ12S2ð·33cos2¼Þ ð1Þ
Where ¼ corresponds to the tilt angle of the sample with respect to ND.
The stress components along theºdirection are the normal stress ·º and shear stress ¸º are given by the stress tensor components in the sample coordinates, as follows:
·º¼·11cos2ºþ·22sin2ºþ·12sin 2º ð2Þ ¸º¼·13cosºþ·23sinº ð3Þ
The expression (1) predicts a linear relationship between the microstrains with sin2¼. From the slope of the¾º¼vs sin2¼ plot, the residual stress can be calculated. The terms S1= ¹¯/E and 1/2S2=(1+¯)/E; where, E, is the Young’s modulus and, ¯, is the Poisson’s ratio, and include the cor-rection of the anisotropy effect of aluminum in the crystallo-graphic direction in which the measurements were performed.
2.3 Thermo-mechanical properties
Samples with dimensions of 35 mm©5 mm©1 mm were cut along the extrusion direction (plane 3, Fig. 1(b)) for Dynamic Mechanical Analysis (DMA). This test was performed with a TA Instruments Q800. The dynamic response of the samples was measured from room temper-ature to 473 K with a controlled heating rate of 3 K/s. The loading frequency and the strain amplitude were 1 Hz and 1©10¹4, respectively.
The DMA is a thermal analysis technique, which measures the properties of materials as they are deformed under periodic stress. Specifically, a variable sinusoidal stress
·ð½Þ ¼·oþei½t is applied, and the resultant sinusoidal strain is measured, ¾ð½Þ ¼¾oþeið½t¤Þ. Where ½ is the frequency of oscillation,tis the time,¤is the phase lag,·ois the maximum stress and ¾o is the strain at the maximum stress. If the material evaluated is purely elastic, the phase lag between the cycled stress and strain is zero (i.e., they are in phase). If the material is purely viscous, the phase lag is
³/2.19)The magnitude of ¤, together with the amplitudes of the stress and strain waves, is used to determine the complex modulusE*.
The Complex modulus,E*is defined as:
E ¼· ¾ ¼
·o
¾o ðcosð¤Þ þisinð¤ÞÞ ¼E0þE00 ð4Þ
Where E0¼ ð·o=¾oÞ ðcosð¤ÞÞ is the storage modulus, E00¼ ð·o=¾oÞ ðisinð¤ÞÞis the loss modulus and tanð¤Þ ¼E00=E0 is
defined as the damping capacity.
The damping capacity is related to the increase of density of dislocations, and provides an evidence of the effectiveness of ECAP in the refining process.
[image:2.595.63.276.68.217.2]The Vickers microhardness (HV) was measured using a microhardness tester Shimadzu HMV-2000 with a load of 200 g and 10 s of exposure. The samples for the microhard-ness were taken from the central zone of planes 1 and 2 (Fig. 1(b)), at least 12 measurements were performed for statistical purposes. The tensile test was carried out by means of a Shimadzu universal machine AG-X with a constant strain rate of 1.7©10¹3s¹1. With this analysis, the yield strength (·y), the ultimate tensile strength (UTS) and elongation of the samples with 0, 1 and 5 ECAP passes were determined. The tensile test specimens were taken from plane 3 (Fig. 1(b)), with a gauge length of 10 mm, a width of 3 mm and a thickness of 2 mm. It is worth mentioning that in order to avoid the surface friction effect induced by the process; a layer of 3 mm of the tensile sample surface was also skinned out.
3. Results and Discussion
3.1 Extrusion
Figure 2(a) shows the ECAP die set during the extrusion process and Fig. 2(b) displays the resulting samples from 0 to 5 passes. Figure 2(b) shows the as-cast sample without visible casting defects. This figure also comprises the resulting samples after each pass. It is well known that after the ECAP process, the sample ends change the original square cross-section to a rectangular one. In order to maintain a homogenous pressure during the extrusion process, the geometrically modified bottom and tip of the deformed bar were cut, after each pass.
3.2 Structural characterization
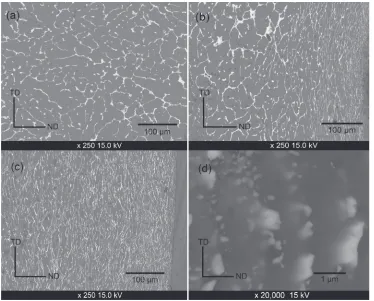
Figure 3 shows the SEM observed microstructure of the as-cast and deformed Al20Sn (mass%) alloy samples. The as-cast sample (Fig. 3(a)) shows the typical microstructure of an immiscible alloy, as reported elsewhere. Where Al corresponds to the dark gray and Sn to the bright zones. Figures 3(b), 3(c) and 3(d) show the samples processed by ECAP, where the extrusion direction is normal to the image view. The central area of the deformed samples showed a microstructure with an apparent less deformation, rather similar to the microstructure showed in the as-cast alloy sample. On the other hand, near the surface, the micro-structure showed a clear evidence of the deformation state, with a visible highly aligned Sn ribbon-like pattern.
Fig. 2 (a) ECAP die set during the extrusion process and (b) resulting samples from 0 to 5 passes.
[image:3.595.314.542.72.197.2] [image:3.595.113.487.461.762.2]From the samefigure, it is thought that during thefirst pass (1 and 2), the initial change in the microstructures is not only due to the deformation caused by the ECAP process but also because of the surface friction effect (visible within thefirst layer, i.e., 100«50 microns from the surface of the sample). However, as the number of ECAP passes increases, the micro-deformation in the whole sample could be associated to the deformation process itself. Figure 3(d) shows, at high magnification, the internal structure of the highly deformed sample (after 5 passes), where the ribbon-like structure observed at low magnifications turned out to be a conglom-eration of fragmented small Sn particles aligned in the same direction.
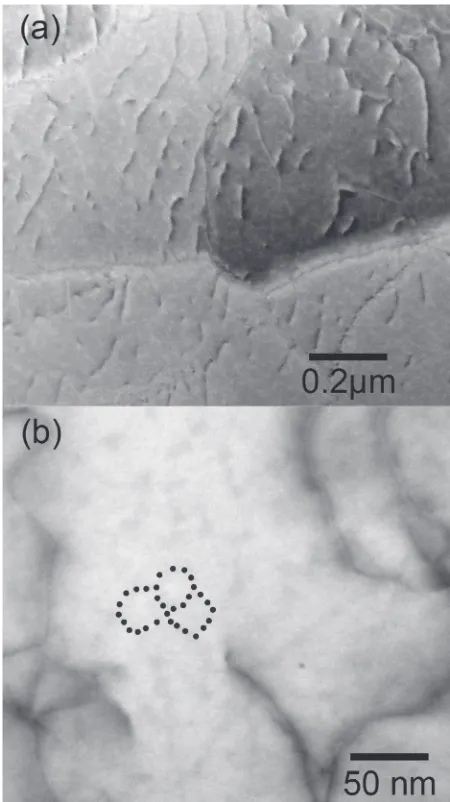
Figure 4 shows the microstructure evaluated by TEM at the central area of the samples subjected to the maximum plastic deformation reached in this study, i.e., five ECAP passes. Figure 4(a) displays a zone with a high dislocation density, in HAADF mode which is precursor of dislocation cells and subgrain boundaries formation. At higher magni-fications, the above-mentioned dislocations confirmed the presence of subgrains (BF mode), as shown in Fig. 4(b). In
thisfigure the subgrains are clearly indicated within the black dots traced in the image.
3.3 XRD characterization
As previously reported, the most important changes in the residual stress state occur during the first pass.5,9) Figure 5 shows a schematic of the residual stress test, where anglesº and ¼, are defined with respect to ED and ND direction, respectively. Figure 6 shows the residual stress depth profile from the surface of the inner plane 4 (Fig. 1(b)), taken at
º=0, 45 and 90°.
Figure 6(a) shows the normal residual stress profile obtained from the sin2¼ method for 1 ECAP pass. The resulting residual stress·º, showed a similar tendency for the three angles studied (º=0, 45 and 90°). As can be observed, this figure has been divided in three distinctive zones; these
Fig. 5 Schematic diagram showing the strain measured by X-ray diffraction in the sample coordinates.
Fig. 4 TEM images for the sample subjected to 5 ECAP passes. (a) A high dislocation density observed in HAADF mode and (b) subgrains contrast observed in BF mode.
[image:4.595.56.281.69.470.2] [image:4.595.317.536.69.218.2] [image:4.595.322.530.266.547.2]zones are closely related to the nature of the process. Zone I (020 µm) is the resultant of the combination of three main factors: (a) the friction between the mold and the sample, (b) the plastic deformation due to the ECAP process and (c) the stress relief near the surface. In Zone II (2060 µm) the stress relief effect is no longer affecting and the friction effect is clearly residing. This gives place to the evolution of the compressive state towards positive or near zero values. Zone III (6080 µm) clearly shows the formation of a plateau. It is thought that the values shown in this zone are exclusively related to the ECAP process and will remain constant, being the bulkfinal value of the deformed material. Figure 6(b) displays the shear residual stress profile, ¸º, at º=0, 45 and 90°. These results also showed a similar behavior in the three studied directions. A state of compression at the surface level, that after 20 µm tends to increase gradually up to 80 µm. The similarities in the 3 directions of º, suggest some degree of isotropy in the material properties.
3.4 Thermo-mechanical characterization
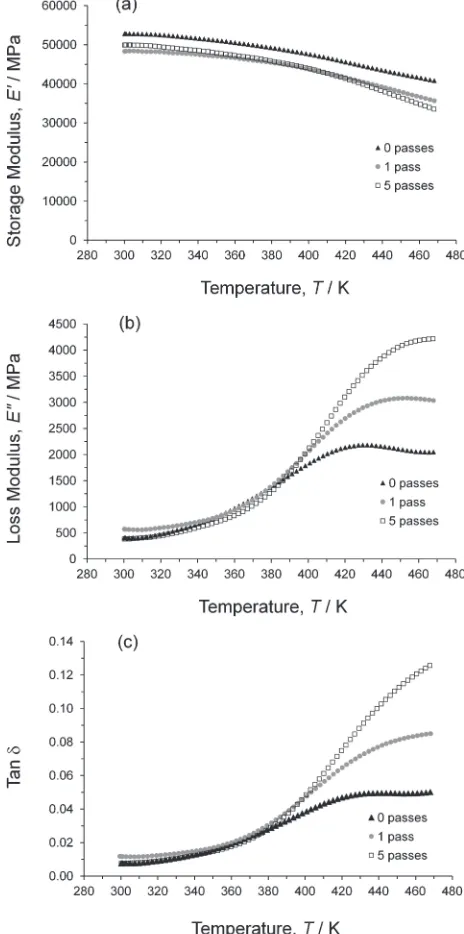
The complex modulus and damping capacity of the Al 20Sn (mass%) with 0, 1 and 5 passes by ECAP, are shown in Figs. 7(a), 7(b) and 7(c), respectively. As the temperature increases, the storage modulus decreases and the loss modulus and the damping capacity increases. These moduli were also influenced by the ECAP, since the deformation process imposed, decreased the elastic behavior of the alloy (reducing the storage modulus) and increased the viscoelastic properties (increasing the loss modulus) and therefore the material should have a greater damping capacity. This suggests a microstructure with high amount of density of dislocations and dislocation cells, proving the effectiveness of ECAP as grain refining process.
Analyzing the experimental results, it was found that there is an inflection point at400 K (Figs. 7(b) and 7(c)). At this point the behavior of the samples subjected to the DMA tend to split, being the sample with 5 ECAP passes the one that showed the highest damping capacity. In previous studies,17) for lower Sn content, we reported a similar behavior, where the inflection point was modified as a function of the amount of Sn, i.e., when the Sn content increases, the temperature of the inflection point also rises. It is thought that the mechanism that is causing this effect is related to the fact that Sn tends dissipates part of the energy induced by the DMA. Simultaneously, the energy added to the system is also dissipated due to the dislocation cells movement. Therefore and taking into consideration both effects, the energy required to move the dislocation cells of the alloy will be partly taken by Sn and as a consequence, more energy will be needed.
During the ECAP process, it is possible to get an increment of ductility, since the plastic deformation mechanism is not governed by dislocation slip, but by the grain boundary sliding. This is because of the nanometric scale of the formed grain size. The grain boundary sliding mechanism has already been reported in the literature as important in the severe plastic deformation processes,2,20)where the subgrain rotation is closely related to grain sliding, which helps to “randomize”the distribution of such orientation. On the other
hand, the mechanism of grain boundary sliding has been pointed out as responsible for ductility enhancement, even at low temperature.21)
Tensile test has been widely used to measure the yield strength evolution as a function of the grain size. Therefore, in this work, tensile tests were performed on samples with 0, 1 and 5 ECAP passes (¾ECAP=0, 0.63 and 3.17, respec-tively) in order to observe how the formation of tangles of dislocations, and the addition of Sn could play a role in the plastic behavior of the material, for at least 5 ECAP passes. The engineering stress vs strain plots for 0, 1 and 5 ECAP passes are shown in Fig. 8. It is clearly observed a significant increase in the yield strength after the first pass. For the as-cast sample, ·y was 47 MPa, but after the first pass, ·y increased up to 112 MPa. For the alloy with 5 ECAP passes the yield strength also increased but not as significant as after
[image:5.595.309.541.73.540.2]the first pass (130 MPa). The ultimate tensile strength also displayed a similar trend, as shown in the inset of Fig. 8. It is worth noting that the result of the yield strength after thefirst ECAP pass (112 MPa) is also higher than the average value reported for the commercial AlSn alloys (23.445.5 MPa, ASTM B 23, Table 1) that are normally used in anti-friction systems.22)The elongation to failure dropped down consid-erably after 5 ECAP passes, however, it is though that a possible ductility recovery could be achieved when perform-ing more passes.23,24)As already mentioned, the limitation of sample size was the main factor for the number of passes carried out in this work (Fig. 2(b)).
Figure 9 shows the evolution of Vickers microhardness (Hv) as a function of the number of ECAP passes. As expected, the ECAP process did increase the microhardness of the investigated alloy. The effect of the ECAP process was clearly observed when passing from the as-cast sample to the 1 pass sample, where the Hv increased more than 84%. In general terms, the microhardness evolved following a logarithmicfit. It is worthy of mention that the microhardness
obtained after thefirst ECAP pass (Hv=361 MPa) is higher than the average value (Hv=264 MPa) for the classic bearing alloy systems, used as antifriction commercial alloys.22)The hardness results are consistent with the trends observed in those for the yield strength (Fig. 8).
The study of the Al20Sn (mass%) alloy through ECAP process has been of great benefit for observing where the deformation process is more intense. Actually, it was found that Sn does point out the highly plastics deformation zones (ribbon-like microstructure), that were found nearby the contact surface. It is though that, in other systems with low tribological properties, this compressive zone would be much more extended.
The high density of dislocations observed, suggests a grain refinement mechanism linked to recovery and continuous dynamic recrystallization processes (transformation of sub-grains into new sub-grains), which are controlled in turn by the severe plastic deformation imposed during ECAP process. This behavior has been demonstrated in previous studies in other aluminum alloys.25)Remarkably low levels of residual stress and microstrain, despite the 5 ECAP passes were observed when compared to other SPD studies on Al based alloys.26,27)This suggests an important role of Sn to limit the elastic energy stored after each ECAP pass. From previous studies, with lower content of Sn, and the results presented in this work, it is thought that additions above 20 mass% of this element would be detrimental to the refinement effect produced by the ECAP, since the energy generated during the process will not generate the formation of subgrains, as this energy will be partly or mostly absorbed and dissipated by Sn.
From the point of view of technological interest, it can be said that the levels of hardness, tensile strength, ultimate tensile strength and the ductility of the alloy Al20Sn processed by ECAP represents a set properties comparable or even higher to standard and commercial alloys,22)as shown in Table 1. Besides, these commercial alloys make use of additions such as Ni, Cu, Sb, etc., that increase the cost of such alloys.
4. Conclusions
In this work, it is reported for the first time the behavior of an AlSn alloy with 20 mass% of Sn. After the ECAP process, highly deformed zones were found near the inner
[image:6.595.312.534.67.211.2]Fig. 8 Tensile engineering stress vs strain curves for 0, 1 and 5 ECAP passes, inset: Yield strength and ultimate tensile strength values.
Table 1 Physical properties of white metal bearing alloys and the Al20Sn (mass%) alloy.
Properties ASTM B 23 Commercial alloys
Al20Sn 1 pass
Al20Sn 5 passes
Specific gravity 7.3410.05 7.349.9 3.62 3.62 Yield point,
MPa (293 K) 23.445.5 unspecified 47 130 Yield point,
MPa, 0.2% unspecified 4384 ® ® Ultimate tensile
strength, MPa (293 K)
unspecified 78102 82 141
Elongation (%) unspecified 18.4 12 15 Brinell Hardness*,
MPa (293 K) 167265 208343 ® ® Vickers Hardness*,
MPa (293 K) unspecified unspecified 361 453
*Vickers hardness is slightly greater than the Brinell hardness values.
[image:6.595.48.289.69.258.2] [image:6.595.47.291.337.508.2]and outer surface of the sample. It was possible to measure the extension of the deformed zone because of the tendency of Sn to form an aligned ribbon-like structure in those zones. The DMA revealed an inflection point at400 K, where the curves tended to split as a function of the number of ECAP passes. It is believed that this mechanism is related to the fact that Sn tends dissipates part of the energy induced by the DMA. As a result, the energy required to move the dislocation cells of the alloy will be partly taken by Sn, and therefore, the more Sn added to the alloy, the more energy will be needed to reach the inflection point. The value of the yield strength after the first ECAP pass, increased more than double the value for the as-cast sample and for the anti-friction commercial AlSn alloys. The elongation to failure decreased after 5 ECAP passes. However, it is thought that a possible ductility recovery could be achieved when performing more passes. The yield strength results were consistent with the trends observed in those for the hardness test. Finally, it is believed that above 20 mass% of Sn in Al alloys would inhibit the formation of dislocation tangles and therefore the efficiency of the ECAP process as grain refiner.
Acknowledgments
The authors would like to thank the financial support from the Mexican Council for Science and Technology (CONACYT) through projects No. 166896 and 178289 and PAPIIT-UNAM 100712. C. Hernandez thanks the Ph.D funding No. 333674 also granted by CONACYT. Valuable technical support provided by A. Tejeda, J. M. Arellano, E. Sanchez, G. Aramburo, E. Ramos, J. J. Camacho, C. Flores, R. Reyes, J. Morales and C. Gonzalez is also acknowledged.
REFERENCES
1) V. M. Segal:Mater. Sci. Eng. A271(1999) 322333.
2) R. Z. Valiev and T. G. Langdon:Prog. Mater. Sci.51(2006) 881981.
3) C. Xu, M. Furukawa, Z. Horita and T. G. Langdon:Acta Mater.51
(2003) 61396149.
4) C. Xu, M. Furukawa, Z. Horita and T. G. Langdon:J. Alloy. Compd.
378(2004) 2734.
5) C. Xu, M. Furukawa, Z. Horita and T. G. Langdon:Mater. Sci. Eng. A
398(2005) 6676.
6) V. Segal:Processing Mechanics and Structure Formation During SPD. Severe Plastic Deformation, (Nova Science Publishers Inc., New York, 2006) pp. 322.
7) D. G. Morris and M. A. Muñoz-Morris:Acta Mater.50(2002) 4047 4060.
8) Z. Horita:Mater. Sci. Forum519521(2006) 14851492.
9) M. Saravanan, R. M. Pillai, K. R. Ravi, B. C. Pai and M. Brahmakumar:Compos. Sci. Technol.67(2007) 12751279.
10) P. Leo, E. Cerri, P. P. De Marco and H. J. Roven:J. Mater. Process. Technol.182(2007) 207214.
11) M. Hockauf, L. W. Meyer and L. Krüger:Mater. Sci. Forum584586
(2008) 685690.
12) W. Wei, K. X. Wei and G. J. Fan:Acta Mater.56(2008) 47714779.
13) A. S. M. Agena:J. Mater. Process. Technol.209(2009) 856863.
14) M. Cabibbo, E. Evangelista and C. Scalabroni:Micron36(2005) 401 414.
15) K. Xu, A. M. Russell, L. S. Chumbley and F. C. Laabs:Scr. Mater.44
(2001) 935940.
16) O. Hernández and G. Gonzalez:Mater. Charact.59(2008) 534541.
17) G. González, C. Braham, J. L. Lebrun, Y. Chastel, W. Seiler and I. A. Figueroa:Mater. Trans.53(2012) 12341239.
18) Residual stress measurements by X-ray diffraction, SAE J784a. SAE information Report, 2nd edition, (August, 1971).
19) J. Zhang, R. J. Perez and E. J. Lavernia:J. Mater. Sci.28(1993) 835 846.
20) J. Markmann, P. Bunzel, H. Rösner, K. W. Liu, K. A. Padmanabhan, R. Birringer, H. Gleiter and J. Weissmüller:Scr. Mater.49(2003) 637
644.
21) S. X. McFadden, R. S. Mishra, R. Z. Valiev, A. P. Zhilyaev and A. K. Mukherjee:Nature398(1999) 684686.
22) White metal bearing alloys (known commercially as“Babbitt metal”). ASTM B23-94, (2000) Volume 02.04, Issued June 2000.
23) Y. T. Zhu and T. G. Langdon:JOM56(2004) 5863.
24) R. Z. Valiev, I. V. Alexandrov, T. C. Lowe and Y. T. Zhu:J. Mater. Res.
17(2002) 58.
25) W. Skrotzki, N. Scherbaum, C. G. Oertel, H. G. Brokmeier, S. Suwas and L. S. Toth:Acta Mater.55(2007) 22112218.
26) M. Mahmoodi, M. Sedighi and D. A. Tanner:Mater. Des.40(2012) 516520.
27) F. Lefebvre, M. Francois, J. Cacot, C. Hemery, P. Le-bec, E. Baumhauer, D. Bouscaud and T. Bergey: Mater. Sci. Forum 681