Equal Channel Angular Pressing (ECAP) of
AA6082: Mechanical Properties, Texture and
Microstructural Development
by
Jens Christofer Werenskiold
A thesis submitted to
The Norwegian University of Science and Technology (NTNU) in partial fulfilment of the requirements for the degree of
Doktor Ingeniør
Trondheim Oktober 2004
NTNU
Norwegian University of Science and Technology
Doctoral theses
for the degree of Doktor Ingeniør Faculty of Natural Science
and Technology
Department of Materials Technology
IMT-report 2004:63. ISBN 82-471-6481-7 (electronic)
I. PREFACE
This work has been carried out at the Norwegian University of Science and Technology, (NTNU), Faculty of Natural Science and Technology, Department of Materials Technology. The research was carried out as part of the COMPFORM project and funded by the Norwegian Research Council and Hydro Aluminium AS.
This work has given me the opportunity to work in a new field of materials technology at NTNU and has been very educating. Hopefully, the initiation of this work will result in new insight in the field of severe plastic deformation (SPD) in coming years.
The thesis consist of a general introduction to equal channel angular pressing (ECAP), aluminium alloys and deformation mechanisms, followed by a detailed strain analysis of ECAP’ed materials, mechanical properties and finally a study of the microstructural and textural development resulting from equal channel angular pressing.
The main results presented in this thesis have been published (chapter 5), or are in the process of being published (chapter 6 and 7), in international journals and conference proceedings.
II. ABSTRACT
This thesis deals with the concept of ECAP applied to a commercial Al-Mg-Si alloy (AA6082.50). A detailed analysis of the strains introduced by ECAP in a single passage through the die has been made, based on direct measurements on partially pressed samples.
Further, the mechanical properties of ECAP’ed samples have been investigated. The effect of initial material temper and post-ECAP artificial aging was investigated in addition to the effect of strain accumulation and processing route.
Finally, a detailed study of the textural and microstructural development was made. The continuous evolution of texture and microstructure was followed through the ECAP deformation zone up to an accumulated strain of 2 (2 passes) by route A, and linked to strain measurements from the same zone.
Strain measurements on sectioned samples have validated the plane strain assumption for ECAP. The shear angle has been measured and some typical features of ECAP have been corroborated, i.e. friction and material temper affect the strain distribution, the strain homogeneity and the work-piece corner angle, friction being the most significant here. Also, new conclusions have been drawn. The analysis of material element deformation histories along path lines reveals that ECAP can be interpreted as the combination of shearing and stretching (i.e. tension and/or compression). Furthermore, the final shear strain angle obtained in ECAP appears to be friction and material temper independent in the zone of homogeneous deformation.
The 6082 alloy has been successfully processed by ECAP at room temperature to strains
İ
=6 toİ
=8. The alloy has been pressed in the solutionized, T4, homogenized and soft annealed states. The highest tensilestrength was obtained from the solutionized material, followed by T4, homogenized and soft annealed. This behaviour is linked to the solid solution content prior to ECAP and the potential for dynamic precipitation during ECAP processing.
The tensile elongation to failure drops to a constant level between 4% and 9% after ECAP and is highest for the soft annealed and lowest for the solutionized material. The ductility in the solutionized material can, however, recover to ~18% elongation to failure (i.e. an increase by a factor 2-3) by low temperature heat treatment with only a small drop in tensile strength.
Soft annealed and ECAP’ed material has been compared to cold rolling to similar strains. The tensile strength response to accumulated strain is similar, but the ductility and post uniform deformation is different. However, the ECAP’ed material can be processed to higher strains and, thus, achieving higher strength.
The tensile yield strength behaviour of the homogenized and ECAP’ed material can be described by a simple relation to the grain size and the fraction high and low angle boundaries.
The typical texture components related to ECAP of aluminium, pressed by route A, have been identified. The typical ECAP texture starts to develop already at ~25% strain and increases in intensity during the first pass. In the second pass, two of the stable texture components continue to increase in intensity, while the other texture components decrease.
The microstructural development during the first pass is dominated by deformation banding leading to grain-subdivision. The average linear intercept distance (grain size) is reduced from ~80μm to ~4μm for high angle boundaries and from ~10μm to ~0.7μm for low angle boundaries. During the second pass, the linear intercept distance is further reduced to
Deformation twins are observed during the second pass and are believed to play an important role in severe plastic deformation when the grains reach the sub-micron or nano-metre scale.
The deformation banding have been explained in terms of the low energy dislocation structure (LEDS) theory, and has been shown to be an important mechanism in the early stages of grain subdivision, and is further believed to be the main source of high angle grain boundary formation by grain subdivision down to a grain size of approximately ~0.6μm, when other deformation mechanisms may be energetically more favourable.
III. ACNOWLEDGEMENTS AND CONTRIBUTIONS
This research was carried out as part of the COMPFORM project and funded by the Norwegian Research Council and Hydro Aluminium AS.
I would like to thank my main supervisor, Prof. Hans Jørgen Roven for his great contributions and stimulating discussions and for motivating me during this work.
I would like to give a special to thank Dr. Stéphane Dumolin for his contribution to chapter 5: Strain analysis in ECAP. His involvement in strain measurements and aid in mathematical and continuum mechanical calculations is greatly acknowledged.
I would also like to thank Mr. Hans Bjerkaas for fruitful discussions regarding EBSD analysis, Mr. John Rasmus Leinum for help with XRD texture measurements, Mr. Håkon Atle Nesbø for his contributions to chapter 6 in performing the post ECAP heat treatments and mechanical testing, and Mr. Simen Olsen for sharing my office and lots of interesting discussions the last years.
Finally, I would like to thank my one and only Laila Beate Kjønstad for her patience, encourage and support over the past years.
IV. CONTENTS
I. Preface... 3
II. Abstract... 5
III. Acnowledgements and contributions... 9
IV. Contents... 11
1. Introduction... 14
2. Theoretical background... 16
2.1 General introduction to Equal Channel Angular Pressing... 16
2.1.1 Introduction... 16
2.1.2 The shearing characteristics associated with ECAP... 17
2.1.3 Grain refinement by ECAP... 23
2.1.4 Estimation of the strain in ECA Pressing... 26
2.1.5 Mechanical properties at room temperature... 28
2.1.6 High Strain Rate Superplasticity... 29
2.1.7 Textures by ECAP... 32
2.2 Aluminium alloys and deformation mechanisms... 34
2.2.1 Non-heat treatable aluminium alloys... 34
2.2.2 Heat-treatable aluminium alloys... 35
2.2.3 Deformation structures... 36
2.2.3.1 Dislocation slip and stored energy... 36
2.2.4 Grain refinement mechanisms... 38
2.2.4.1 Grain refinement by subdivision... 38
2.2.5 Alloying effects on subdivision... 45
2.2.5.1 Solute atoms... 45
2.2.5.2 Non-deformable particles... 46
2.2.5.3 Dislocation density in the grain interior... 47
2.2.6 Band formation in plastic deformation... 48
2.2.6.1 Bands of secondary glide... 49
2.2.6.2 Kink bands... 49
2.2.6.3 Stria bands... 50
2.2.6.4 Regular deformation bands... 50
2.2.6.5 Transition bands... 52
2.2.6.6 Hybrid / regular transition bands... 52
2.2.6.7 Shear bands... 52
2.2.7 Deformation banding in relation to the LEDS theory... 55
2.2.8 Theory of co-incidence site lattice boundaries... 61
2.3 Basic polycrystal plasticity... 63
2.3.1 The Sachs model... 64
3 ECAP die design... 69
3.1 The Piston... 69
3.2 The control system... 69
3.3 The Die... 70
3.3.1 Version 1.1... 70
3.3.2 Version 1.2... 71
4 Experimental procedures... 75
4.1 Strain analysis (referring to chapter 5)... 75
4.2 Mechanical properties (referring to chapter 6)... 77
4.3 Microstructure and texture (referring to chapter 7)... 78
5 Strain Analysis in ECAP... 80
5.1 Introduction... 80
5.2 Theoretical analysis... 80
5.2.1 Strain Analysis... 82
5.2.2 Flow and Deformation History Analysis... 86
5.3 Conclusion... 90
6 Mechanical properties in AA6082 subjected to ECAP... 91
6.1 Introduction... 91
6.2 Results... 93
6.2.1 The effect of ECAP on different initial material states... 93
6.2.2 The effect of processing route and tensile test strain rate.. ... 99
6.2.3 Comparison to conventional T6 heat treated non-ECAP’ed material... 100
6.2.4 Comparison with cold rolling... 100
6.2.5 The effect of post-ECAP artificial aging... 101
6.3 Discussion... 103
6.3.1 Influence of SPD strain accumulation... 103
6.3.2 Influence of initial temper... 105
6.3.3 Strain path and cold rolling... 108
6.3.4 Further comments on precipitation... 110
6.3.5 The grain size effect: Homogenized, route A... 114
6.4 Conclusions... 118
7 Microstructure and texture development in the deformation zone120 7.1 Introduction... 120
7.2 Experimental... 120
7.3 Strain measurements in the deformation zone... 124
7.4 Texture development... 129
7.4.1 Introduction... 129
7.4.2 Identification of the ideal texture components... 130
7.4.3 Texture development through the deformation zone in the 1st pass... 136 7.4.4 Texture development through the deformation zone in the
7.5.1 Introduction to the Aligned Cell Structure (ACS)... 152
7.5.2 Introduction to Deformation Bands (DB)... 154
7.6 Microstructural observations through the deformation zone: First pass... 156 7.6.1 25% strain... 156 7.6.2 50% strain... 165 7.6.3 60% strain... 172 7.6.4 70% strain... 182 7.6.5 80% strain... 187
7.6.6 100% strain (full passage through the deformation zone) 195 7.7 Microstructural observations through the deformation zone: Second pass... 197 7.7.1 10% strain in 2nd pass... 197 7.7.2 30% strain in 2nd pass... 199 7.7.3 50% strain in 2nd pass... 204 7.7.4 75% strain in 2nd pass... 211 7.7.5 95% to 105% strain in 2nd pass... 215 7.8 Deformation twins... 222 7.9 Discussion... 226 7.9.1 Texture evolution... 226 7.9.2 Microstructural development... 230
7.9.3 Deformation banding in ECAP explained by the LEDS theory... 241
7.10 Conclusions... 249
8 General conclusion... 250
1. INTRODUCTION
Materials processing by severe plastic deformation (SPD) have received vast focus in the research community the last five to ten years due to the unique physical and mechanical properties obtainable by SPD processing.
The process of SPD is based on intense plastic deformation of a work-piece, resulting in alteration of the microstructure and texture, in principal reduction of the grain size to the sub-micron or the nano-metre scale.
The most common process of SPD is the equal channel angular pressing (ECAP), which involves pressing a billet through a die consisting of two channels of equal cross sections, intersecting at an angle, typically 90°. The process of ECAP allows us to introduce very large plastic deformations to a work-piece without altering the overall geometry of the work-piece.
In the present thesis, the ECAP process has been applied to a commercial 6xxx series aluminium alloy. The deformation characteristics have been investigated by direct strain measurements on ECAP’ed samples. Further, the mechanical properties have been investigated for a series if processing parameters and finally, a detailed study of the texture development and deformation mechanisms have been made.
In the present work, the main focus has been to gain a better understanding of the deformation mechanisms operating in the ECAP process, which leads to the observed intense grain refinement. In this process, a vast amount of EBSD measurements was carried out, including two processing routes (route A and Bc) and eight accumulated strain levels, corresponding to eight ECAP passes.
Due to the enormous amount of collected data, it proved impossible to collect all results and observations in this thesis; therefore, the main focus
passes by route A. However, some results obtained at higher strains, i.e. higher number of passes, are included, such as grain size and misorientation distributions. The most important results on the microstructural development at higher strains will be published in international journals after the submission of the present thesis.
2. THEORETICAL BACKGROUND
2.1 General introduction to Equal Channel Angular
Pressing
2.1.1 Introduction
The ECAP process was first developed by V.M. Segal in the former USSR in 1977 [1]. This is a process employed to realize a “near ideal” deformation to the material. In 1950 A. Nadai realized that pure shear is the “ideal” deformation for extrusion and drawing [2]. With the ECAP method one can have a “near ideal” deformation by simple shear in the system [3]. The general principle for the method is shown in Figure 2.1. The tool is a block with two intersecting channels of identical cross-section. A well lubricated billet of the same cross-section is placed into one of the channels, and a punch then presses it into the second channel. Under these conditions the billet will move as a rigid body, and deformation is achieved ideally by simple shear in a thin layer at the crossing plane of the channels. When the punch is finished it is retreated and the billet has been uniformly deformed, except for a small zone in the lower part of the sample and in the end regions.
The die geometry is defined by the cross section area and the two angles
ĭ and Ȍ, the angle of intersection between the two channels, and the arc of curvature at the outer point of intersection respectively. It is possible to calculate, from the two angles, the shear strain or the effective von Mises strain resulting from pressing through the die.
The advantage with the ECAP method is that it is possible to introduce severe plastic deformation (SPD) by repeated pressing of the billet without any significant change in the cross section. Altering the billet orientation
makes it possible to control the microstructure and texture of the material, thus, altering the mechanical properties.
The principal of sample rotation was first noted by Segal [4] in 1995. The principal has been demonstrated in several recent experiments, i.e. [5-8].
It is now clear that the microstructural characteristics, and in particular the evolution of the microstructure during ECA pressing, depend upon the precise pressing conditions, and therefore upon the characteristics of the shearing introduced in each passage through the die. Furukawa et al. [6] were the first to analyze the shearing characteristics for several different pressing and rotation modes.
Figure 2.1: Principally sketch of ECA pressing.
2.1.2 The shearing characteristics associated with ECAP
There are several different processing routs for ECA pressing. They differ in the way the sample is rotated between each press. The most common are (I) not rotated, (II) rotated by +90q or ±90q between each consecutive pressing or (III) rotated +180q between pressings (Figure 2.2).
The shearing characteristics for these routes and in addition, two other processing routs have been analyzed by M. Furukawa et al. [6].
+-90 Route A
+90 +180
Route Bc Route C
Figure 2.2: Different processing routes.
The analysis is conducted for standard conditions where ĭ=90q and
Ȍ=0q. It has been shown in [9-13] that in this condition a potential difficulty arises, as revealed by finite element modelling, in filling the outer corner at the intersection of the two channels when friction is present. This analysis therefore, applies to an ideal frictionless condition, or more appropriate, to the central regions of the pressed sample where friction effects are small.
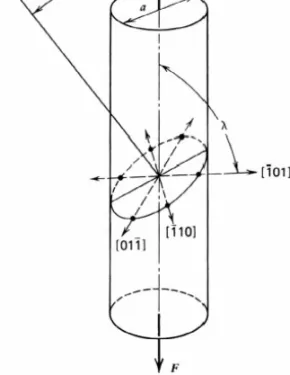
Schematic drawings of a cubic element contained within the test sample, on its passage through the die, is shown in Figure 2.3 to Figure 2.5, where the shaded plane at the lower left represents the theoretical shear plane and the planes X, Y and Z define three mutually orthogonal planes of sectioning that lie perpendicular to the longitudinal axis of the pressed sample and parallel either to the side faces or to the top face of the sample at the point of exit from the die, respectively.
It is apparent from Figure 2.3 that a single pressing through the die shears the cubic element into a rhombohedra shape. However, it is also
Figure 2.3: Schematic illustration of shearing in a single pressing through the die: X, Y
and Z define three orthogonal planes of observations [6].
Figure 2.4: Schematic illustration of shearing after two pressings with no rotation (route A) [6].
Figure 2.5: Schematic illustration of shearing after two pressings with rotation of 90q (route B) [6].
Figure 2.6 Schematic illustration of shearing after two pressings with rotation of 180q (route C) [6].
The effect of the second passage through the die is shown in Figure 2.4 to Figure 2.6 for the situation where the sample is either non-rotated (route A), rotated 90q (route B) or rotated 180q (route C), using the notation by Segal [4] and Ferrasse et al. [8]. It is clear from the figures that route A serves to markedly increase in distortion of the rhombohedra, route B increases the distortion in the Xand Z planes and route C restores the cubic element so that strain has been introduced to the element without any
To make it more clear, Table 2.1 shows the definition of the 6 different processing routes. It is important to note the difference between BA and BC
and the combinations BA-A and BC-A.
What happens to the cubic element shown in Figure 2.3 during subsequent pressings is illustrated schematically in Table 2.2, where the cubic element is viewed in planes of sectioning cut in the three orthogonal X, Y andZ planes.
Close inspection of Table 2.2 leads to several important conclusions concerning the effect of using these different processing routes.
Firstly, as noted earlier, route BA (0°–90°–0°–90°) has shearing
characteristics similar to route A, whereas route BC (0°–90°–180°–270°) has
characteristics similar to route C.
Secondly, route A exhibits continuous changes in the X and Y planes but no deformation of the cubic element in the Z plane, and route BA exhibits
continuous changes in all three planes. By contrast, the cubic element is restored after 4n passes in route BC and 2n passes in route C, where n is an
integer. In addition, there is no deformation in the Z plane when using route C. Thirdly, it is possible to make use of these tabulated characteristics to reach conclusions concerning the optimum processing route. Thus, routes BC and C appear preferable to routes BA and A because of the ultimate
restoration of the cubic element, and route BC appears preferable to route C
because of the lack of deformation in the Z plane in route C. By contrast, the processing route BA–A is clearly not attractive because of the increased
distortion with further pressings in each of the three orthogonal planes, but route BC-A, combining elements or routes BC and A, may represent an
optimum pressing condition because it combines both the introduction of high shear strains in each plane and their consequent recovery to restore the cubic element after a total of 8n pressings.
Table 2.1: Definition of the rotations in the different pressing routes [6].
Table 2.2: Schematics of the deformation of a unit element after npassages through the die [6].
2.1.3 Grain refinement by ECAP
Iwahashi et al. seem to be the first to make a detailed systematic research on the microstructural evolution during ECAP in 1997 [7]. Earlier reports had described the use of ECAP and the subsequent stability of the ultra fine grains produced in Al-Mg [14-17] and Al-Mg-Li-Zr alloys [18]. Iwahashi et al. conducted detailed experiments on pure (99.99%) aluminium in order to investigate the development end evolution of the ultra fine grains during ECAP for the routes A and C.
It was shown [7] that pure Al with an initial grain size of ~1.0 mm could obtain grain structures at the micrometer level (~4 μm) after a single pass through the die with an introduced effective strain of ~1.05. The microstructure after the first press consists of bands of elongated sub-grains. There is a rapid evolution with further pressings into an array of equiaxed grains.
The initial massive reduction in grain size is achieved in the first passage through the die because the original grains break up into bands of sub grains. These sub-boundaries subsequently evolve with further pressings into high angle grain boundaries, giving ultimately a reasonable equiaxed microstructure.
When samples of pure Al, with a coarse grain size, are cold rolled to reductions of ~15% to 30% ,the grains become divided into bands of elongated sub grains and the average size of these sub grains is typically of the order of ~1 - 2 μm [19-21]. These sub grain bands appear to be the precursor of the well-defined and regular band structure, which is visible also in ECA pressed samples, after a single passage through the die to a strain of ~1.05 (Figure 2.7).
Figure 2.7: Grain structure after 1 pass [5] (X, Y and Z denote the plane normals, coordinate system is the same as in Figure 2.3).
In order to understand the nature of grain refinement at the high strains associated with ECA pressing, and in particular the influence of the processing route, it is necessary to examine the shearing patterns which develop within each sample during repetitive passages through the die.
These patterns are illustrated schematically, in the form of the dominant directions of shearing, for routes A, B and C in Figure 2.8. It is apparent from Figure 2.8 that the shearing patterns are significantly different between the three separate routes.
In route Bc, where the sub grain boundaries evolve most rapidly into high angle grain boundaries, the two shearing directions lie on planes which intersect at 120q. As a result of this duality in the shearing directions, sub grain bands are developed on repetitive pressings along two separate and intersecting sets of planes (Figure 2.9) and this leads rapidly to an evolution in the boundary structure into a reasonably equiaxed array of high angle boundaries. Thus, it is reasonable to conclude that route BC is the preferable
plane. It is demonstrated in Figure 2.10, and also confirmed in an earlier investigation [7], that route C is preferable to route A in developing an array of high angle boundaries. Although the reason for this observation has not been established in detail, it probably arises because route C permits the shear to build continuously on a single set of planes whereas in route A the extent of shearing is divided equally between two sets of orthogonal planes.
Figure 2.8: Shearing patterns associated with ECA pressing through routes A, B and C, respectively [5].
Figure 2.10: Spot spreading from selected area electron diffraction (SAED) patterns describing the angle of misorientation between the grains. Route B has the most equiaxed grain structure [5].
2.1.4 Estimation of the strain in ECA Pressing
The shear strain Ȗ for simple shear is defined as in Figure 2.11b), Ȗ = a/h. Simple shear involves a shape change produced by displacement along a single set of parallel planes. The shear strain introduced by the ECA pressing will first be derived for the case of simple shear, assuming a square cut die and neglecting the friction effects.
Figure 2.11a) shows a cubic element abcd along the centreline in the ECAP die. The die is defined by the angles ĭ and Ȍ. If we follow the element through the die, we will end up with the orthogonal element a’b’c’d’, deformed by shear during the passage through the die. Following the notation in Figure 2.11, it follows that the shear strain, Ȗ, is given by
ad ad ad ec ad ad as rc u d u a ¸¹ · ¨ © § ¸ ¹ · ¨ © § ¸ ¹ · ¨ © §
cos 2 2 cot 2 2 cot 2 2
' ' ' \ I \ I \ I \ J Equation 2.1 which is reduced to ¸ ¹ · ¨ © § ¸ ¹ · ¨ © § 2 2 cot 2 2 2 cos I \ I \ \ J ec Equation 2.2
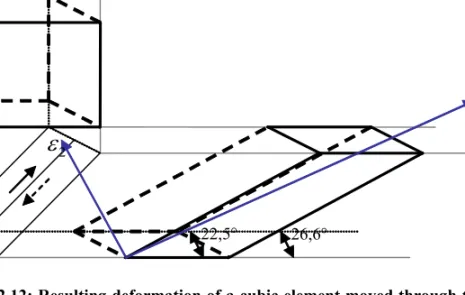
The resulting deformation with the directions of the principal strains is shown in Figure 2.12. a) Y h a ș X b) Figure 2.11: Schematic drawings of a deforming element moving through the ECAP die
1
H
22,5° 26,6°
2
H
Figure 2.12: Resulting deformation of a cubic element moved through the ECAP die.
İ1 and İ2 are the directions of the principal strains.
2.1.5 Mechanical properties at room temperature
The mechanical properties of ECAP processed aluminium alloys normally show a significant increase in yield strength and ultimate tensile strength while the tensile ductility at room temperature is decreased after the first pass and stays relatively unchanged by increasing number of passes.
Numerous works have been published on the mechanical properties of aluminium alloys after ECAP. Non-heat treatable alloys such as the Al-Mg [22-34], Al-Mn [35], and Al-Mn-Mg [36] alloys have shown improvements in strength and some also in ductility after ECAP.
Heat treatable alloys such as Zr [37], Al-Mg-Si [38-41], Al-Cu-Mg-Mn [42], Al-Mn-Si [43],Al-Zn-Mg [35, 44-46], Al-Li [18, 47-49] and Al-Mg-Sc [50-52] have been reported to achieve positive developments after ECAP. A majority of these studies show that tensile ductility is decreased after multiple ECAP presses, and flow stress is generally
There are several parameters determining the mechanical properties of ECA processed aluminium. Except from the alloy composition, the processing conditions are vital. Recent experiments on 6xxx alloys show that the initial material temper is the most important, following the number of ECAP passes, the pressing temperature and post ECAP heat treatment.
Heat treatable alloys, such as the 6082 treated in this thesis, can yield a significant increase in strength and ductility compared to conventional T6 heat treatment by using the proper processing parameters. The highest strength is reached by ECA processing directly from solid solution heat treatment at sub-ambient or cryogenic temperatures followed by post ECAP heat treatment at low temperatures, typically 80-120°C [38, 42]. The low temperature ECA pressing hinders or slows down deformation induced precipitation, thus keeping as much alloying elements in solid solution as possible. A low temperature post ECAP heat treatment will then lead to a combined effect of releasing residual stresses, which increases the ductility and slightly lowering the strength, and secondly, precipitation strengthening. A low heat treatment temperature is vital, as the precipitation kinetics is highly accelerated in the highly deformed material. At conventional heat treatment temperatures the deformed structure is unstable and recrystallization may occur before the precipitates starts to pin the structure. As an example, the 6082 alloy has typical UTS of ~340MPa and elongation to failure of about 11% in the T6 condition. After ECAP and low temperature heat treatment, this alloy reaches ~460MPa and ~16% elongation simultaneously.
2.1.6 High Strain Rate Superplasticity
High strain rate superplasticity (HSR SP) is defined as the ability to achieve high superplastic tensile elongations at strain rates faster than 10-2s-1 [53]. It is now well established that the high tensile ductility associated with
superplastic flow occur at intermediate strain rates of the order of ~10-4 – 10-3 s-1,in materials having small grain sizes lying typically in the range of
~2 – 10μm. In practice, these rates are so slow that superplastic forming operations will normally take up to 30 minutes, i.e. too slow for any high volume – low cost applications.
Langdon et al. have shown that since the strain rate in superplastic forming is inversely proportional to the square of the grain size, a decrease in grain size displaces the superplastic regime to faster strain rates [54]. The ECAP technology can produce grain sizes in the sub-micrometer range, thus, it should be feasible to use ECAP in order to fabricate materials which are capable of exhibiting superplasticity at high strain rates. It has been demonstrated by several recent reports [55-60] that high superplastic ductility can be achieved at strain rates >10-2s-1 in a range of aluminium based alloys processed by ECAP.
It has been shown that the choice of processing routes used during the ECA pressing is vital to the superplastic behaviour of the material [53, 56, 61-64], i.e. see Figure 2.13 and Figure 2.14 for a comparison of routes A, Bc and C. ECAP initially introduces an array of closely-spaced sub-grain bands, but this structure evolves with further straining into an array of ultra-fine equiaxed grains separated by boundaries having high angles of missorientation [5, 7]. The precise nature of the microstructure produced by ECAP is dependent upon the processing route. It has been suggested by several authors that processing route BC with ĭ = 90q is the most efficient in
producing superplastic alloys [53, 65, 66].
Reports show that superplasticity has been obtained in several commercial alloys such as Al-Cu-Zr (AA2004) and Al-Mg-Li-Zr cast alloys [55], Al-Mg-Sc [56] and an Al-3Fe (AA2024) powder alloy. Komura et al. obtained an elongation of 2280% at 400qC with a strain rate of 10-2 for an
grain size was reduced from ~200μm to 0.2μm after 8 passes, i.e. a total strain equal to 8.
Figure 2.13: Superplasticity: True stress vs. elongation for samples pressed using routes A, BC and C [53].
Figure 2.14: Superplasticity: True stress versus elongation for samples after ECAP using route BC for one to 12 passes [53].
The characteristics of the microstructure introduced by ECAP play an important role in determining the magnitude of the post processed elongations. High superplastic elongations are achieved through ECAP only
when the microstructure has evolved from the banded sub-grain structure introduced initially in ECAP at low strains to a homogenous array of uniform and equiaxed grains separated by high angle grain boundaries at high strains. These high angle grain boundaries are a prerequisite for superplasticity because flow occurs predominantly by grain boundary sliding.
2.1.7 Textures by ECAP
Much work has been made to understand the texture development in ECAP’ed materials, with the main emphasis on texture modelling. Maybe the most important experimental work is that of Tóth et al. [67] in identifying the stable texture components.
Published work on the textures generated during ECAP of Al and Cu have noted the presence of {100}<110> and {112}<110> components on the partial E-fibre. However, although the texture ideally is symmetric in the mirror plane of the die, the positions of maximum intensity have been reported to be rotated away from the “extrusion direction” by 10-20°, often referred to as the “tilts” of texture components from their ideal positions known in simple shear.
There have been several different explanations and disagreements on how the texture develops in regard to alignment to the shear zone and re-alignment of the texture components between successive ECAP passes.
There have however, to the present authors knowledge, not been made any detailed texture measurements through the deformation zone in order to continuously follow the texture development, and no serious attempts have been made to explain how the various texture components generates in the microstructure.
and were applied to predict the texture evolution in ECAP with the Taylor polycrystal model in a 90°, sharp cornered die. The self-consistent (SC) model of polycrystal viscoplasticity has also been used to predict texture evolution in iron [68] with the discontinuous shear approach (shear occurs at the intersection of the ECAP channels, not gradually through a zone). More recently, the Taylor polycrystal plasticity model was incorporated into finite element calculations to predict the textures and hardening of aluminium [69]. Gholinia et al. [70] have studied the flow field experimentally and then used the Taylor polycrystal model to predict the texture evolution in an Al alloy. They have identified the “tilts” of texture components from their ideal positions known in simple shear. Beyerlein et al. [71] used the viscoplastic self-consistent polycrystal code in its full anisotropic formulation together with the discontinuous shear approach to predict the texture evolution in copper. They examined the effect of grain shape changes on texture evolution resulting from grain subdivision during ECAP. Tóth et al. [67] used a new flow field which uses an analytical flow function to significantly improve the accuracy of the texture predictions in copper.
The most important works on ECAP textures can be found in [67, 69-88].
2.2 Aluminium alloys and deformation mechanisms
2.2.1 Non-heat treatable aluminium alloys
Non-heat treatable aluminium alloys constitute a class of alloys that owe their strength mainly to elements in solid solution, but also to some types of particles. A heat-treatment of such an alloy will generally not produce any strengthening precipitates as in the heat treatable alloys (an exception is the dispersoids formed in Al-Mn alloys). The strength may in fact decrease during heat treatment due to the removal of solute atoms. The alloy systems belonging to this class are the AA1xxx system (commercially pure with small amounts of mainly Fe and Si), the AA3xxx system (as AA1xxx with manganese and magnesium additions), the AA5xxx system (as AA1xxx with magnesium addition) and the AA8xxx system (as AA1xxx, but with higher alloy additions).
The strength of these alloys depends strongly on the content of alloying elements. In Figure 2.15 the ultimate tensile strength of a number of commercial non-heat treatable alloys are shown as a function of the amount of alloying elements. An interesting observation is that the tensile strength is approximately linearly dependent on the total alloying addition in wt%, irrespective of element type, and follows the simple equation given in Figure 2.15. It is here distinguished between the O-temper, i.e. annealed condition, and the H18/H38 condition, i.e. cold rolled or cold rolled and stabilized of the same alloys. These curves indicate a large work hardening potential in these alloys. The dotted and the full lines illustrate the difference between the alloys where solution hardening is most important (AA5xxx) and where the particle hardening dominates (AA1xxx, AA8xxx). In the AA3xxx alloys the strength results from both Mn and Mg in solid solution and particles/dispersoids.
Figure 2.15: Ultimate tensile strength as a function of alloying additions for a wide range of commercial non-heat treatable aluminium alloys. Both O-temper and cold rolled conditions of the same alloys are plotted [89].
2.2.2 Heat-treatable aluminium alloys
The heat-treatable aluminium alloys get their strength mainly from precipitate particles, and collect the AA2xxx, AA6xxx and AA7xxx alloy systems. These alloys are first solution heat-treated, i.e. heated to the single-phase area of the single-phase diagram where alloying elements are more or less dissolved into solid solution. A rapid quench freezes the atoms in a supersaturated solid solution (ssss) from where the precipitation sequence starts. Here is an example from AA6xxx alloy showing the phase transformation sequence in this alloy:
Precipitation can occur at room temperature (natural ageing), but an artificial ageing treatment is normally used in order to achieve a more stabilized material with as high a strength as possible. Following the sequence from the left to the right, the size of the microstructural feature increases, and the coherency between the matrix and the precipitate is gradually lost. The maximum strength generally occurs when there is a mixture of coherent and semi-coherent precipitates. Overageing produces stable incoherent particles, giving a lower strengthening effect (e.g. so-called Orowan hardening).
2.2.3 Deformation structures
The large plastic deformation that a piece of aluminium is exposed to during rolling or extrusion has great impacts on the microstructure and the crystallographic texture of the material. These changes will influence its mechanical properties, in terms of e.g. strength and anisotropy, and its behaviour during subsequent annealing. In this section a brief overview is given on the current general knowledge of deformation structure and texture. It is important to notice, however, that because of the large number of different microstructural features developing during deformation, a unified and complete description of deformation structures has appeared to be difficult to obtain. In many cases the description and interpretation of observed features is a question of definition by the experimentalist.
2.2.3.1 Dislocation slip and stored energy
The generation and migration of dislocations and dislocation loops, and the subsequent interaction, storage and recovery of the dislocations are the fundamentals of the evolution of the deformation structure (see e.g. [90, 91]). Aluminium has relatively high stacking-fault energy (Ȗsfe) which
aluminium alloys it is a common assumption that all slip occur on the {111}<110> slip systems and that dislocation climb is limited. At higher temperatures however, the existence of non-octahedral slip on the {100}, {110} and {112}-planes is observed [92]. As the slip systems intersect, the mobile dislocations will interact with each other, as well as with obstacles like solute atoms and particles. When the dislocations are stored in the material, they will lead to an increase in the total stored energy:
* {U
E Equation 2.3
where ȡ is the dislocation density [m-2] and ī is the line tension of dislocations [N] which is estimated to
2 2 Gb | * Equation 2.4
where G is the shear modulus [Pa] and b is the Burgers vector [m]. The system will, as any other system, try to minimize its energy. For the case of aluminium this can be achieved either by organizing the dislocations into low-energy configurations, or through dynamic recovery processes where dislocations annihilate each other.
An important aspect is that cold deformation of metals normally is considered to be limited to the temperature regime of <0.1Tm, which for aluminium is below 70°C. For most practical applications, cold rolling is performed at room temperature, and due to the plastic work the temperature in the material will rise. So what is generally referred to as cold rolling
aluminium is associated with thermally activated processes, and a considerable amount of dynamic recovery involving both cross-slip and climb of dislocations is expected. This is particularly true for commercial cold rolling, where the temperature of the sheet may reach 100-150°C due to the strain rates being of the order 50-100s-1.
2.2.4 Grain refinement mechanisms
2.2.4.1 Grain refinement by subdivision
According to the general framework [93, 94], dislocation structures organize incidental dislocation boundaries (IDBs) and geometrical necessary boundaries (GNBs). When strain increases, GNBs evolve in a few steps: (I) reorganization into deformation bands (DBs), (II) decrease of spacing to a cell size, (III) rotation to a total flow direction and (IV) increase in missorientation angles (MOA) [95]. Simultaneous changes in microstructure and texture during such an evolution lead to material hardening or softening. Depending on the material and deformation mode, hardening may extend continuously to large strains while softening may interrupt that by localized flow at moderate strains.
If softening becomes predominant, continuous evolution is substituted by flow localization in shear bands (SBs). Shearbands are planar thin material layers accommodating strains which are significantly larger than in the surrounding areas. The average distance between bands approximates to the cell size outside the bands. Crystallographic multi-slip activity in SBs results in gradually increased MOAs along their boundaries. SBs have non-crystallographic orientations that always follow to continual principal shears and they may penetrate a few grains without noticeable deviation. Upon origination, SBs substitute pre-existing structures and define the final
During most deformation processes the original grains in a material will be extensively subdivided. New boundaries are introduced separating volume elements by a misorientation between their lattice orientations. A range of misorientations arises and the spacing of the boundaries is continuously decreased as deformation proceeds. An extensive study of the boundary spacing was provided by Gil Sevillano et al. [96]. They collected cell size data from a range of materials, normalized them to the cell size at
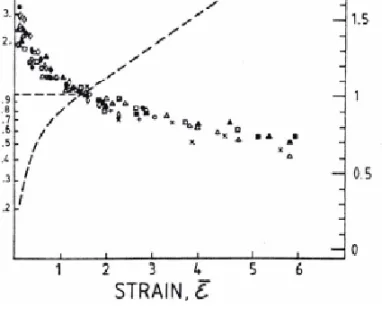
İ=1.5 and plotted them against the strain. Figure 2.16 shows that the evolution in cell size with strain is similar for all the investigated alloys, and that the size decreases continuously up to very large strains. Also plotted in the diagram is the inverse of the cell size, which shows a linear dependence on strain above İ=1. Also the boundary misorientation changes significantly during deformation and various authors have reported a range of misorientation results. A collection of reported misorientations are given in Figure 2.17, and suggests something between saturation at about 2-3° and a continuous development in aluminium alloys [97-99] [100-102].
Figure 2.16: Cell size,G normalized to cell size at İ=1.5 (GH=1.5) for a range of materials.
Broken lines shows 1/į vs. strain [96]
Figure 2.17: Evolution in sub-grain misorientation with strain reported by several authors for aluminium and aluminium alloys [103].
During recent years, a group at Risø National Laboratory has given a very detailed description of deformation structures, e.g. [93, 104-107]. These works are dealing with cold rolled pure aluminium and nickel (which in this context is very similar to aluminium in terms of crystal structure and stacking fault energy, and hence also deformation structure). An overview of some of their observations and considerations is given in the following. Their description starts with the assumption that within one grain the combination and number of simultaneously active slip systems vary from place to place. The number of active slip systems at each location is generally lower than the five predicted by the Taylor theory (see section 2.6.2), as this is energetically favourable. Thereby, the grain starts to subdivide into volume elements. Within one element the slip pattern is different from that in the neighbouring elements, but collectively they fulfil the Taylor assumption for strain accommodation.
The volume elements correspond to an experimentally observed feature denotedcell block (CB) which, as the name indicates, consists of a number of adjacent cells. The boundaries between neighbouring CBs arise out of geometrical necessity, as the selection of slip systems is different on either side of them. Hence, they are termed geometrically necessary boundaries (GNBs). Several types of GNBs are described, e.g. dense dislocation walls (DDWs), observed at small to moderate strains, and laminar boundaries (LBs), separating flat elongated CBs at large strains. Microbands (MBs) are plate-like zones bounded by dislocation sheets which tend to develop from the DDWs, and thereby separate CBs. Within the CBs there are cells separated by cell boundaries. These boundaries are formed through mutual trapping of mobile and stored dislocations, and thereby they are termed incidental dislocation boundaries (IDBs). A schematic illustration of the
cells, cell blocks, GNBs and MBs at a moderate strain level is given in Figure 2.18.
Figure 2.18: Schematic drawing of the early deformation structure in a cell-forming metal [108].
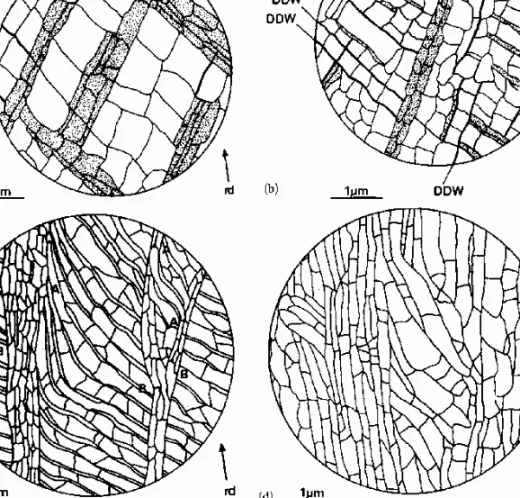
The grain subdivision starts during the early stages of deformation, and already after 10% cold rolling a well-developed cell block structure has evolved in favourably oriented grains [106]. At small to moderate strains (up to İ=0.7) most of the GNBs are DDWs and MBs. The majority of them are inclined to the rolling direction by an angle of approximately 40°. A schematically presentation of the substructure at 30% and 50% rolling reduction is shown in Figure 2.19 (a, b).
Figure 2.19: Schematic illustrations of the changes in microstructure during cold rolling. (a) 30% (İ=0.36), (b) 50% (İ=0.69), (c) 70% (İ=1.2), (d) 90% (İ=2.3). In (a) and (b) the DDWs are drawn as thick lines and subgrains in MBs are dotted. [105]
At higher rolling reductions (İ>0.7) layers of elongated cells or sub-grains are formed. The sub-sub-grains are grouped in bands of a lamellar structure nearly parallel to the rolling direction. A lamella is essentially a cell block with only one sub-grain between its boundaries. The GNBs of this structure therefore appear as lamellar boundaries (LBs); see Figure 2.19(c, d).
The spacing of both GNBs and IDBs decrease with increasing deformation. Obviously the GNB spacing is larger than the IDB spacing, but the difference diminishes at large strains as the cell blocks finally contain only one cell across its width. This is shown in Figure 2.20 for small to moderate strains in aluminium, and in Figure 2.21 for a wide strain range in nickel. Also the variation in the misorientation across GNBs and IDBs with strain is shown in Figure 2.21. The GNB misorientation is higher and increases more rapidly with strain as compared to the IDBs. While the IDB misorientation increases slowly to about 3° at large strains, the GNB misorientation increases up to 15-20°. Eventually, the GNBs turn into high-angle boundaries (>15°), and no saturation in the misorientation is observed for these boundaries at a strain of 4.5.
Figure 2.21: Observed boundary spacing (D) and misorientation (ș) as a function of rolling strain in pure nickel. (a) Geometrically necessary boundaries, (b) incidental dislocation boundaries. [107]
2.2.5 Alloying effects on subdivision
2.2.5.1 Solute atoms
Not all materials build up a well-defined cell structure as described in section 2.2.4. By introducing a considerable amount of solute atoms to an alloy, the friction stress is increased and the dislocation mobility reduced due to solute-dislocation interactions. This causes large constraints on the dislocation rearrangement, which is essential in the creation of cell boundaries. Instead, a different dislocation structure evolves, known as a Taylor lattice (e.g. [108]). A Taylor lattice consists of uniform arrays of edge dislocations along the primary slip planes. It is characterized by a nearly uniform distribution of dislocations, multiple Burgers vectors of dislocations within the array and the dislocations are organized along {111}-planes. So, instead of clustering the dislocations to minimize their energy such as in cell walls, they organize into arrays of alternating sign, a process that also lowers their energy. The Taylor lattice is an incidental dislocation structure, i.e. the dislocations are trapped incidentally, or
statistically. On a larger scale, geometrically necessary boundaries (GNB’s) are created in order to account for the variations in selection of slip system between neighbouring volumes. This is analogous to the DDWs appearing in cell-forming metals described in the previous section. However, in non-cell forming alloys they appear as domain boundaries (DBs). The difference between domain boundaries and DDWs is that domain boundaries are parallel to the {111} slip planes whereas DDW’s tend not to be crystallographic in nature. Microbands also appear frequently in non-cell forming alloys [109]. These microstructural features are illustrated schematically in Figure 2.22. Note the difference between this subdivision pattern and the one in cell-forming metals in Figure 2.18.
Figure 2.22: Illustration of the grain subdivision in a non-cell forming alloy. TL: Taylor lattice, DB: domain boundary, MB: microband. [108]
2.2.5.2 Non-deformable particles
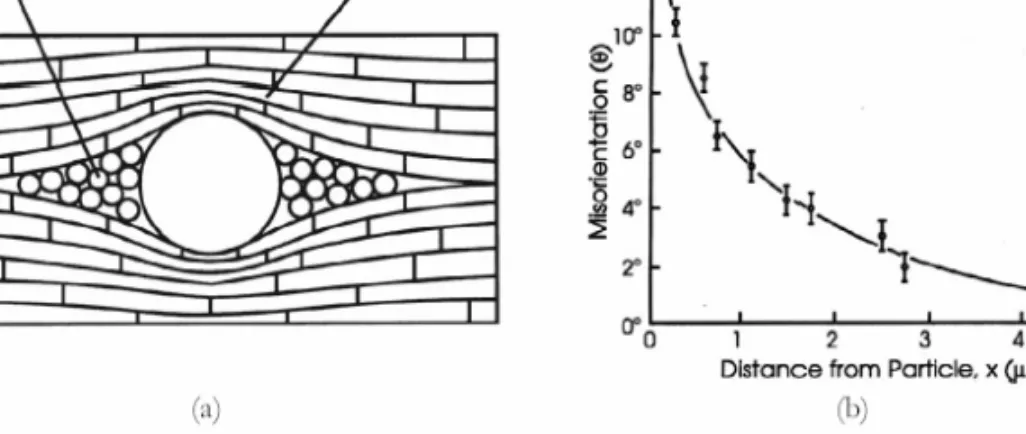
geometrical effect, an arrangement of geometrically necessary dislocations has to be introduced [110]. This results in the occurrence of deformation zones around the particles, as illustrated by Figure 2.23(a). The deformation zones consist of small subgrains that build up an orientation gradient between the particle surface and the matrix, see Figure 2.23(b). It is found that the misorientation increases with both strain and particle radius [91]. Additionally, the presence of second phase particles is observed to increase the overall dislocation density and to reduce the average subgrain size.
Figure 2.23: (a) Sketch of a deformation zone around a particle in a rolled polycrystal. (b) Lattice misorientations as a function of distance from the particle as observed in [91].
2.2.5.3 Dislocation density in the grain interior
As mentioned earlier, dislocation loops are generated and expanded during deformation. A large number of these dislocations are used to build up sub-boundaries, but some of them will be stored as a 3-D network in the subgrain interior instead. Even an annealed metal will contain a considerable amount of dislocations, typically 1010-1012 m-2 [90], but the density increases rapidly, and a severely cold worked material may have an overall dislocation density of up to 1016 m-2. It was observed by
Nord-Varhaug et al. [111] that the density of dislocations inside the subgrains saturated in the early stage of deformation. Figure 2.24 shows a constant dislocation density of around 1014m-2 in the strain range of İ=0.03-2 for two commercial aluminium alloys. The density was somewhat higher in the AA3207 alloy, containing 0.4 wt% Mn, than in the more pure AA1050. This is consistent with the observations in the classical work of Langford and Cohen [112], where iron was wire-drawn to very large strain. They concluded that most of the dislocations were confined to cell walls and that the density within the cells was comparatively low.
Figure 2.24: Density of dislocations inside the cells / subgrains of the commercial alloys AA1050 and AA3207, covering a strain range up to a strain of 2 [111].
2.2.6 Band formation in plastic deformation
Bands of different types are very common in plastic deformation-in fact in all types of material, independent of crystal dislocation behaviour. Basically, they are due to the fact that, without diffusional processes, solids can locally deform only through shearing in a fixed direction on planar or prismatic planes, and that the intersection of deformation zones with different slip directions requires an increased stress. The different kinds of
accepted names and they are basically other features than what the Risø-group has put their names to (GNB’s, DDW’s, DB’s etc.)
2.2.6.1 Bands of secondary glide
Bands of secondary glide, observed mostly in later stage I, are zones with strongly decreased primary glide activity in which secondary or “unpredicted” glide is concentrated. They are slightly inclined against the primary glide plane [113-115], and are accentuated near orientations of multiple glide [116]. According to [115] they are localizations compensatory coplanar (on the primary slip plane) glide due to the deviation of the primary Burgers vector direction from the direction of maximum shear stress.
2.2.6.2 Kink bands
These bands are generally normal to both the operative slip plane and to the slip direction. Further, the lattice in the bands is rotated with respect to the rest of the crystal about an axis lying in the slip plane and perpendicular to the slip direction. The kink bands may form when the crystal is loaded in compression, and deforms by a localized region of the crystal suddenly snapping into a tilted position with a sudden shortening of the crystal. The kinking behaviour is illustrated in Figure 2.25.
Figure 2.25: Schematic figure of a kinked crystal experiencing the critical compression stress for kinking, Vc, resulting in a kink band of width l, tilted an angle E
2.2.6.3 Stria bands
The typical appearance of stria bands is that they are slightly inclined to primary slip lines. However, in the regions of stria, the primary slip system is poorly developed or completely absent, while slip lines from other (secondary) systems can be present. The explanation of stria formation from [117] is that the grains developing stria are stiffer than the neighbouring grains. The constrained condition within such a grain is overcome by the formation of separated bands with primary and multiple slip, i.e. primary slip and stria bands respectively.
2.2.6.4 Regular deformation bands
Regular deformation bands are typical slab-like parallel sequences of volume elements with alternating average lattice orientation, which are caused by the local simultaneous operation of fewer slip systems than would be required for homologous deformation. Regular deformation bands are subdivided into dislocation cells and apparently by twins in planar glide. In either case, they terminate at grain boundaries.
The free energy change due to deformation bands consists of: (I) the reduced elastic strain energy through a lowered flow stress on account of a decreased number of simultaneously acting slip systems; (II) the deformation band energy; and (III) the strain energy of internal stresses, i.e. the specifically misfit stresses caused by opposite deviations from homologous strain in neighbouring deformation bands.
According to an overview by Kuhlmann-Wilsdorf [118], the deformation bands can be explained by the LEDS theory “beyond reasonable doubt”.
- LEDS hypothesis: “Among all microstructures that are in equilibrium with the applied stresses and are in principal accessible to dislocations, those are formed which minimize the energy of the system composed of the deforming material and the applied tractions”.
Orientation splitting in FCC metals by deformation banding has been studied in detail by Akef and Driver 1991 [119], Maurice and Driver 1992 [120], Basson and Driver 2000 [121], Paul, Driver and Jasienski 2002 [122] and Paul, Driver, Maurice and Jasienski 2003 [123]. Their focus has been on explaining the orientation splitting of cube-oriented FCC crystals in plane strain compression. The main findings are:
x Plane strain compression of (001)[010] and (001)[110] aluminium single crystals leads to the development of deformation bands by lattice rotations of opposite sign about the transverse axis [100]. The decomposition process is preceded by a stage of relatively homogeneous deformation up to a critical strain İc§0.2-0.3.
x The (001)[110] orientation separates into two stable, complementary copper {112}<111> type texture components after a strain of 1.2. The (001)[010] orientation develops two complementary {049}<094> after similar strains; these texture components are unstable and probably decomposes further at higher strains into four S-type texture components.
x The decomposition process can in certain cases be related to the type of dislocation interactions; within a given band the number of active slip systems is reduced either to one or two which interact weakly. x At temperatures less than 300°C the cube orientation splits up into
deformation bands separated by cube oriented transition bands (see below).
x At temperatures above 300°C the cube orientation is stable, and slip takes place on the {110}<1-10> systems.
x The (001)[110] orientation deforms by octahedral slip and breaks up into deformation bands with two symmetric {112}<11-1> type orientations.
2.2.6.5 Transition bands
In transition bands the lattice orientation changes gradually, i.e. they exhibit systematic strain gradient(s) on at least one slip system across a width significantly larger than the diameter of the participating dislocation cells.
2.2.6.6 Hybrid / regular transition bands
Hybrid / regular transition bands are like regular deformation bands in one direction and transition bands in another.
2.2.6.7 Shear bands
Shear bands are narrow regions of intense shear and are a kind of plastic instability. They appear in materials subjected to heavy deformation, such as cold rolling. The bands are non-crystallographic, and in a rolled sheet they are normally aligned about ±35° to the rolling direction and parallel to the transverse direction. Often they intersect several grains and may cross a whole plate leading to failure.
Shear bands have been observed in high-purity aluminium rolled at room temperature. But it is upon the addition of magnesium that shear banding really becomes frequent. The mechanisms involved in shear banding are not fully understood, but Dillamore et al. (1979) [124] analyzed the phenomenon in terms of a plastic instability. In plane strain compression, or rolling, the condition for this instability is written as:
0 1 1 H U U H H H H V V d d m d dM M m n m n d d Equation 2.5
where n and m are the strain hardening and strain rate exponents, U is the dislocation density and M is the Taylor factor. It follows that instability is favoured by negative strain rate sensitivity (m), which is the case in AlMg alloys, and a negative dM/dİ. The latter term corresponds to geometric softening, i.e. that instability is favoured if it causes a lattice rotation into a softer orientation. A more recent contribution to the knowledge of shear banding has been provided by Inagaki and Kohara (1997) [125]. They studied the shear banding in polycrystalline binary AlMg alloys with 0.5-5% Mg, given cold rolling reductions up to 90.5-5%. The shear band density increased with both Mg-content and strain, and a critical concentration between 2 and 3% Mg was experienced, above which shear bands formed readily. The suggested mechanism is that stress concentrations and misfit strains arise at the grain boundaries, and thereby lead to the formation of offsets on the boundaries, see Figure 2.26(a). It was observed that shear bands grew out of these offsets, and hence the grain boundaries served as nucleation sites for the bands (Figure 2.26(b)). This effect is enhanced by the presence of Mg-atoms, as they suppress the dislocation movement and give an even more inhomogeneous deformation. However, the orientation difference between the grains on each side of the boundary influences the misfit strain and plays an important role in the formation of offsets. Therefore, not all boundaries are able to nucleate shear bands.
Figure 2.26: (a) Formation of offsets on a grain boundary in AlMg5 cold rolled to 50%. (b) Shear bands crossing a grain boundary after cold rolling to 70%. [125]
The mechanism described above applies only to alloys with more than 2.5% Mg. The low-Mg alloys, on the other hand, did not form any offsets on the grain boundaries. Instead, shear bands were formed by necking of elongated grains. After large rolling reductions the internal stress state varies considerably along the length of a grain, leading to subdivision of the grain and diffuse and localized necking. This mechanism depends on the thickness of the grains, with necking occurring easily in thin grains. It is suggested by Inagaki et al. (2002) [126] that shear banding may be one of the methods to accommodate strain in hard oriented grains. Material softening has also been related to shear banding [127]. Geometrical softening, caused by non-uniform lattice reorientation, influences the localization process, as channels of softened material and concentrated strain are formed. The shear banding is also associated with negative strain rate sensitivity, caused by solute-dislocation interactions which hinder the dislocation mobility.
Lloyd (1986) [128] observed a lesser extent of shear banding at low temperatures (77K) and high temperatures (473K) than at room temperature
corresponding to the dynamic strain ageing regime, shear banding was extensive.
2.2.7 Deformation banding in relation to the LEDS theory
For the formation of a deformation band to be energetically favourable, the reduction of elastic strain energy due to a reduction of simultaneously acting slip systems must be larger than the energy created in the DB boundaries and the excess elastic strain energy on account of accommodation stresses.In the framework of the LEDS theory, if a reduction of simultaneously acting slip systems reduces the flow stress from W toW
1GN, the corresponding energy density is>
@
2 1 2 1 N eB G U W G Equation 2.6for a reduction of the elastic strain energy of
>
@
G G G Ue N N N N 2 2 2 2 2 2 2 2 1 2 1 W W G G G W #G W Equation 2.7the last approximation being valid providedGN is less than, at most, 0.5.
The accommodation stresses are assumed to be concentrated at the end faces in a zone of lengthOaW . If so, a local stress increase in the band zones
to W
1Ga with typically,Ga |12 the excess elastic strain energy density on account of accommodation stresses is G L W G L W Ua a a a a a 2 2 2 2 2 2 2O G G W O G ¸W ¹ · ¨ © § # ¸ ¹ · ¨ © § Equation 2.8 eU is further counteracted by the boundary energy of the banding, i.e.
W L T W U DB DB B * | ¸ ¹ · ¨ © § * 1 1 1 Equation 2.9
assuming the same value of the specific surface energy, *DB, for all band boundaries. The necessary condition for deformation band formation then is
¿ ¾ ½ ¯ ® * ¸ ¹ · ¨ © § !| W G L W G DB DB DB N 2 2 W W G Equation 2.10
Here the variableWDB, signifying the local shear stress at the time of DB formation, is introduced in lieu of W because once formed, a deformation band appears to retain its length and width except for participating in the distortion of the material as a whole.
Once Equation 2.10 is fulfilled, the band morphology is found from
W
G
O
W
G
G
O
Equation 2.12Ua and UB are proportional and inversely proportional to W, respectively, so
that at energy minimum, Ua = UB and Equation 2.10 reduces to
G N D W L W 2 2 t !| G Equation 2.13
with DG the grain size. This explains why small grains exhibit thin
deformation bands and, since L is limited by the cell size, why small grains may not exhibit deformation banding at all.
All of the band boundaries will be, piecewise, dislocation rotation boundaries, being low energy dislocation boundaries (LEDS) with an average spacing among the dislocations of
Therefore, their local specific dislocation line energy is
¸¸¹ · ¨¨ © § ¿ ¾ ½ ¯ ® # M X S X 1 ln 1 4 2 1 2 Gb UD Equation 2.15since the upper cut-off radius of the individual dislocations’ stress fields is necessarily comparable to d. Here Poisson’s ratio appears to average over the participation of edge and screw dislocations.
For any particular value ofM, the geometrically necessary dislocation line length per unit area depends modestly on the type and geometrical arrangement of the dislocations in the boundary, but is always near1 d. This dislocation content is supplemented by redundant or “filler” dislocations due to tangling and imperfect mutual annihilation of ±dislocations arriving at the opposite sides of the wall. As a result the dislocation line length per unit wall area is Mr
>
2sinM 2@
b where the ratio of total to geometrically necessary dislocation content isMr. Furthermore, Poisson’s ratio never ranges far fromX 0.3. The specific energy of an isolated boundary of constant rotation angle M is ¸¸¹ · ¨¨ © § ¸ ¹ · ¨ © § # ¸¸ ¹ · ¨¨ © § ¸ ¹ · ¨ © § ¿ ¾ ½ ¯ ® # * M M M M X S X 1 ln 2 sin 1 . 0 1 ln 2 sin 1 4 2 1 Gb M Gb Mr r Equation 2.16Equation 2.15 and Equation 2.16 breaks down forM !1e
>
rad@
#21$, the maximum angle of*M . BeyondM 21$, Equation 2.16 is replaced byMrGb
0.035MrGb 21 1 ln 2 21 sin 1 4 2 1 21 ¸# ¹ · ¨ © § ¸¸ ¹ · ¨¨ © § ¿ ¾ ½ ¯ ® # * t $ $ $ X S X M Equation 2.17
BelowTM 2, the best present value isMr 2, which does not seem to depend much on strain or deformation temperature.
When Equation 2.16 and Equation 2.17 are only valid if MDB is much larger than the average misorientation angle MC of cell walls within the band volumes on either side. The effect of MC may be accounted for by a correction factor, F, for the specific surface energy of deformation band boundaries in the presence of dislocation cell walls. A typical value for Fis 0.7 when Mt21$ and
M
C |2$. The approximate relation between F, MandMC is shown in Figure 2.28 [118]. Equation 2.17 may be written, accounting for the cell walls, as:
Gb FMr
DB 0.035
*
The unknown parametersOaandGa regarding the accommodation energy may be evaluated numerically; Oamust compare to unity and Gais limited to ~0.4 by the level at which a previously latent system is triggered and thereby the strain propagated into the next band.
>
@
a a DB r a a a G W L b FM W O G G G O [ 2 0.035 2 2 2 2 | ¸¸ ¹ · ¨¨ © § ¸ ¹ · ¨ © § |Equation 2.19: Unknown parameters regarding the accommodation energy.
The calculated values for ȗ are listed in Table 7.6. A reasonable value for ȗ
is assumed to be ~0.8 [118].
Figure 2.28: Approximate value of F as a function of cell wall misorientation [118].
2.2.8 Theory of co-incidence site lattice boundaries
The theory of co-incidence site lattice (CSL) boundaries is important regarding low energy grain boundary configurations. Two grains which do not have the same orientation may still possess common lattice sites. If this is the case, the atoms occupying these sites constitute a new lattice, which is called the co-incidence site lattice. The ratio between the numbers of atoms per volume in the original lattice to t
![Figure 2.18: Schematic drawing of the early deformation structure in a cell-forming metal [108].](https://thumb-us.123doks.com/thumbv2/123dok_us/909657.2617274/42.892.264.628.263.574/figure-schematic-drawing-early-deformation-structure-forming-metal.webp)
![Figure 2.28: Approximate value of F as a function of cell wall misorientation [118].](https://thumb-us.123doks.com/thumbv2/123dok_us/909657.2617274/61.892.244.649.201.493/figure-approximate-value-f-function-cell-wall-misorientation.webp)