Bulky Averaged Microscopic Information for ECAP-Processed Cu
Using Accelerator-Based Gamma-Ray-Induced Positron
Annihilation Spectroscopy and Neutron Diffraction
Toshihiro Ishibashi
1,+1, Yo Tomota
1,+2, Satoshi Sugaya
1,+3, Hiroyuki Toyokawa
2,
Tetsuya Hirade
3, Zenji Horita
4,5and Hiroshi Suzuki
61Graduate School of Science and Engineering/Frontier Research Center for Applied Atomic Science,
Ibaraki University, Hitachi 316-8511, Japan
2National Institute of Advanced Industrial Science and Technology, Tsukuba 305-8568, Japan
3Nuclear Science and Engineering Directorate, Japan Atomic Energy Agency, Tokai, Ibaraki 319-1195, Japan
4WPI, International Institute for Carbon-Neutral Energy Research (WPI-12CNER), Kyushu University, Fukuoka 819-0395, Japan 5Department of Materials Science, Faculty of Engineering, Kyusyu University, Fukuoka 819-0395, Japan
6Quantum Beam Science Directorate, Japan Atomic Energy Agency, Tokai, Ibaraki 319-1195, Japan
Bulky averaged microstructural parameters such as vacancy density, texture and intergranular stress for 99.99%Cu subjected to equal-channel angular pressing (ECAP) were investigated using accelerator-based gamma-ray-induced positron annihilation spectroscopy (AIPAS) and neutron diffraction. The Doppler-broadening parameter S for the AIPAS positron annihilation peaks increased after thefirst ECAP cycle and then decreased slightly with additional ECAP cycles. When the samples were annealed, the S value for the sample subjected to eight ECAP cycles was found to decrease at a lower temperature than that for the sample subjected to one ECAP cycle. The texture and intergranular stresses generated by ECAP were determined by neutron diffraction analyses. Changes in full width at half maximum and intensity of the (111) and (200) neutron diffraction peaks monitoredin situduring annealing indicated the early onset of recrystallization in the sample subjected to eight ECAP cycles. These bulky averaged data show good agreement with both local scanning electron microscopy/electron backscatter diffraction observations and the results of mechanical tests. [doi:10.2320/matertrans.MH201310]
(Received March 1, 2013; Accepted May 20, 2013; Published July 5, 2013)
Keywords: equal-channel angular pressing, copper, accelerator-based gamma-ray-induced positron annihilation spectroscopy, neutron diffraction, electron back scatter diffraction
1. Introduction
Severe plastic deformation (SPD) has been used to produce ultrafine-grained materials.1,2) Equal-channel angular press-ing (ECAP) is a processpress-ing technique used to achieve SPD. It has been reported that the dislocation density initially increases to a saturation level and then decreases with repetition of ECAP cycles, whereas the grain size decreases to a plateau at the level of several nanometers.3)The texture evolution4) and supersaturated vacancy density5,6) have also been reported for materials subjected to SPD. Such character-izations of microstructures have been performed mainly by scanning electron microscopy/electron backscatter diffrac-tion (SEM/EBSD), transmission electron microscopy (TEM) and positron annihilation lifetime spectroscopy (PALS). The correlation of such microstructure observations with mechan-ical properties is sometimes difficult because of inhomoge-neities in the microstructures of SPD-processed materials. For example, texture determined by EBSD for a limited local area differs from location to location in a SPD-processed material. Hence, it is expected to measure the averaged data for a global volume, which is comparable with the size of the mechanical test specimen. In addition, the elucidation of the three-dimensional distribution of microstructural parameters within a sample is important.
Positron annihilation spectroscopy (PAS) is a powerful tool for the study of the behavior of vacancies; however, in most cases where PALS is used, the information is obtained from a thin film or surface layer. Recently, Selim et al.
developed a new technique called accelerator-based gamma-ray-induced positron annihilation spectroscopy (AIPAS), which can be used to probe the properties of bulk materials.79)Instead of injecting positrons from an external source into a sample, mega-electron volt gamma rays penetrate the material to a depth of tens of centimeters and generate positrons inside the material; the positrons annihilate with electrons in the material and simultaneously emit 511 keV gamma rays. In this study, we used AIPAS to investigate changes in the bulky averaged density of lattice defects upon annealing of ECAP-processed Cu by detecting the emitted gamma rays using a germanium detector.
Neutron diffraction was used in this study to characterize the microstructure and intergranular stresses of ECAP-processed Cu. It is known to be a powerful tool for the measurement of the stress (elastic strain) distribution inside a bulky product, which cannot be measured by other methods. It is also useful for determining a complete pole figure of a bulk sample without changing the measurement conditions (only rotating the sample).10,11) Here an angular dispersion (AD) method with a constant wavelength10)was used, which is considered to be better suited for obtaining reliable results compared to a time-of-flight (TOF) method with a spallation neutron source.11) The TOF method is attractive for time-slicing measurements in situ during heating because it involves the use of numerous detectors located at different +1Graduate Student, Ibaraki University. Present address: Nippon Steel &
Sumitomo Metal Co. Ltd., Kashima 314-0014, Japan
+2Corresponding author, E-mail: tomota@mx.ibaraki.ac.jp +3Graduate Student, Ibaraki University
Special Issue on Advanced Materials Science in Bulk Nanostructured Metals II
scattering angles;12)however, the resolution of the detectors differs depending on their location. We therefore chose to use these two methods complimentarily, i.e., AD for static measurements and TOF for dynamic measurements.
The final objective of our research was to correlate microscopic observations with global average measurements and then to quantitatively elucidate the relationship between the characteristic microstructures and mechanical properties of SPD-processed materials through suitable modeling. Global data obtained by AIPAS and neutron diffraction are presented in this paper.
2. Experimental Procedure
Round bars of 99.99%Cu (10 mm in diameter and 60-mm long) were annealed at 873 K for 3.6 ks and then subjected to ECAP using the route Bc at Kyushu University.1)Different samples were processed with different numbers of ECAP cycles (1, 2, 4 and 8 cycles); these samples are referred hereafter as 1P, 2P, 4P and 8P, respectively.
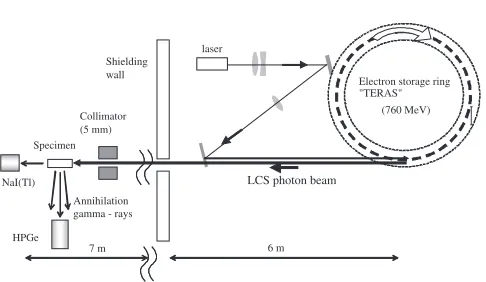
The AIPAS experiments were performed using the high-energy photon beam line of the electron storage ring “TERAS” at the National Institute of Advanced Industrial Science and Technology (AIST).13)One of the advantages of the present method is the low-radiation background during the measurement. The primary origin of the background radiation is the back-scattered laser compton scattering (LCS) X-rays, which originate from the specimen. Restricting the energy of the LCS X-rays to be less than the threshold energy for neutron production of the specimen is important because neutrons can contribute to the gamma-ray background. Therefore, the use of X-rays with an energy lower than the neutron threshold energy is important; these threshold levels for63Cu and65Cu are 10.9 and 9.9 MeV, respectively.14)Such a photon beam can be generated by laser compton scattering (LCS).15)The LCS photon beam is an energy-tunable source with an energy spread of a few percent; the energy is generated via the collision of laser photons with the energetic electrons produced by an electron accelerator. The energy of the LCS gamma-ray photon Eg is a function of the laser photon energyEL, electron energy£mc2and scattering angle ª, where£,mandcare the Lorentz factor, electron rest mass and speed of light, respectively. If head-on collisions of the laser photons and electrons are assumed, then Eg is represented as
Eg 4£
2E L 1þ ð£ªÞ2þ4£
EL=ðmc2Þ ð1Þ
Equation (1) shows that the gamma-ray energy depends on scattering angle ª. Therefore, monochromatic photons can be obtained when a collimator is placed downstream of the laserelectron interaction point to restrict the angular divergence. In this study, we tuned the electron energy to 760 MeV to produce a 10-MeV LCS gamma-ray beam using a 1064-nm Nd:YVO4pulsed laser. The experimental setup is shown in Fig. 1. The LCS gamma-ray beam was collimated to 5 mm in diameter and penetrated through a 30-mm-long sample cut from the ECAP-processed bar. Because the beam time was limited for the AIPS experiments, we had to select only typical specimens of 1P and 8P. The LCS photon
intensity and energy spectrum were measured with a NaI (Tl) scintillation spectrometer. The energy spectra of the positron annihilation gamma rays were recorded using a high-purity germanium detector (HPGe). From the obtained energy profile, the Doppler-broadening parameter, i.e., the lineshape parameter S,8) was determined. The samples were succes-sively annealed at temperatures varying from room temper-ature (RT) to 573 K for 3.6 ks to investigate the changes in the S parameter. The advantage of AIPAS is that deep regions within a sample can be investigated without any surface treatment. Here all AIPAS experiments were performed on the central part of the samples. If we use this technique for a complicated engineering part, we can examine the three-dimensional (3D) distribution of the S parameter.
Conventional PALS and SEM/EBSD tests were performed as a complementary experiment. The PALS experiments were performed on thin surface layers (<50 µm) of ECAP-processed samples using a 22Na source [2 kBq covered with two thin (approximately 7 µm) Kapton foil] at the Japan Atomic Energy Agency (JAEA). Two electropolished sur-face-treated samples were prepared, and the source was inserted between them. When a positron is produced from the 22Na source, a 1.27 MeV £-ray is emitted almost simulta-neously. Therefore, the signal detected by a fast scintillation detector for the 1.27 MeV £-ray can provide information about positron emission. Positrons injected into the samples annihilate with electrons in the samples, and two 511 keV annihilation £-rays are emitted. For the PALS experiments at JAEA, we detected both the annihilation£-rays to obtain information related to the annihilation of positrons in the samples using the digital PALS method.16) These PALS experiments had a time resolution of approximately 140 ps.
Neutron diffraction measurements were performed to determine lattice strain and texture for cubic 6.2©6.2© 6.2 mm3 samples prepared from ECAP-processed bars and annealed samples using the AD method with the engineering diffractometer RESA at JRR-3/JAEA. Using beam slits, the gauge volume was set to 3©3©3 mm3inside a sample (the gauge volume was completely embedded within a sample). To determine the orientation distribution function (ODF), we obtained complete pole figures for the (111), (200) and (220) reflections using an Euler cradle in 5° rotation steps for ¤- and»-axes from 0 to 90°.
Specimens of 1P and 8P were heated at several temper-atures and maintained at those tempertemper-atures for 900 s using
NaI(Tl)
Collimator (5 mm)
LCS photon beam
(760 MeV) laser
Electron storage ring "TERAS"
HPGe Specimen
7 m 6 m
Annihilation gamma - rays
Shielding wall
[image:2.595.307.550.60.201.2]a dilatometer. During the isothermal treatments, neutron diffraction profiles of either the (111) or (200) reflection were obtained for the last 600 s using a position-sensitive detector.
Field-emission-SEM/EBSD experiments were performed using Hitachi S4300E equipped with a TexSEM Laborato-ries, Inc. (TSL) orientation imaging microscopy system for samples polished with colloidal silica powder. Tension tests were conducted at RT for ECAP-processed samples using plate specimens with a gauge volume of 6©2©0.8 mm3at an initial strain rate of 1.4©10¹3s¹1. Vickers hardness tests were performed using an applied load of 0.98 N.
3. Results and Discussions
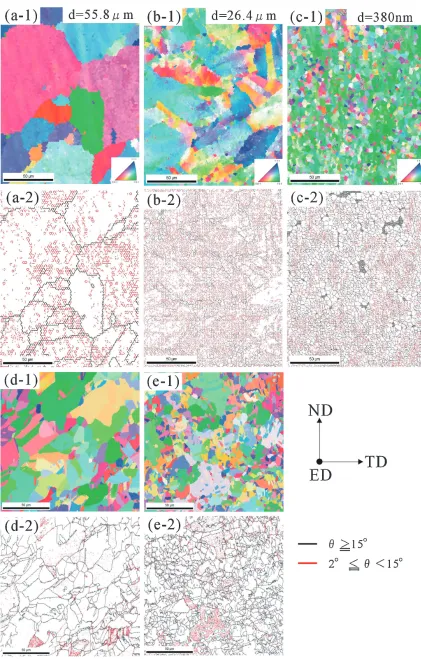
3.1 Effect of ECAP on strength and microstructure ECAP-processed specimens werefirst checked by conven-tional measurements. Figure 2 shows the microstructural changes observed by SEM/EBSD. As shown in the figure, the grain size decreased from 55.8 µm before ECAP to 26.4 µm for 1P and to 0.38 µm for 8P. The fraction of high-angle grain boundaries (>15°) increased with the number of ECAP cycles; 18% for 1P and 44% for 8P in the central region of the ECAP-processed bars. During ECAP deforma-tion, grain subdivision appeared to occur, which resulted in a finer grain size. However, the microstructure of 8P was still not uniform throughout the ECAP-processed bar and sub-grain boundaries remained, as shown in Fig. 2(c-2). Such heterogeneity in the microstructures was observed not only at the microscopic scale but also at the macroscopic scale, i.e., from the surface to the central part of the ECAP-processed bar. When the ECAP-processed sample was annealed, grain growth was observed. As examples, the microstructure annealed at 573 K for 3.6 ks for 1P and 8P are presented in Figs. 2(d-1) and 2(e-1), respectively. The image in Fig. 2(e-1), in particular, shows relatively large grains embedded in fine grains, indicating the occurrence of abnormal grain growth. The heterogeneity in the micro-structure of the ECAP-processed material is inferred to induce an early start of recrystallization. Molodova et al.
reported similar EBSD results and claimed that ECAP-processed materials show lower thermal stability, resulting in discontinuous recrystallization.17)In the case of SEM/EBSD, the influence of dislocations appears in the image quality (IQ) value or in the kernel-average misorientation (KAM) value. The trends of the changes in the IQ and KAM values obtained in this investigation were similar to those reported by Molodova et al.17) and strongly depended on the area observed in the sample. When the annealing temperature was increased, the KAM values determined from the EBSD results for samples annealed at 373, 473 and 573 K averaged 1.11, 1.083 and 0.717, respectively, for 1P and 1.424, 0.834 and 0.717, respectively, for 8P. According to the X-ray diffraction results,18)the dislocation density increases during the first few ECAP cycles and then decreases gradually as the number of ECAP cycles increases. The vacancy density and/or state of vacancies, i.e., monovacancies in the lattice, divacancies, clusters of vacancies, etc., must also affect recrystallization behavior. Cao et al. examined the stored energy, vacancies and thermal stability of ultra-fine-grained
copper using differential scanning calorimetry and attributed the higher stored energy and the lower activation energy compared to those of a cold-rolled sample to excess vacancies.5)With respect to texture evolution during ECAP, the present EBSD results are almost identical to those reported by Liet al.4)Notably, again, texture was observed to change from the surface to the central part and from the top to the bottom of the ECAP-processed bar when evaluated by EBSD over a limited observing area. The nominal stress strain curves of ECAP-processed samples are summarized in Fig. 3. As reported, the yield strength increased with the number of ECAP cycles, whereas work-hardening decreased, which resulted in little uniform elongation. Figure 4 shows the change in hardness after annealing for the 1P and 8P samples. From a macroscopic point of view, as the annealing temperature was increased, the hardness for 8P decreased rapidly at a lower temperature for 8P than that for 1P. Therefore, the observed hardness change was qualitatively similar to the changes in SEM/EBSD results, although the SEM/EBSD results changed from location to location at the micrometer scale. Additional bulky averaged data related to such microscopic factors may be required. Hence, the newly developed AIPAS method as well as neutron diffraction were used to obtain such information, as described in the following sections. These two quantum-beam techniques should provide globally averaged information inside a sample. These techniques would further be suitable for in situ
measurements during processing.
3.2 Positron annihilation behavior of ECAP-processed samples
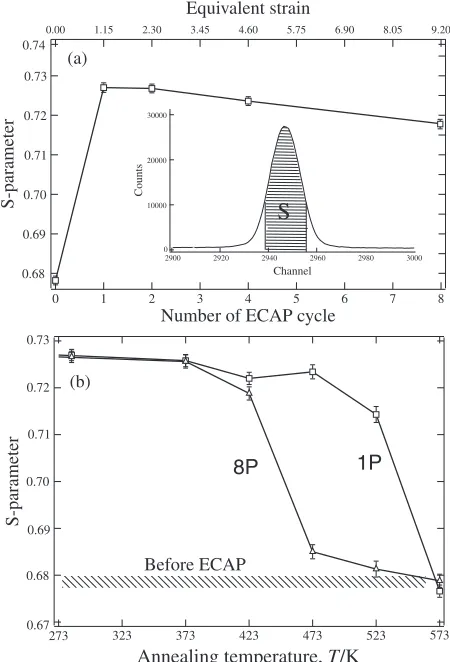
Figure 5 shows the results of AIPAS. The shaded area S in the profile shown in the inset of Fig. 5(a) is defined as the S parameter. It was calculated as the area of 18 channels (3.12 keV) at the center divided by that of 300 channels (52.04 keV). As shown in the figure, the S parameter increased for the first ECAP cycle and then gradually decreased as the number of ECAP cycles increased. This behavior is similar to the change in the full width at half maximum (FWHM) observed by neutron diffraction for cubic 5©5©5 mm3 samples. As shown in Fig. 5(b), the S parameter decreased as the annealing temperature was increased; it decreased back to its initial level after the sample was annealed at 573 K. Notably, the decrease in the S parameter for 8P occurred at a lower annealing temperature than that for 1P.
8P samples were 113.3, 179.6, 177.7, 175.9 and 174.1 ps, respectively. These results are quite similar to those reported by Ohkuboet al.and suggest that the main positron trapping site must be a monovacancy.20) The intensities for the 1P, 2P, 4P and 8P samples were 95.0, 95.6, 85.0 and 76.2%, respectively. These values indicate the positron trapping rate in the vacancies and are affected by positron diffusion; hence, a quantitative discussion of the vacancy density is difficult and is beyond the scope of this study. The results shown in Figs. 5 and 6 indicate that SPD using ECAP produces super-saturated vacancy concentrations.
The results obtained by AIPAS show good correlation with those obtained by PALS. To determine the bulk averaged quantitative data and/or 3D distribution, measurements of the positron lifetime with AIPAS would be required; such a measuring system is now under construction at AIST. Because the AIPAS can be performedin situduring material processing, it would become a powerful tool for micro-structure control.
3.3 Texture, lattice strain and FWHM measured by neutron diffraction
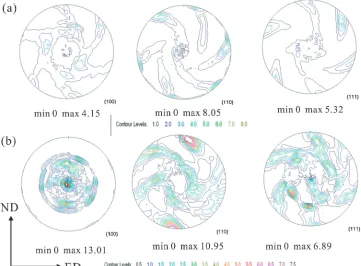
Figure 7 shows the pole figures for the (100), (110) and (111) reflections for the 1P and 8P samples determined by neutron diffraction with the AD method. In case of X-ray diffraction, the two pole figures obtained by back reflection
and transmission must be combined with some adjustments. Because of the high penetration power of a neutron beam, we obtained perfect pole figures by just rotating a sample without moving the position-sensitive detector. We found that the global texture is apparently not isotropic and changes with the number of ECAP cycles. Using these pole figures, we computed ODF; the results for samples 1P and 8P are presented in Fig. 8 and are quite similar to those reported by
Li et al.4) We believe the present results are more reliable
because Li et al. used the TOF method. This characteristic texture must induce anisotropy in the mechanical behavior. Haouaoui et al.prepared small tension test specimens from an ECAP-processed Cu bar along three orthogonal directions and reported that strength anisotropy including the direction-dependent Bauschinger effect was obviously present.21) Yapici et al. examined tensioncompression asymmetry in ECAP-processed Cu and compared their results with computation results based on a viscoplastic self-consistent model.22) They claimed that the anisotropy arises not only from crystallographic texture but also from directional substructure. In addition, we suspect that the intergranular residual stress would also influence such tension compres-sion asymmetry (strength difference) on the basis of the previous finding that the strength anisotropy is explained by the measured intergranular residual stresses in a drawn pearlite steel wire.23) After ECAP processing, the plastic strains in individual grains are inhomogeneous, as estimated 400 300 200 100 0 1.0 0.8 0.6 0.4 0.2 0.0 0P(annealed) 1P 2P 4P 8P Nominal strain Nominal stress, /MP a σ
Fig. 3 Nominal stressstrain curves of ECAP-processed samples measured atRT.
Annealing temperature, T/K
Hardness,
H
/Hv
Fig. 4 Variations in the hardness of the 1P and 8P samples as functions of annealing temperature.
Equivalent strain
(a)
(b)
Number of ECAP cycle
0.74 0.73 0.72 0.71 0.70 0.69 0.68 8 7 6 5 4 3 2 1 0 S-parameter S-parameter 9.20 8.05 6.90 5.75 4.60 3.45 2.30 1.15 0.00 Counts Channel 30000 20000 10000 0 3000 2980 2960 2940 2920 2900
S
8P 1P 0.73 0.72 0.71 0.70 0.69 0.68 0.67 573 523 473 423 373 323 273 Before ECAPAnnealing temperature, T/K
[image:5.595.62.277.71.227.2] [image:5.595.315.540.72.403.2] [image:5.595.62.278.277.423.2]from SEM/EBSD observations. Such misfit strains between adjacent grains accompany the intergranular stresses, which can be determined using neutron diffraction. Taking the diffraction peak position obtained from the sample before ECAP processing as a stress-free lattice spacing, the lattice (elastic) strain ¾hkl related to the intergranular stresses is determined as follows:
¾hkl¼dhkld0hkl
d0hkl ¼
cotª0ª ð2Þ
wheredhkl0 ,dhkl,ª0, and¦ªrefer to the lattice spacing before ECAP, that after ECAP, the relevant Bragg angles before ECAP, and the shift in the diffraction peak after ECAP, respectively. The residual lattice strains determined from the (111), (200) and (220) diffraction profiles obtained in the
Fig. 8 Orientation distribution maps of samples 1P and 8P measured by neutron diffraction.
Counts
Time, t/ns
0P 1P 2P 4P 8P
10
100
10
101
10
102
10
103
10
104
10
105
2.0 2.0
1.5 1.5 1.0
1.0 0.5
0.5 0.0
0.0 -0.5
-0.5
Fig. 6 Positron lifetime decays in the 0P, 1P, 2P, 4P, and 8P samples.
[image:6.595.65.276.69.233.2] [image:6.595.118.479.274.540.2] [image:6.595.120.470.581.771.2]ECAP-processed (longitudinal) direction are presented in Fig. 9. The lattice strain increased after the first cycle and slightly decreased at the eighth cycle. We found the strain of h100i-oriented grains is tensile, whereas that ofh111i -orient-ed grains is compressive. These are caus-orient-ed by whether hhkli-oriented grains family deform preferentially or not, i.e., the tensile residual strain in the h100i-oriented grains indicates that these grains start to deform plastically at a later stage due to their low elastic modulus and low Schmid factor for slip systems. These residual lattice strains, i.e., intergranular stresses, are believed to induce anisotropy in strength.
When the ECAP-processed samples are annealed, the hardness and S parameter for 8P decrease at a lower temperature than that for 1P, as described above. Here,
in situ neutron diffraction during annealing was performed.
The drastic change in diffraction intensity corresponds to the onset of recrystallization (or grain growth) upon annealing. In Fig. 10, the starting temperature of this increase in diffraction intensity for 8P is lower than that for 1P. As is observed, the starting temperature of this integrated diffraction intensity ratio change is nearly identical to that in decreasing of the S-parameter in Fig. 5(b). It implies that the supersaturated
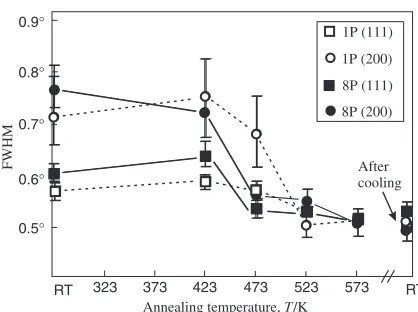
[image:7.595.321.530.66.222.2]vacancies annihilate mostly with recrystallization. Because the vacancies near the surface of an ECAP processed sample would easily disappear, the present AIPAS method must be effective to evaluate the change in global density of vacancy. In addition, the changes in FWHM determined from the (111) and (200) neutron diffraction profiles are presented in Fig. 11 as functions of annealing temperature. As shown in the figure, FWHM decreases due to the recovery and grain growth. Both the increase in grain size and decrease in dislocation density are known to decrease FWHM. Again, the starting temperature of this FWHM decrease for 8P is lower than that for 1P. If we could measure the neutron diffraction with higher resolution, we would be able to separate the contribution of grain size from that of dislocation density as the convolution of Lorentzian and Gaussian functions. Unfortunately, the resolution of the present data was not sufficient to separate these two contributions.
In conclusion, all results related to the changes in the S parameter (related to vacancies), KAM, FWHM and diffraction intensity suggest that the grain growth for 8P occurs more easily than that for 1P.
4. Conclusions
Bulky averaged microstructural parameters such as vacancy density, texture and intergranular stress for 99.99% Cu subjected to ECAP were studied using AIPAS and neutron diffraction. The main results are as follows.
(1) The S parameter related to vacancy density was found to increase after thefirst ECAP (1P) and decrease with subsequent ECAP repetitions. When the samples were annealed, the S value for 8P was found to decrease at a lower temperature than that for 1P.
(2) The positron lifetime measured by conventional PALS on thin surface layers of samples suggested that the main positron trapping site is a monovacancy, which indicates the super-saturated vacancy state in the ECAP-processed samples.
(3) ODF determined by neutron diffraction revealed the evolution of unsymmetrical texture with ECAP.
(4) From in situ neutron diffraction performed during
annealing, the changes in the intensity and FWHM of the (111) and (200) diffraction peaks suggested that (111)
(200) (220)
Residual strain
1P
2P
4P
8P
-0.002 -0.001 0.000 0.002
0.001
Fig. 9 Residual elastic strains in the ECAP-processed direction measured via the (111), (200) and (220) neutron diffraction peaks.
5
4
3
2
1
1P (111)
1P (200)
8P (111)
8P (200)
RT 323 373 423 473 523 573 RT
Inte
grated intensity ratio
Annealing temperature, T/K
Fig. 10 Changes in the (111) and (200) diffraction intensities in the ECAP-processed direction as functions of temperature; the intensities were obtained byin situneutron diffraction during annealing.
FWHM
Annealing temperature, T /K
After cooling
RT 0.8°
0.6°
0.5° 0.7° 0.9°
423
323 373 473 523 573 RT
1P (111)
1P (200)
8P (111)
[image:7.595.63.277.67.237.2]8P (200)
[image:7.595.63.276.288.452.2]the recovery and recrystallization (grain growth) in 8P begin at a lower temperature (lower thermal stability) than that in 1P; these results show good agreement with the above-mentioned conclusion (1).
(5) The intergranular stresses introduced by ECAP were determined by neutron diffraction, which must induce strength anisotropy.
(6) These results are consistent with those of SEM/EBSD observations and mechanical tests.
Acknowledgments
This work was supported by Grants-in-Aid for Scientific Research in Japan (KAKENHI), Grant Nos.#212426106, #22102006 and#22360297.
REFERENCES
1) Y. Iwahashi, Z. Horita, M. Nemoto and T. G. Langdon:Acta Mater.45
(1997) 4733.
2) R. Z. Valiev, R. K. Islangaliev and I. V. Alexandrow:Prog. Mater. Sci.
45(2000) 103.
3) Á. Révész, T. Ungár, A. Borbérly and J. Lendvai:Nanostruct. Mater.7
(1996) 779.
4) S. Li, I. J. Beyerlein, D. J. Alexander and S. V. Vogel:Acta Mater.53
(2005) 2111.
5) W. Q. Cao, C. F. Gu, E. V. Pereloma and C. H. J. Davies:Mater. Sci. Eng. A492(2008) 74.
6) L. H. Su, C. Lu, L. Z. He, L. C. Zhang, P. Guagliardo, A. K. Tieu, S. N.
Samarin, J. F. Williams and H. J. Li:Acta Mater.60(2012) 4218.
7) F. A. Selim, D. P. Wells, J. F. Harmon, J. Kwofie, G. Erikson and T. Roney:Radiat. Phys. Chem.68(2003) 427.
8) F. A. Selim, D. P. Wells, J. F. Harmon and J. Williams:J. Appl. Phys.
97(2005) 113540.
9) D. P. Wells, A. W. Hunt, L. Tchelidze, J. Kumar, K. Smith, S. Thompson, F. Selim, J. Williams, J. F. Harmon, S. Maloy and A. Roy:
Nucl. Instrum. Methods Phys. Res. A562(2006) 688.
10) P. G. Xu, Y. Tomota, H. Suzuki, T. Suzuki, S. Machiya and F. X. Yin:
Mater. Trans.49(2008) 20332039.
11) S. Matthies, J. Pehl, H. R. Wenk, L. Lutterotti and S. V. Vogel:J. Appl. Cryst.38(2005) 462.
12) T. Tomida, M. Wakita, M. Yasuyama, S. Sugaya, Y. Tomota and S. C. Vogel:Acta Mater.61(2013) 2828.
13) H. Toyokawa, T. Hayakawa, T. Shizuma, R. Hajima, K. Masuda and H. Ohgaki:Nucl. Instrum. Methods Phys. Res. A608(2009) S41.
14) K. Way (ed.): At. Data Nucl. Data Tables19(1977) 299. 15) R. H. Milburn:Phys. Rev. Lett.10(1963) 75.
16) H. Saito, Y. Nagashima, T. Kurihara and T. Hyodo: Nucl. Instrum. Methods Phys. Res. A487(2002) 612.
17) X. Molodova, G. Gottstein, M. Winning and R. J. Hellmig:Mater. Sci. Eng. A460461(2007) 204.
18) M. Morinaga and Y. Murata: Unpublished work presented at the Bulk-Metal Project Meeting (2007).
19) P. Kirkegaard, J. V. Olsen, M. Eldrup and N. J. Pedersen: Risø-R-1652(EN).
20) H. Ohkubo, Z. Tang, Y. Nagai, M. Hasegawa, T. Tawara and M. Miritani:Mater. Sci. Eng. A350(2003) 95.
21) M. Haouaoui, I. Karaman and H. J. Maier:Acta Mater.54(2006) 5477.
22) G. G. Yapici, I. J. Beyerlein, I. Karaman and C. N. Tome:Acta Mater.
55(2007) 4603.
23) T. Suzuki, Y. Tomota, M. Isaka, A. Moriai, N. Minakawa and Y. Morii: