CLAMPED SHALLOW CIRCULAR ARCHES
T h e s i s by Man Cheong Cheung
In P a r t i a l Fulfillment of the Requirement F o r t h e Degree of
Doctor s f P h i l s sophy
California Institute of Technology P a s a d e n a , California
ii
ACKNOWLEDGMENT
The author i s deeply indebted to Dr. C. D. Babcock, J r . for guidance and encouragement received during the c o u r s e of t h i s investi- gation. The valuable suggestions of Dr. E . E . Sechler a r e gratefully acknowledged.
Appreciation i s e x p r e s s e d f o r the help r e c e i v e d f r o m Mr. George Carlson of the Aeronautics Shop, Mr. Marvin Yessey of the E l e c t r o n i c s Laboratory. Very m u c h a p p r e c i a t e d was the help of Miss Helen B u r r u s f o r the typing and of M r s . Betty Wood f o r the g r a p h s and f i g u r e s .
This study was supported by the A i r Force O f f i c e of Scientific.
R e s e a r c h , Office sf Aerospace R e s e a r c h , United States A i r F o r c e u n d e r G r a n t No. AFOSR
68-
1424. The financial a i d of a GAECITABSTRACT
An experimental investigation of the relationship between the dynamic buckling and the s t a t i c buckling
e hen omen on
was c a r r i e d out.The f i r s t half of the paper studies the stability of shallow
a r c h e s subjected to l a t e r a l f o r c e s . Concentrated s t a t i c and step loads w e r e applied to c i r c u l a r a r c h e s with geometric p a r a m e t e r s 7
<
?'< 20.Equilibrium path and the dynamic response a t the loading position were recorded. Dynamic buckling i s distinct. Supercritical and subcritical responses w e r e separated by 0 . 5 O /o of the total load. The sensitivity
of the a r c h to loading imperfection was studied. The effect was p r o - nounced in the static t e s t s but moderate in the dynamic responses.
The second half of the paper studies the response of clamped c i r c u l a r a r c h e s under l a t e r a l impulse. The motion of the a r c h was recorded by a high speed c a m e r a and the deflected a r c h shape was m e a s u r e d in detail. The response was e x p r e s s e d in t e r m s of the average displacement and t h r e e generalized displacement coordinates
iv
NOMENCLATURE
2
C r o s s sectional a r e a of the a r c h (in )
A r c h width (in)
Young's Modulus ( p s i ) A r c h thickness (in)
Central a r c h r i s e (in)
2'
Specific impulse (lb- s e e /in )
4 Moment of inertia (in
Nondimensional impulse = 41' Jk2
h 4 ~ p
A r c h length (in)
Distance between load and center of a r c h (in) Concentrated load (1bB 7r q
Nondimensional load =
PW-'
( A l / 2m Generalized displacement coordinates A r c h radius (in)
Time ( s e c )
Arc11 displacement (in)
Nondimensional average displacement weight of explosive (gm)
A r c h coordinate ( r a d i a n s ) A r c h half angle ( r a d i a n s )
Geometric p a r a m e t e r =
-
4RhA E
Percentage of eccentricity =
-
L3
NOMENCLATURE (Cont'd)
Subscripts:
CR Experimental c r i t i c a l value CE Clas sicaP theoretical value
TABLE O F CONTENTS
I. INTRODUCTION
11. STABILITY O F CLAMPED SHALLOW CIRCULAR ARCHES UNDER STATIC CONCENTRATED LOADS AND S T E P CONCENTRATED LOADS
A. E x p e r i m e n t
1. T e s t Specimens
2. Experimental Setup 3 . T e s t P r o c e d u r e
B. T e s t Results C. Conclusions
119. STABILITY O F CLAMPED SHALLOW CIRCULAR ARCHES UNDER LJNIFQRaaLY DISTRIBUTED IMPULSIVE LOAD
A . E x p e r i m e n t
1. Impulsive Load 2. C a m e r a Setup
3 . Response M e a s u r e m e n t 4. T e s t P r o c e d u r e
B. T e s t Results C. Conclusion, REFERENCES APPENDIX I APPENDIX I1
TABLES FIGURES
TABLE
I Geometric Descriptions of the Tested A r c h e s
11
Nondimensional Static Critical Load111 Critical Step Load
IV Geometric Description of Tested A r c h e s V Surnnnary of Impulse T e s t s
Page 44
45
46
54
[image:7.549.44.511.48.743.2]LIST O F FIGURES F i g u r e
I
2
Response of L i n e a r Spring M a s s S y s t e m
Nonlinear Response of One D e g r e e of F r e e d o m S y s t e m
Nonlinear Response of Two D e g r e e s of F r e e d o m S y s t e m
Coordinate System of C i r c u l a r A r c h
Typical T e n s i l e T e s t of Curved 2024 Aluminum Specimen
C i r c u l a r A r c h Before and After Installation in S t e e l F r a m e
The Static and Dynamic T e s t Apparatus Knife Edge A s s e m b l y
Initial Imperfection Measuring Equipment
Measuring of Initial Imperfection of C i r c u i a r A r c h Imperfections of the T e s t e d A r c h e s
Nondimensional C r i t i c a l Static Load v s . Loading Imperfection
Comparison of Static E x p e r i m e n t s t o T h e o r e t i c a l Static Buckling Load
Dynamic Response of A r c h 32,
7
= 18.66, E = 0.00 Dynamic Response of A r c h 29,Y
= 14.40, = 0.00 Dynamic Response of A r c h 28,7
= 10.96, g: = 0.80Dynamic Response of A r c h 25, = 7 .
MCB,
a = 0.00 Load Deflection Curve f o r A r c h 32, 7 =18.66
Load Deflection Curve f o r A r c h 29, = 14.40 [image:8.545.53.510.65.718.2]F i g u r e 15c 15d 16
P a g e Load Deflection Curve f o r A r c h 28, = 10.96 74 Load Deflection Curve f o r A r c h 25,
=
7.40 75 Nondimensional C r i t i c a l Step Load v s.
Loading 76 ImperfectionComparison of Dynamic E x p e r i m e n t to T h e o r e t i c a l 97 Step Buckling Load
Calibration of Explosive (Silver Acetylide-Silver 78 N i t r a t e )
C a m e r a Setup 79
F i l m R e a d e r to M e a s u r e Deformed A r c h Shape 79 P e r f o r m a n c e and Synchronization of the High Speed 80 C a m e r a
Initial Imperfections of t h e T e s t e d A r c h e s 8 1
Initial Imperfections of the T e s t e d A r c h e s 82 Impulse v s Maximum A v e r a g e Displacement f o r 83
Clamped A r c h
Comparison of the P r e s e n t Results with Humphreys' 84 E x p e r i m e n t s
Deformed Shapes of A r c h 339 85
Deformed Shapes of A r c h 338 86
Response of A r c h
B9,
i
= 8.43 87Response of A r c h B6, .:10.45 88
Response of A r c h B7, + = 12. 19 89
Response of A r c h B8,
?
=
14.82 90 [image:9.549.46.511.59.740.2]LIST O F FIGURES ( C o n t f d ) F i g u r e
26f 26g 26h 26i 26j 2 6k 27a 27b 28a 28b 29
R e s p o n s e of A r c h C2, = 15.08 R e s p o n s e of A r c h C5,
-i
= 16.66 R e s p o n s e of A r c h C 4 , I = 16.95 R e s p o n s e of A r c h C8, = 20.33 R e s p o n s e of A r c h C7,i
= 2 1 . 6 5 R e s p o n s e of A r c h C9,T =
2 7 . 7 5 T r a j e c t o r i e s of A r c h e s f o rY
=
10 T r a j e c t o r i e s of A r c h e s f o r7
=
20A r c h A n t i s y m m e t r i c R e s p o n s e f o r 'j'
=
10 A r c h A n t i s p m e t r i c R e s p o n s e f o r ?'=
20Coordinate S y s t e m f o r Finding B e s t Fit t o t h e M e a s u r e d Hnitital I m p e r f e c t i o n s
Coordinate S y s t e m f o r t h e C l a m p e d C i r c u l a r A r c h e s
[image:10.545.37.501.69.733.2]A prominent scientist, Kirchhoff, once said that "Dynamics" i s a science of motion and f o r c e s . Thus dynamics includes statics which deals with the state of equilibrium. This relationship stimu- lated this r e s e a r c h work. It i s focused on the understanding of the dynamic buckling phenomenon of nonlinear s t r u c t u r e s a s related to t h e i r static buckling.
The s t a t i c stability of cylindrical and spherical shells was studied intensively not long a f t e r the invention of the airplane. How- e v e r , the experimental r e s u l t s had considerable s c a t t e r and were only
*
30-50 "/o of the c l a s s i c a l buckling load (Ref.
P )
for some loading**
conditions. T s i e n (Ref. 2 ) proposed a n energy c r i t e r i o n which seemed to be in b e t t e r agreement with the experiments. However, to achieve buckling a t the load given by the energy c r i t e r i o n , a p e r t u r b a - tion of unspecified magnitude i s required. ,But how and where to apply t h i s perturbation i s not p r e s c r i b e d . T h e r e f o r e , this c r i t e r i o n i s
believed to be built on an unsound b a s i s . In the past few y e a r s ,
%
The c l a s s i c a l buckling load of a shell i s defined a s the lowest eigen- value of the linearized theory. The linearized theory i s derived by perturbing the nonlinear equations of the perfect shell about a
membrane prebuckling equilibrium state. F o r the a r c h problems which will be considered l a t e r , the exact solution of the nonlinear equations i s the c l a s s i c a l solution. The c r i t i c a l condition i s reached when either the equilibrium path yields a local maximum of the loading p a r a m e t e r o r the path bifurcates into additional branches.
*%
2
experimental techniques have improved. Experimental r e s u l t s for cylindrical shells under axial compression a r e c l o s e r to the c l a s s i c a l solution than to the energy solution (Ref. 3 ) . On the other hand, i f i n i t i a l geometric imperfections a r e included in the a n a l y s i s , the
experimental buckling loads can be predicted reasonably well (Ref. 4).
The c l a s s i c a l analysis and the energy c r i t e r i o n w e r e a l s o applied to other nonlinear s t r u c t u r e s . Fung and Kaplan (Ref. 5) found t h a t the c l a s s i c a l solution compares well with experiments on simply supported a r c h e s . Gjelsvik and Bodner found that the experimental r e s u l t s for the clamped shallow a r c h subjected to a concentrated load lie in between the two theories (Refs.
6
and 7). To confirm this point,s i m i l a r t e s t s w e r e performed in this investigation.
The problem of dynamic buckling o r nonlinear response of shell s t r u c t u r e s has been widely discussed in the past few y e a r s . The
question of dynamic buckling i s of concern since t h i s phenomenon i s a s s o c i a t e d with a l a r g e change in the s t r u c t u r a l response with a s m a l l
i t e x i s t s , the load level a t which i t o c c u r s i s defined a s the dynamic buckling load.
The differential equations that govern the motion of the shell s t r u c t u r e s a r e time dependent and nonlinear. The exact solution of t h e s e equations i s the counterpart of the s t a t i c c l a s s i c a l analysis. However, to solve these hyperbolic nonlinear equations i s not a n e a s y m a t t e r . No exact solution h a s been obtained so f a r f o r those s t r u c t u r e s of interest. Numerical integration of the equations s e e m s to be the only alternative. Specifying the initial values f o r the s t r u c t u r e , the type of loading and the boundary conditions, the differential equation
can be integrated with various schemes. Due to the nature of the
equations, the convergence of m o s t schemes i s
a
s e r i o u s m a t t e r . The stability of the integration e r r o r should be investigated thoroughly before the r e s u l t s become trustworthy. The computation t i m e i s another m a j o r problem. Iterations a r e n e c e s s a r y f o r each time step and space coordinate. Depending on the complexity of the s t r u c t u r e , the computation time m a y v a r y f r o m moderate to enormous.F o r these apparent r e a s o n s , one i s inclined to u s e the much s i m p l e r energy approach. Although the energy c r i t e r i o n lost i t s
influence in static stability studies, under some loading conditions, the extended energy analysis i s v e r y convenient in the analysis of the
dynamic response (Refs. 8 - 1 1 ) . Unfortunately, t h e r e has been no
4
s t r u c t u r e s . A wide range of this nonlinear behavior can be exhibited by changing the end conditions, loading, o r geometry of the a r c h .
The energy method i s built up by using the static equilibrium s t a t e s . Knowing the static response, one can derive some of the interesting f e a t u r e s of the dynamic response. Let u s s t a r t with the
simplest example. Figure 1 shows the response of a l i n e a r spring m a s s system. The amount s f f o r c e applied to the m a s s i s
P
and q i s the displacement of the m a s s . On the force-displacement diagram, a linear s t a t i c equilibrium path OA i s t r a c e d . If the f o r c e i s applied a s a Heavi side step function, the response will be a simple harmonic motion around the static equilibrium position. The dynamic responsei s illustrated a t two load levels P and PE. The dotted lines along D
the time a x i s a r e the corresponding equilibrium positions. In t h i s c a s e , the maximum dynamic response i s twice the static response. This i s shown a s the straight line BEDB.
The relationship s f the static and dynamic response can be clarified by the potential energy ( U ) s f the system. The potential energy i s a function of the external load and the displacement. It can be decomposed into two p a r t s . The f i r s t p a r t i s the s t r a i n energy
s t o r e d in the spring. This s t r a i n energy i s proportional to the square of the displacement, and i s always positive. The second p a r t i s the potential of the external load. This t e r m is' linearly proportional to the displacement and i s negative f o r positive displacement, F o r s m a l l
along these energy curves. If no energy i s dissipated o r supplied during the c o u r s e of oscillation, the ball will r i s e to a position of the
s a m e elevation a s the initial position and o s c i l l a t e s thereafter. T h e r e - f o r e , positions E and D a r e the maximum dynamic responses a t the
s t e p load level PE and PD respectively.
Next, we consider a nonlinear one degree s f freedom system. Assume the static load deflection curve has the f o r m OABC a s shown on Figure 2a. 8 A and B@ r e p r e s e n t stable branches while the AB branch i s statically unstable under dead weight loading. Starting a t the origin, with half the initial slope, the maximum dynamic response i s shown by the dotted line. Influenced by the softening nonlinearity, the curve extends with e v e r - l e s sening slope. The i n t e r section of this
curve with the branch AB i s significant, because t h i s determines the unique position a t which the a r c h snaps under step load. This s t a t e - ment will be proved by using the potential energy curves ( F i g u r e 2b).
Point D i s a local maximum in the energy curve because it is on the AB branch. This local m a x i m u m has z e r o potential energy
since point D i s on the maximum dynamic response curve. Hence, i f a ball r o l l s along the energy curve corresponding to P =
PD,
it t a k e s a n infinite amount of t i m e to a r r i v e a t the s t a t i c equilibrium position D, Should the load be i n c r e a s e d infinitesimally, the energy of the local maximum will drop below zero and the ball will cover a n additional t e r r i t o r y . PD i s therefore defined a s the c r i t i c a l load.6
a s the t h i r d a x i s perpendicular to the P-ql plane. The s u p e r c r i t i c a l response has a bell shape curve since the kinetic energy i s low when the response c r o s s e s the local maximum of the energy curve. Thus the s y s t e m moves slower through such a range.
When a two degrees-of-freedom s y s t e m i s considered, the potential energy can no longer be e x p r e s s e d a s a single curve, but a s a continuous surface. On a surface, one can. move f r o m one point to another along a n infinite number of paths. T h e r e f o r e , the energy method fails to yield a unique c r i t i c a l condition. The alternative is t o obtain n e c e s s a r y o r sufficient conditions f o r the lower and upper
bounds respectively. This i s illustrated by Figure 3 . A typical
three-dimensional static equilibrium path i s shown on the left p a r t of Figure 3a. The elliptic path between A and B r e p r e s e n t s the
bifurcated branch which i s on a plane perpendicular to the POql plane. The maximum dynamic response i s shown a s OED. T h r e e energy
s u r f a c e s f o r load levels between P and PB a r e shown in Figure
A
3b, c, d. T h e s e surfaces have five equilibrium positions: the center one i s unstable (hill), the left and right ones a r e stable (depression), and the upper and lower ones a r e unstable (saddle). It i s again e a s i e r to visualize the dynamic response by using the analogy of the motion of a ball on the energy surface. Figure 3b shows the energy surface a t
P =
PD. The local maximum D has zero energy. If the responseball can leap over the local maximum and gets to the f a r side of the region. This sudden i n c r e a s e of response entitles PD to be the upper c r i t i c a l load.
The energy surface f o r
P
= PE i s shown in Figure 3c. The domainU S
0 becomes doubly connected. If the response i s r e - s t r i c t e d to the q l component, the ball can not r e a c h the f a r side of the region. Hence, PE i s not significant. The lower bound for the load, using t h i s energy method i s shown in Figure 3d where the energy a t the saddle points i s zero. An infinitesimal i n c r e a s e of the load d e c r e a s e s the energy a t the saddle points below zero and allows the ball to roll over to the f a r side through one of the two saddle points.the above concept in mind, a generalization to a multiple degree-of-freedom s y s t e m i s straightforward. At each load level, the muitiple dimensional energy surface i s examined. The Power bound will be determined by a load such that the f i r s t s t a t i c equilibri- u m position a p p e a r s in the zero potential energy surface. The upper bound will be defined a t a load level where the potential energy of a l l local maximums i s below o r equal to z e r o ,
8
to diverge f r o m the q l axis, to by-pass the hill and finally to a r r i v e a t the f a r stable region. This bound i s named by S i m i t s e s a s the "Minimum Guaranteed C r i t i c a l Load".
F u r t h e r m o r e , n e c e s s a r y o r sufficient conditions discussed e a r l i e r a r e f o r e l a s t i c s t r u c t u r e s without damping. Should damping be p r e s e n t , the picture would be a little different. The estimation of the n e c e s s a r y condition i s not affected because energy i s needed to account for dissipation. If the undamped s y s t e m can not escape f r o m the n e a r stable region, it i s reasonable to think that the damped system a l s o will not escape. However, the sufficient condition m u s t be r e -
considered. The upper bound f o r the undamped s y s t e m would be a n under-estimated upper bound for the damped system. As a m a t t e r of fact, the energy dissipated i s a function of the dynamic path and thus depends on the initial conditions. An upper bound s i m i l a r to the
undamped case s e e m s to be meaningless unless one can find a descend- ing path on the energy surface that connects the original position to the f a r stable region. This i s exactly the case f o r the static c r i t i c a l load a s discussed in the previous paragraph. Therefore, the static
c r i t i c a l load i s the upper bound for the damped system.
experiment showed the non-existence of other stable equilibrium positions upon total removal of external load. The non-existence of t h e s e positions does not allow a n impulsively loaded clamped a r c h to be classified a s a stability problem in the s t r i c t mathematical sense. The experiments were divided into t h r e e s e t s . The f i r s t s e t was concerned with the static buckling of clamped c i r c u l a r a r c h e s subjected to concentrated loads. The second s e t extended the f i r s t s e t to include a step function load. The l a s t s e t considered a uniform- ly distributed impulsive load. Although the f i r s t two s e t s a r e different in nature, they used s i m i l a r equipment and were performed with
10
11. STABILITY O F CLAMPED SHALLOW CIRCULAR ARCHES UNDER STATIC CONCENTRATED LOADS
AND S T E P CONCENTMTED LOADS
F o u r a r c h e s with g e o m e t r i c p a r a m e t e r s 7' = -
4Rh of approxi- m a t e l y 7 , 11, 14 and 18 w e r e u s e d in the t e s t s . T h e load was applied a t various locations on the a r c h . Although the e n t i r e deformed a r c h
shape was not m e a s u r e d , the displacement a t the loading point was recorded. The combination of the s t a t i c r e s p o n s e and the m a x i m u m dynamic response gives a c l e a r e r p i c t u r e of the buckling phenomenon. A. Experiment
The experimental s e t up u s e d f o r s t a t i c loading i s s i m i l a r to the one used by Cjelsvik and Bodner (Ref.
4).
The s t e p load wasdeveloped by suddenly r e l e a s i n g a dead weight which initially touched the a r c h surface. However, the i n e r t i a of the ciead weight changed the effective f o r c e on the a r c h and i n t u r n affected the frequency and
1. T e s t Specimens
The equations that d e s c r i b e . a shallow a r c h show that the c i r c u l a r a r c h can be c h a r a c t e r i z e d by one nondimensional p a r a m e t e r
Y ( F i g u r e 4) where
The t h r e e variables a r e length, thickness and radius of curvature. F o r a l l of the a r c h e s tested, the thickness was held constant and the s a m e nominal radius of curvature was used.
The specimens w e r e cut f r o m 1/16 inch thick 2024 T3 aluminum sheet, and were t r i m m e d by the milling machine to 3 /4 inch wide. The s t r i p s w e r e then rolled to approximately 30 inches radius in a t h r e e - r o l l r o l l e r . The radius was rough checked using a template. After rolling, 4 inches f r o m both ends w e r e cut off. The a r c h e s w e r e then heat t r e a t e d for eight hours a t 3 7 5 degrees Fahrenheit.
Straight tensile specimens w e r e t e s t e d ina n Instron testing
6
2machine. Young s Modulus was found to be 10.5 x 18 lb /in and the
2
proportional l i m i t above 44,008 l b / i n
.
Curved tensile specimens with a radius of 38 inches were s i m i l a r l y t e s t e d and the r e s u l t s w e r e much the s a m e . A typical tensile t e s t of a curved specimen i s shown inF i g u r e 5,
2. Experimental Setup
Except f o r the recording s y s t e m , both the s t a t i c and dynamic t e s t s u s e d the s a m e equipment a s explained below. A s c h e m a t i c
drawing of the setup i s shown i n F i g u r e 7. A description of e a c h i t e m m a r k e d by a l e t t e r i s a s follows.
a . Aluminum A r c h
The c e n t e r line and e c c e n t r i c i t y l i n e s w e r e m a r k e d on the convex side of the a r c h surface.
b. Steel Support f o r the A r c h
T h i s support could be moved to the left o r right in o r d e r to position the point of loading d i r e c t l y under the knife edge.
c. Knife Edge Assembly
Through a r e t r a c t a b l e pin, the knife edge was hung on a support shown in F i g u r e 8. The whole a s s e m b l y
could be moved up and down so that the knife edge was just touching the a r c h s u r f a c e before performing the t e s t . After adjusting the elevation, the support was Pocked i n position. The r e t r a c t a b l e pin was connected to a solenoid. When the c i r c u i t was closed, the solenoid pulled the pin back and the weight c a r r i e d by the knife edge could be t r a n s f e r r e d to the a r c h . F o r s t a t i c t e s t s , the knife edge was disengaged f r o m the pin manually and was gently s e t on to the a r c h . The hanging weight
d. Displacement T r a n s d u c e r
The housing of the t r a n s d u c e r was fixed to the stationary p a r t , while the sliding c o r e was connected to the top of the knife edge ( s e e F i g u r e 8). A s the knife edge moved with the a r c h , the "Lansducer m e a s u r e d the v e r t i c a l displacement a t the loading point
.
The calibration of this t r a n s d u c e r was l i n e a r with a working range of 3". By adjusting the control, the output was 100 MV p e r inch of the displacement.
e . Tension Spring
The spring i s connected to the bottom p a r t of the knife edge. In static t e s t s , i t s e r v e s a s a safety device to avoid breakage of the f r a g i l e load c e l l due to ex-
c e s s i v e displacement f r o m below. Ht was changed to a
v e r y soft spring f o r dynamic t e s t s f o r r e a s o n s mentioned previously.
f . Load Cell
The load cell was a 0. 01Ofs thick Mylar tensile specimen. The s t r i p was 1.25" wide and
6.
5" long. Two S R - 4 paper s t r a i n gages w e r e placed in s e r i e s on e a c h side of the Mylar s t r i p a s active gages. The s a m e number of dummy gages w e r e placed on the s a m e s t r i p and w e r e perpendicular to the active ones. The gages w e r e supplied by a 12V D. C . power supply. Theultimate s t r e s s of Mylar. The calibration was l i n e a r and gave 0.493 MV output p e r pound weight. On top of the initial load, t h i s gave the t o t a l applied load f o r the s t a t i c t e s t s . In the dynamic t e s t s , the load c e l l m e a s u r e d the variation of t h e effective load a s a function of time.
g. Dead Weight
This was the m a i n difference in the a r r a n g e m e n t between the dynamic and s t a t i c t e s t s . F o r the f o r m e r one, a pot of weight was hung to the Boad cell and the weight was the l a s t in the s e r i e s , In s t a t i c t e s t s , t h e weight r e s t e d on a hydraulic jack and was fastened to the Boad c e l l by a nylon cord.
h. Hydraulic Jack
The hydraulic jack was u s e d f o r the s t a t i c t e s t s . It worked a s a moving platform f o r the weights. At
the beginning of the t e s t , the piston was brought to the upper m o s t position. When the valve was opened the piston sank slowly. In the p r o c e s s of loading, the load regulated automatically with the displacement. Thus t h i s a r r a n g e m e n t established itself a s a " n e a r rigid m a ~ h i n e ' ~ and was able to m a p the unstable b r a n c h of the equilibrium path.
load cell went to Y axis. The r e s u l t was a single load deflection c u r v e representing the equilibriwn path.
A Honeywell Visicorder (Model 1508) was used to r e c o r d the dynamic response and the variation of the effective load. The outputs w e r e amplified t h r e e and one hundred t i m e s respectively for the
displacement transducer and the load cell. Inside the Visicorder, Honeywell galvanometers w e r e u s e d in recording oscillographs to t r a n s f e r voltage variations to a photographic record. The oscillo-
graphs w e r e recorded on Kodak e x t r a thin Linagraph Direct P r i n t paper (Type
1799).
3 . T e s t Procedure
T h e r e w e r e t h r e e m a i n s t e p s in the complete testing of an a r c h . Namely, they were a n initial imperfection m e a s u r e m e n t , a quasi- static t e s t and a dynamic t e s t . Arches were reusable. They
0
w a r e reloaded at different locations, including f r o m
O
O /o up to6
/ ooffset f r o m the center, This gave the reduction of c r i t i c a l load due t o a n eccentric load. In between t e s t s , imperfections of the a r c h
shape w e r e m e a s u r e d in o r d e r t o a s s u r e that the a r c h was not subjected to excessive plastic deformation.
To obtain r e s u l t s with high accuracy, the dynamic t e s t s w e r e to be performed following the s t a t i c t e s t a t the s a m e loading location. However, repeated t e s t s showed that the response c h a r a c t e r i s t i c s w e r e reproducable and were little influenced by the o r d e r of testing. In fact, a f t e r approximately one hundred t e s t s on the s a m e a r c h , the
16
the testing procedures, static t e s t s were c a r r i e d out f o r a l l loading positions and w e r e followed by the dynamic t e s t s .
In s t a t i c t e s t s , the c r i t i c a l load was defined a s the local maxi- m u m of the loading p a r a m e t e r on the equilibrium path. However, in the dynamic t e s t s , the c r i t i c a l load could not be determined by only one t e s t . Different load levels w e r e applied to the a r c h . Slightly i n c r e a s e d amplitude of vibration resulted f r o m a s m a l l i n c r e a s e in load. At a c r i t i c a l load, the maximum amplitude i n c r e a s e d abruptly.
a . Initial Imperfection Measurement
A pendulum like apparatus was built to m e a s u r e b p e r f e c t i o n s of the a r c h . It consisted of a fixed c e n t e r and rotatable a r m which could be adjusted in length. A dial gauge with a working range of 8.868 inches was installed a t the tip of the a r m ( s e e F i g u r e s
9
and 10)-The m e a s u r e m e n t was made by f i r s t adjusting the a r m to the appropriate radius then p r e s s i n g the concave
side of the a r c h gently against the dial gauge. Starting f r o m one end of the a r c h the dial gauge readings w e r e taken a t half inch intervals along the a r c h until the dial gauge could not advance another full step. This gave the deviation of the a r c h shape f r o m the p r e s e t radius. Applying the "Least Square Method" to the m e a s u r e d data the "best fit radius" and the "best fit imperfection1' can be found. The derivation of the equations to
Before the a r c h e s w e r e mounted on the supports the imperfections were m e a s u r e d . Only those a r c h e s with imperfection amplitudes l e s s than five thousandth of a n inch w e r e used. Also, they w e r e cut f r o m longer ones so that the selected sections had a minimum
amount of a s y m m e t r i c imperfection. When the a r c h was mounted and the Devcon was hardened, the a r c h
shape was m e a s u r e d again to m a k e s u r e that i t had not been excessively deformed due to the p r o c e s s of
mounting. The imperfections of the tested a r c h e s a r e shown in Figure 11.
b. Static T e s t
The a r c h was put into the knife edge a s s e m b l y such that the loading position was directly under the edge.
The a s s e m b l y was lowered so that the edge just touched the a r c h surface. At this point, the output f r o m the displacement transducer represented zero displacement of the a r c h . When this was recorded on the X - Y
plotter, the knife edge was disengaged manually f r o m the assembly. The a r c h deformed a little due to the weight of the knife edge and the spring system. This was compensated in the plotter a s initial load.
18 c. Dynamic T e s t
The procedures before the disengagement of the knife edge w e r e the s a m e a s in static t e s t s . A motor in the Visicorder was turned on and a c c e l e r a t e d the
Linagraph paper to a constant speed of 80" p e r second.
0 . 2 second l a t e r , the knife edge was r e l e a s e d by the withdrawal of the retractable gin. The response of the a r c h and the external load were transformed into a n optical signal and recorded on photo sensitive paper.
The Linagraph paper was latensified by exposing to fluorescent light. The r e c o r d t r a c e s became visible and readable in a few seconds.
When the motion of the a r c h subsided, the load was r e l e a s e d and the experiment was r e p r e a t e d with a
different amount of load. The c r i t i c a l Eoad was d e t e r - mined to within 0.05 lb. o r l e s s .
B. T e s t Results
Four a r c h e s were used in the t e s t program. The geometric p a r a m e t e r s were roughly 7, 11, 14 and 18. The a r c h e s w e r e used
repeatedly until a l l information was acquired, Between t e s t s ,
imperfection m e a s u r e m e n t s showed a slight plastic deformation around the point of loading. In spite of this, repeated t e s t s showed a l m o s t identical response c h a r a c t e r i s t i c s .
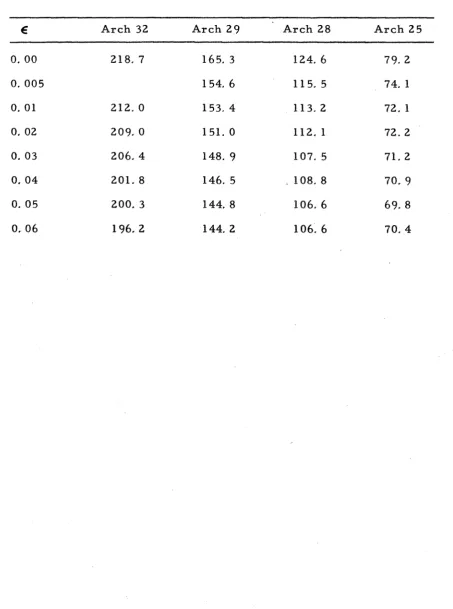
because the nondimensional load i s the product of the applied load and the geometric p a r a m e t e r . In fact, the flatter a r c h e s have a higher buckling load. Figure 12 shows the effect of a s y m m e t r i c loading. In
0
general, a 10 /o reduction of c r i t i c a l load was d e t e c t e d when the load was applied offset from the center a n amount equal to
6
O/o of the a r c h length. This effect was especially sensitive in the neighborhood of the center because the curve f o r m s a cusp a t c = 0, Similar behavior was obtained theoretically and experimentally by Thompson f o r simpler s t r u c t u r e s (Ref. 13).Figure 13 i s a comparison of the experiments with the existing analysis. The c r i t i c a l loads a r e normalized by Schreyer a d d a s u r ' s c l a s s i c a l solution (Ref. 7 ) and this ratio i s called the c r i t i c a l load ratio. The upper curve i s the classicali solution for a sinusoidal a r c h (Ref.
9).
The lowest curve i s the s t a t i c energy solution f o r clamped c i r c u l a r a r c h e s (Ref.6 ) .
Experiments performed by Gjelsvik and Bodner have considerable scattering and the r e s u l t s a r e much lower than the p r e s e n t ones,It was observed on the load deflection diagram that the equilibrium paths c r o s s e d the a b s c i s s a ( d i s i l a c e m e n t a x i s ) a t no
point other than the origin. Therefore, only the original configuration i s a possible equilibrium position a t the z e r o load condition.
20
load will r e s u l t in a factor of t h r e e change in response. The dotted straight lines r e p r e s e n t the s t a t i c equilibrium positions a t the c o r r e s - ponding load levels. The subcritical responses w e r e damped to the
n e a r equilibrium positions while the super c r i t i c a l responses vibrated around the f a r equilibrium positions. If damping were not p r e s e n t , the s u p e r c r i t i c a l response would have completed the bell shape curves. The superposition of the static response and the maximurn dynamic response i s shown in F i g u r e s 15a-15d, One o b s e r v e s that
subcritical maximum dynamic response i s always l e s s than the second branch of the s t a t i c equilibrium path. This a g r e e s with the statement
in the introduction that the energy level a t such a branch i s higher. The effect of loading imperfections i s shown in Figure 16. In contrast to s t a t i c t e s t s , the influence of the loading location i s much l e s s and the reduction of the c r i t i c a l Poad a p p e a r s to have a smooth transition n e a r the center.
Finally, the dynamic c r i t i c a l loads w e r e normaiized by Schreyer and M a s u r s s static c l a s s i c a l solution. The r e s u l t s a r e plotted in Figure 17. In addition, the upper bound and lower bound of the dynamic c r i t i c a l Poad f o r a sinusoidal a r c h (Ref.
9 )
and thenumerical solution for the c i r c u l a r a r c h (Ref. 12) a r e superimposed on the same diagram. The p r e s e n t experiments a g r e e v e r y well with Vahidi's numerical r e s u l t s .
C. Conclusions
difference between the two experiments i s partly due to the different way of estimating the radius of curvature. The nondimensional load i s proportional to the square of the radius. A 5 "/o e r r o r in calculat-
0
ing the radius, therefore causes a 18 /o e r r o r in the load. The geometric p a r a m e t e r
Y
i s a l s o proportional to the radius. Therefore, a n a c c u r a t e determination of the radius i s important in reducing the data for comparison with the analysis. Previously, the radius wascalculated by measuring the relative positions of t h r e e points on the a r c h . In p r e s e n t t e s t s , the a r c h was m e a s u r e d a t many stations. The
calculated radius i s a best fit to a l l m e a s u r e d points. In addition, the knowledge of the initial geometric imperfection provided a b e t t e r
choice of specimens and avoided unnecessary complications.
Overall, the static t e s t s a g r e e reasonably well with Schreyer and M a s u r s s exact solution. The r e s u l t s a r e sensitive to the position of loading. The c r i t i c a l load i s reduced sharply when the load i s
slightly off center. On the other hand, the dynamic response i s quite insensitive in this respect.
F o r a l l step loading t e s t s , the c r i t i c a l dynamic load was
determined to within 0 . 0 5 pound. This amount of load corresponds to one-half p e r cent change in the total load which causes a n i n c r e a s e of the maximum displacement by a factor of t h r e e .
The step loading t e s t s and the analyses a r e summarized in Fig.
2 2
positions for each load level m u s t be found. This i s c a r r i e d out in Appendix 11. These positions correspond to the local minimums,
saddle points o r the local maximums on the energy s u r f a c e s .
In the c a s e of clamped c i r c u l a r a r c h e s , a s y m m e t r i c equilibri- u m positions a r e possible f o r 7
2
11.8. Hence, f o r 7 < 1 1 . 0 ,a s y m m e t r i c saddle points do not exist. Consequently, the upper and lower bounds m e r g e together. As pointed out in the introduction, this bound i s m o r e appropriately called a lower bound i f damping i s
considered. The static c r i t i c a l load will be the corresponding upper c r i t i c a l load.
The r e a s o n why the lower bound i s above the c r i t i c a l load
obtained by Vahidi, who used numerical integration i s not c l e a r . How- e v e r , the difference between the r e s u l t s f r o m the two analyses i s v e r y small. In addition, the experimental r e s u l t s were expected to lie above the lower bound. i f damping affected the experiments, the
r e s u l t s should compare with the theory m o r e favorably. However, the experimental r e s u l t s a r e a little below the lower bound. Static experi- m e n t s show s i m i l a r reduced c r i t i c a l load f r o m the exact solution.
significant to extend t h i s type of work to m o r e complicated s t r u c t u r e s where a direct solution of the differential equations i s impractical.
Finally, it was found that the original r e s t configuration of the a r c h was the only equilibrium position a t the zero load condition. This i s in agreement with Vahidi's calculation (Ref. 14). Since the existence of other equilibrium positions i s a requirement in a n energy approach to determine the c r i t i c a l load level, the impulsive loaded
24
111. STABILITY O F CLAMPED SHALLOW CIRCULAR ARCHES UNDER UNIFORMLY DISTRIBUTED IMPULSIVE LOAD
F o r the impulsive loading experiments 11 a r c h e s w e r e used. They were divided into two groups. One group had a geometric p a r a - m e t e r close to 10, the other group close to 20. Silver acetylidebsilver nitrate was sprayed directly on the a r c h . This light sensitive explo-
sive was detonated by a Xenon flash tube. The response of the a r c h was recorded by a high speed c a m e r a . The displacement was
m e a s u r e d carefully and the data analyzed on a digital computer. The explosive load was a v e r y short duration p r e s s u r e loading, If the duration i s much s h o r t e r than the fundamental natural period, the loading can be t r e a t e d a s giving the a r c h a n initial velocity. F o r a l l positive t i m e , the a r c h i s f r e e f r o m l a t e r a l load and i s in f r e e vibra- tion. Obviously, this i s a p a r t i c u l a r c a s e of P a r t 11, where the energy
surface a t z e r o load condition should be investigated. Although t h e r e e x i s t s only one equilibrium position, it i s suspected that t h e r e may be a significant change of maximum response in a relatively narrow range of impulse p a r a m e t e r . If this i s the case, the determination of the inflection point 6n the maximum response curve i s therefore
significant.
A, Expe riment
These experiments consisted of loading a clamped c i r c u l a r a r c h with a v e r y s h o r t duration uniform p r e s s u r e load. The a r c h e s w e r e fabricated, chosen and mounted the s a m e way a s in P a r t 11. The
A detailed description of the experimental work i s p r e s e n t e d i n the following sections. The r e s u l t s a r e compared with Humphreys e x p e r i m e n t s and a n a l y s i s (Refs. 15 and 16).
1
.
Impul s ive LoadS i l v e r Acetylide-Silver Nitrate was u s e d to apply a v e r y s h o r t duration p r e s s u r e loading on the a r c h . The advantage of t h i s chemical i s the low level of impulse, which i s approximately one-tenth of o t h e r c o m m e r c i a l l y available explosives, and i t s ability to be detonated with a n intense light. The g e n e r a l p r o p e r t i e s a r e d i s c u s s e d i n r e f e r e n c e s
17 and 18. H e r e a brief description of the p r e p a r a t i o n and calibration of t h i s explosive will be given.
To begin with, each 10 g r a m s of s i l v e r n i t r a t e s a l t a r e dissolved into 40 cc. of distilled water. Then
6
cc. of concentrated n i t r i c a c i d ( s . g. 1.4) i s slowly added. The solution i s gently s t i r r e d until a l l c r y s t a l s a r e dissolved and then acetylene g a s i s bubbled through the solution. Fine grained white precipitate i s obtained by Petting the g a s come through v e r y slowly. This i s m o r e d e s i r a b l e f o rspraying, After the white powder c e a s e s to precipitate, it i s washed with acetone. With acetone a s a thinner the precipitate i s s p r a y e d on the a r c h s u r f a c e . It i s then d r i e d in a n oven a t about 100 d e g r e e s Fahrenheit. Aging f o r m o r e than one day i s not recommended.
26
cannot be remedied and the whole p r o c e s s h a s to be repeated f r o m t h e v e r y beginning.
This explosive can be detonated by a n e l e c t r i c s p a r k o r a n intense light. It h a s been shown that a fairly l a r g e a r e a can be detonated within a few microseconds i f expendable Xenon flash tubes a r e used (Ref. 18). It was found that if one nonexpendable Xenon flash tube was used, complete detonation o v e r the longest a r c h could be accomplished in l e s s than 150 microseconds. This duration of loading on the whole a r c h i s s h o r t enough that it can be considered impulsive (Ref. 1 5).
A GE-522 Xenon flash tube, mounted in a parabolic r e f l e c t o r , was used a s the detonator. The tube was driven by a 250 m i c r o f a r a d capacitor charged to 5, 000 volts. The r i s e t i m e of the tube was about 20 microseconds and the duration of the light pulse was of the o r d e r of 300 microseconds.
The calibration of the impulse generated by this explosive was c a r r i e d out on a ballistic pendulum. The explosive was deposited evenly on a 2 inch square s t e e l plate and attached to the end of the pivoted a r m of the pendulum. The calibration curve of impulse v s . weight i s shown in Fig. 18. The offset f r o m the origin i s due to the friction a t the pivot point. F r o m t h e s e data a n impulse level of
l b - s e c / i n 2 2
0.152 (6.75 x 10 dyne-sec/cm ) was calculated. This g m /in2 g m / c m 2
2. C a m e r a Setup
A 16 m m , high speed motion picture c a m e r a (HyCam, Red Lake L a b o r a t o r i e s ) was used to r e c o r d the r e s p o n s e of the a r c h . T h e a x i s of the c a m e r a was aligned perpendicular to the b a s e line of the a r c h . To eliminate a s much distortion a s possible, the c a m e r a was placed a t l e a s t 7 feet away. Two different l e n s e s w e r e u s e d to cover the s i z e of field n e c e s s a r y f o r the different length a r c h e s tested. T h e s e l e n s e s w e r e a f / 1 . 9 C o s m i c a r Television L e n s with a focal length of 75 m m and a f / 1 . 8 Super T a l c u m a r f r o m A s a h i Optical
Company with a focal length of 55 mrn.
The light was provided by four 1 , 000 watt quartz-iodine flood l a m p s . They w e r e placed on the side of the a r c h opposite the c a m e r a and a i m e d d i r e c t l y a t the c a m e r a . In o r d e r to collect m o r e light a t the c a m e r a , a l a r g e p l a s t i c F r e s n e l l e n s of focal length of 30 inches was placed between the a r c h and the l a m p s , A s h e e t of c l e a r Mylar was placed on the flat side of the F r e s n e l lens to help diffuse the intense and unevenly concentrated light. A spot light m e t e r a t the c a m e r a position was used to check the evenness of the lighting of the F r e s n e l lens. The c a m e r a setup i s shown in F i g u r e 19.
2 8
3 . Response Measurement
A detailed deflection h i s t o r y of the a r c h motion was obtained by reading the f i l m f r a m e by f r a m e . The film was projected using a
500 watt slide projector on a m i r r o r a t a distance of about 15 feet. The image was reflected to a s c r e e n ruled with 21 equally spaced lines (Fig. 20). The distance to the m i r r o r was adjusted until the a r c h image f r o m support to support fix exactly on the twenty equal division on the s c r e e n . The lines then s e r v e a s the X coordinate for the a r c h . The Y distance was m e a s u r e d using a stretched wire perpendicular to the X lines. This wire was attached to a moving
slide whose position was m e a s u r e d by a l i n e a r potentiometer. The wire was carefully moved to each intersection of the a r c h image and the lines ruled on the screen. The potentiometer reading was
automatically recorded on punched c a r d s f o r digital computer
reduction. Approximately 50 f r a m e s were r e a d f o r each t e s t covering about 10 milliseconds of motion.
4. T e s t Procedure
When a particular value of 7 was selected the a r c h was cut to the appropriate length and a 3
/
16 inch hole was drilled in each end.This hole provided a m o r e s e c u r e support of the a r c h in the f r a m e . The surface of the a r c h was then cleaned and the weight determined to the n e a r e s t 1 /2000 of a gram. An estimation of the weight of the explosive was made and then i t was sprayed on the convex side of the arch. The explosive was cured for one hour a t 100 d e g r e e s
not obtained the p r o c e s s was repeated until the weight differs f r o m that d e s i r e d by a few hundredths of a g r a m . Next the a r c h was secured in the steel f r a m e with Devcon B.
After the Devcon has hardened, the a r c h and support a r e align- ed with the c a m e r a . The Xenon flash tube was placed about 10 inches above the surface of the a r c h and the evenness of the light source was
checked. The c a m e r a was s t a r t e d and a n Event Synchronizer built into the c a m e r a discharged the Xenon tube when 325 feet of f i l m had been exposed. This point i s shown a s point A in the c a m e r a p e r f o r m - ance curve (Fig. 2 1). The deformation of the a r c h that i s of i n t e r e s t t a k e s about 3 feet of film. The l a s t 100 feet of exposed f i l m was
developed and the p a r t of i n t e r e s t retained.
B. T e s t Results
A total of 11 t e s t s were recorded by the high speed c a m e r a . These t e s t s w e r e divided into two groups. Group B has a geometric p a r a m e t e r "/ close to 10 and for group C, "/ was close to 20. The dimensions a r e listed in Table IV. The a r c h e s used for testing were selected so a s to minimize the size of initial imperfections. The
initial imperfections a r e shown in Figure 22. In a l l c a s e s the deviation f r o m the perfect a r c h was l e s s than 5 p e r cent of the thickness.
30
values of the maximum average displacement a r e l i s t e d in Table V and a r e shown in Figure 23 a s a function of the nondimensional
impulseT. This figure shows that the a r c h exhibits a l a r g e i n c r e a s e in maximum response over a r a t h e r s m a l l range of impulse level. The maximum r a t e of change of response (the inflection points f o r the faired curves in Figure 23) a r e a t a n impulse level
7f-
of9
and 22 forY equal to 10 and 20 respectively. It i s interesting to note that these points a r e close to the point of average displacement equal to one which was used by Humphreys (Ref. 15) to define the c r i t i c a l load. However, they a r e about 6-7 t i m e s a s high a s Humphreys' experi- mental r e s u l t s . The reason for this i s not known a t this t i m e , A
comparison with Humphreyss r e s u l t s i s shown in Figure 24.
The deformation of the a r c h can a l s o be displayed a s successive pictures of the a r c h shape. This i s done for two representative shots
in Figure 25. Time s t a r t s a t the top of the figure and the time between successive shapes i s about 200 microseconds.
In o r d e r to get a m o r e quantitative picture of the a r c h deforma- tion, a t h r e e mode approximation to the deformed shape was calculated, The representation used i s a s follows:
a r c h e s . The line of average displacement equal to one i s a l s o shown i n the figures.
In addition to the dynamic t e s t s r e s u l t s described above, a n attempt was made to determine the static equilibrium positions of the clamped a r c h . This i s of i n t e r e s t since the existence of these posi- tions i s a requirement in an energy approach to determining the
dynamic buckling loads. These t e s t s were c a r r i e d out by pushing the a r c h through to a Barge displacement configuration by hand and
attempting to find a position where it would stay. This was unsuccess- ful for the 4 a r c h e s used with
Y
z
10 and 20. In addition, the existence of a n unstable equilibrium position could not be detected. This i s somewhat m o r e difficult to determine experimentally since it i s like trying to balance a ball on top of a hill. However, t h e r e did not s e e m to be any equilibrium points other than the undeformed position for the a r c h e s tested. This i s in agreement with Vahidis s calculation (Ref. 14).C. Conclusion
32
dynamic buckling problem. However, from a practical point of view the i n c r e a s e in deflection i s of the o r d e r of t h r e e for a s m a l l i n c r e a s e i n impulse level. This i n c r e a s e is about the s a m e amount a s one obtains f o r s t e p loading on a simply supported a r c h in the range of geometric p a r a m e t e r where d i r e c t snapping o c c u r s (Ref. 11).
It i s of i n t e r e s t to note that this problem i s like the one of d i r e c t snapping a s categorized by Lock (Ref. 11). In o t h e r words the s t r u c t u r e reaches i t s maximum displacement on the f i r s t oscillation of the fundamental mode. This can be seen f r o m the response plots
(Fig.
26)
combined with the t r a j e c t o r i e s (Fig. 27). An examination of the nonsyrnmetric response was a l s o made. The f i r s t component of the antisyrnmetric response i s shown in Figure 28. As seen f r o m these two c a s e s of a subcritical and s u p e r c r i t i c a l impulse, the anti-s y m m e t r i c mode was not p a r a m e t r i c a l l y excited by the fundamental mode. It obtained i t s maximum o r n e a r l y maximum e a r l y in the motion, and did not grow until the s y m m e t r i c response achieved i t s maximum displacement.
In s u m m a r y , while no evidence has been found that the clamp- ed c i r c u l a r a r c h under impulse loading can be rigorously categorized a s a dynamic buckling problem, i t i s c l e a r that over a s m a l l range in impulse the a r c h undergoes a significant i n c r e a s e in response. It i s therefore of practical significance to determine this range of
REFERENCES
Fung, Y. C, and S e c h l e r , E . E . : "Instability of T h i n E l a s t i c
Shells", S t r u c t u r a l M e c h a n i c s , P r o c . of F i r s t Symposium on Naval S t r u c t u r a l Mechanics, P e r g a m o n P r e s s , New York, pp 115-168, (1960).
T s i e n , H. S. : "A T h e o r y f o r t h e Buckling of Thin Shells", J. A e r o . Sci., Vol. 9, No. 10, pp 373-384, (Aug. 1942).
Babcock, C. D . , J r . : "The Influence of the T e s t i n g Machine on the Buckling of Cylindrical S h e l l s u n d e r Axial C o m p r e s s i o n " , Hnt. J. Solid S t r u c t u r e s , 3, pp 809-817, (1967).
A r b o c z , J. a n d Babcock, C. D . , J r . : "The Effect of G e n e r a l I m p e r f e c t i o n s on the Buckling s f Cylindrical shell^'^, to b e published, J o u r n a l of Applied Mechanics.
Fung, Y. C. a n d Kaplan, A. : "Buckling of Low A r c h e s o n Curved B e a m s of S m a l l Curvature", NACA T N 2840, (Nov. 1952). Gjelsvik, A. and Bodner, S. R. : "The E n e r g y C r i t e r i o n and
Snap Buckling of A r c h e s " , J. Eng. Mech. Div., AMCE, pp 8 7 - 134 (October 1962).
S c h r e y e r , PI. L. and M a s u r , E . F.: 91Buckling of Shallow A r c h e s " ,
J. Eng, Mech. Div., P r o c . ASCE, pp 1-17 (August 1966). Hoff, N. J. and B r u c e , V. G. : "Dynamic A n a l y s i s of t h e
Buckling of L a t e r a l l y Loaded F l a t A r c h e s " , J. Math P h y s .
,
32, pp 276-288 (1954).Hsu, C. S. : "Equilibrium Configurations of a Shallow A r c h of A r b i t r a r y Shape and T h e i r Dynamic Stability C h a r a c t e r " ,
Int.
34
10. S i m i t s e s , G. J. : "Dynamic Snap-Through Buckling of Low A r c h e s a n d Shallow S p h e r i c a l Caps", Ph. D. D i s s e r t a t i o n , Dept. of A e r o . and A s t r o .
,
Stanford University (June 1965). 11. Lock, M. H. : g ' T h e Snapping of a Shallow Sinusoidal A r c h u n d e ra Step P r e s s u r e Load", A e r o s p a c e C o r p . , Space S y s t e m s Div., TR-65-107 ( J u l y 1965).
12. Vahidi, B. : s'Dynamic Stability of Clamped C i r c u l a r A r c h e s " , Graduate Student, University of California, San Diego, P r i v a t e Communication.
13. Thompson, J . M . T . : "Dynamic Buckling under Step Loading", Dynamic Stability of S t r u c t u r e s , Edited by G. H e r r m a n n , P e r g a m o n P r e s s , pp 215-236 (1967).
14. Vahidi, B. : "Non-Existence of Snap- Through f o r Clamped
Shallow E l a s t i c A r c h e s Subjected t o Impulsive Load", T R No. 8 , University of California, San Diego, ( M a r c h 1968).
15. Humphreys, J. S.:
" O n
Dynamic Snap-Buckling of ShallowA r c h e s " , AIAA J o u r n a l , Voll. 4, NO. 5, pp 878-886, (May 1966). 16. Humphreys, J. S. : "On the Adequacy of E n e r g y C r i t e r i a f o r
Dynamic Buckling of A r c h e s " , A I M Jourmall, VoP. 4 , No. 5, pp 921-928, (May 1966).
17. Nevill, G. E . a n d Hoese, F. 0 . : "Impulsive Loading Using Sprayed S i l v e r Acetylide -Silver Nitrate", E x p e r i m e n t a l Mechanics, pp 294-298, (Sept. 1965).
APPENDIX I
LEAST SQUARE FIT O F THE IMPERFECT CIRCULAR ARCH
The concave side of the a r c h surface was m a r k e d e v e r y half a n inch. At t h e s e positions, the distance with respect to a fixed point
was m e a s u r e d by a rotatable a r m a s described previously ( s e e Fig. 29). These distances w e r e denoted by Ri. The "Best Fit Radius"
E,
and "Best F i t Center" (BFC) were found by the method of l e a s t s q u a r e e r r o r . The distance between the two c e n t e r s i s r , and the anglebetween a v e r t i c a l line and the line joining two c e n t e r s i s 8. F u r t h e r - m o r e , e x p r e s s R. with respect to IBFC and call that distance
E..
1 1
The relation between
E.
and R., s i s a s follows:P 1
1
la:
2R. sincx.
+
r. sin 8)+
(R.. c o s a . 9 P. cos 0 )1 1 1 1 (1)
Then, the deviation of the a r c h surface f r o m the "Best Fit Archu i s ei
- -
where e = R-Ri
i (2)
Assuming that t h e r e w e r e N positions along the a r c h , the total square e r r o r e i s given by
-
The undetermined p a r a m e t e r s R, r and 8 can be determined by the following variational equations.
8 6
-
=
N(R
- K 1-
rK2 cos 8) =0
a
€-
= (K1K2-
K4) cos 9-
K3 s i n 8a r
(6)
r 2
+
?[(K;-
K1K6) cos 2 9-
K1K5 sin 2 B t ( K 2 + K l K 7-
2)I
= 0w h e r e
P
- N s i n 2 a. 1
N
K~ =
kC
-
R: 1 cos 2q;
and sin u = 0.
The
relation ( 4 ) has been used in ( 5 ) and (6).i i=
B
Combining (5) and ( 6 ) and eliminating r , a transcendental equation f o r 8 i s obtained
B t a n 8 =
-
-
A
w h e r e
1 2
A = K K -K4+ (K4K7-K K K t K4K6
-
3K K K.+
K3K5)APPENDIX I1
EQUILIBRIUM POSITIONS AND THEIR ENERGY LEVELS
O F CLAMPED ARCHES UNDER CONCENTWTED LOAD
NOMENCLATURE
C r o s s sectional a r e a of the a r c h Integration constant
Integration constant Young's Modulus A r c h thickness
Central a r c h r i s e Moment of inertia A r c h length
Axial t h r u s t
Concentrated load
Nondirnensional load A r c h radius
Heaviside s t e p function T irne
A r c h displacement
4x 2
Initial a r c h shape
x A r c h coordinate
-
2x x =-
Nondimensional a r c h displacement
W
-
-2g
Nondirnensionalinitialarchshapeyo 2
I3 A r c h half angle
y = -=---
'
L
2H G e q m e t r i c P a r a m e t e r4Rh h h
D i r a c delta function
Nondimensional a x i a l s t r a i n Potential e n e r g y of t h e s y s t e m Nondimensional potential e n e r g y
P M a s s density
A. S y m m e t r i c Equilibrium P o sitions
The coordinate system i s shown in Figure 3 0 . The equations of motion of a shallow a r c h can be e x p r e s s e d in t e r m s of the displace- ment a s derived in reference 8.
where
Substituting the nondimensional quantities, ( 1 ) can be written in dimensionless f o r m a s follows,
2
y""
+
p, y"+
y t??6
(x)§(+I
=O
The s t a t i c equilibrium positions can be obtained by letting the inertia t e r m equal to zero. The corresponding static equation will
y1 = A l s i n p P + A 2 c o s p % + A 3 % + A 4 [ - 1 S X <
01
(5)
-
y2 = B~ s i n p ~
+
B cos p~+
B x+
B~[o<
F <
1 12 3
The boundary conditions for the clamped a r c h e s a r e :
The continuity conditions and the jump i n s h e a r a t the point of loading
(i?
=
8 ) a r e e x p r e s s e d a s follows:4-d
The p--P relationship can be found by substituting (5) into ( 3 ) .
2 2 2, 2 2
p
=
2 7+
( A ~-
+
B~-
BY)
-$
sin 2p, 2-
(AIAZ-
B B ) P sin (I-
2(A1A3 f BIB3) sinP
1 2
( 9 )
The roots of this transcendental equation correspond to the value of p a t the equilibrium positions under the specified load level
B. Antisymmetric Equilibrium Positions
If the determinant of the coefficient of A vanishes, i. e.
,
t a n p = p,A 1 , A3 can not be determined uniquely a s i n (8). The lowest possible
p that s a t i s f i e s t h i s condition i s V
=
4.492. In t h i s c a s e , only one s f( 10) i s independent.
P
A3 = ~ ( I
-
Is i n p)-
A s i n p2~ 1
Substitute (11) and ( 5 ) into (3). A quadratic equation of A
E
i s obtained.2 P 2
( s i n p cos p
-
p)A2+
7
( s i n p 4- 2 cos p-
2) A2 (12)b'.
T h e A2, A4, B l , B2, B3 and B4 will be determined according to (8).
C . Potential Energy of the S y s t e m
The nondimensional potential energy i s a s follows:
1
2 1 4
=J
(y"-
y;) d x + - p-
2i;(y0-
YII
21 0
-
1Substitute (5) into (14), we get
-
2 2 2 2 1 2 2 2 2II
= p 3 B ( ~ , + A 2+
B1+
B2)-
$(A1-
A 2 + B-
B2) s i n 2p 1-
(AIA2-
B I B 2 ) sin2 l
p+
24-
3Yp[
(A1-
B 1 ) ( l-
cos p) (15)The r e s u l t s obtained above were evaluated numerically on a n IBM 360/?5 computer. The numerical r e s u l t s for the c r i t i c a l static load a g r e e with the r e s u l t s obtained by S c h r e y e r and Masur (Ref. 7). The values of the upper and lower bounds w e r e n m e r i c a l l y calculated and
44
TABLE I
Geometric Descriptions of the Tested Arches
Arch 32 Arch 2 9 Arch 28 Arch 25
b (in) 0. 75 0. 75 0. 75 0. 75
h (in) 0.0632 0.0643 0.0643 0.0643
L (in) 12.20 10. 90 9. 50 7. 75
R (in) 31. 56 32.09 32. 01 31. 58
9 ,
Y 18.655 14. 395 10. 962 7.395
"
E-f (in) 0. 5895 0,4528 0. 3524 0.2377 [image:54.551.59.503.135.738.2]-
Nondirnensional S t a t i c C r i t i c a l LoadP
[image:55.545.53.507.118.728.2]46
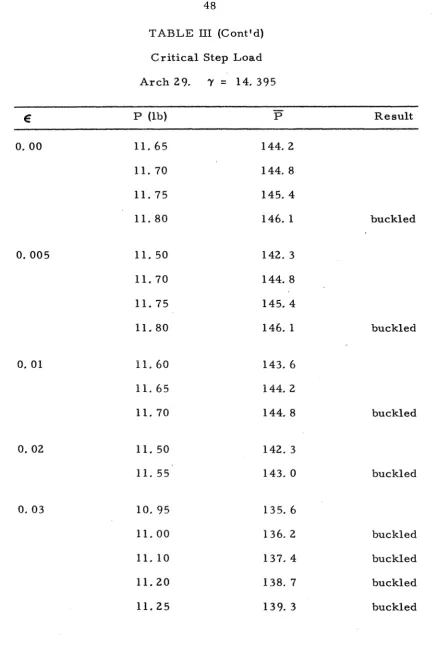
TABLE 111 Critical Step Load
Arch
32. Y=
18. 655-
P
(lb) P Resultbuckled
buckled buckled
buckled buckled
TABLE 111 (Contfd) C r i t i c a l Step Load Arch 32. Y
=
18.655-
E
P
(1b) P Resultbuckled buckled
buckled
[image:57.545.62.498.47.731.2]TABLE 111 (Contld) Critical Step Load Arch 29, Y
=
14. 3 9 5-
E
P (lb) P Result144.2 144. 8 1 4 5 . 4
144. 1 buckled
11.80 146. 1 buckled
buckled
buckled
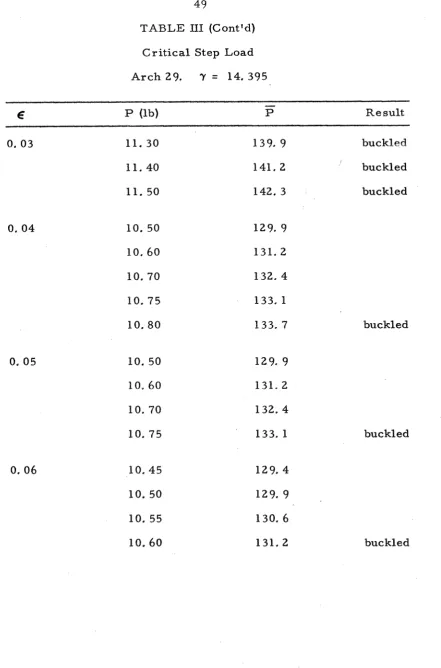
[image:58.545.47.489.58.713.2]TABLE 111 (Cont'd) C r i t i c a l Step Load Arch 29. 9'
=
14. 395-
d P (lb) P Re sult
buckled buckled buckled
buckled
buckled
[image:59.545.54.496.55.724.2]50
TABLE 111 (Contld) C r i t i c a l Step Load Arch 28, Y
=
10. 962Result
106. 5 buckled 107. 0 buckled
13.10 187.4 buckled
108.1 buckled 110.6 buckl