DOI: 10.1126/science.1159775
, 1322 (2008);
321
Science
et al.
Eva Pastalkova,
the Rat Hippocampus
www.sciencemag.org (this information is current as of September 5, 2008 ):
The following resources related to this article are available online at
http://www.sciencemag.org/cgi/content/full/321/5894/1322
version of this article at:
including high-resolution figures, can be found in the online
Updated information and services,
http://www.sciencemag.org/cgi/content/full/321/5894/1322/DC1
can be found at:
Supporting Online Material
http://www.sciencemag.org/cgi/content/full/321/5894/1322#otherarticles
, 9 of which can be accessed for free:
cites 36 articles
This article
http://www.sciencemag.org/cgi/collection/neuroscience
Neuroscience
:
subject collections
This article appears in the following
http://www.sciencemag.org/about/permissions.dtl
in whole or in part can be found at:
this article
permission to reproduce
of this article or about obtaining
reprints
Information about obtaining
is a
Science
2008 by the American Association for the Advancement of Science; all rights reserved. The title
Copyright
American Association for the Advancement of Science, 1200 New York Avenue NW, Washington, DC 20005.
(print ISSN 0036-8075; online ISSN 1095-9203) is published weekly, except the last week in December, by the
Science
on September 5, 2008
www.sciencemag.org
strates are processed in mFAS by individual full sets of active sites, according to the path of ACP described above. However, these studies have also shown that a minority of substrates can be shuttled between the two sets of active sites, either by ACP serving both MAT domains or by direct interaction of ACP with both KS domains (6,60–62). In light of the large 135 Å distance between the ACP anchor point located in one catalytic cleft and the MAT in the other, the most plausible explanation for the minor mode-of-domain interaction is a large-scale rotation of the upper portion of mFAS, relative to the lower portion (fig. S4).
The molecular description of active sites in mFAS should stimulate the development of improved inhibitors as anticancer drug candi-dates. As demonstrated by structural homology, this structure is also a good template for the organization of PKS modules; it agrees with and extends present theoretical models of PKS architecture (19,22). Furthermore, the structure of mFAS paves the way for structure-based ex-periments to answer remaining questions on the dynamics and substrate shuttling mechanism in megasynthases.
References and Notes
1. S. W. White, J. Zheng, Y. M. Zhang, C. O. Rock,Annu. Rev. Biochem.74, 791 (2005).
2. S. Jenniet al.,Science316, 254 (2007).
3. S. Jenni, M. Leibundgut, T. Maier, N. Ban,Science311, 1263 (2006).
4. I. B. Lomakin, Y. Xiong, T. A. Steitz,Cell129, 319 (2007). 5. T. Maier, S. Jenni, N. Ban,Science311, 1258 (2006). 6. S. Smith, S. C. Tsai,Nat. Prod. Rep.24, 1041 (2007). 7. F. Lynen,Eur. J. Biochem.112, 431 (1980). 8. E. Schweizer, J. Hofmann,Microbiol. Mol. Biol. Rev.68,
501 (2004).
9. F. P. Kuhajdaet al.,Proc. Natl. Acad. Sci. U.S.A.91, 6379 (1994).
10. J. A. Menendez, R. Lupu,Nat. Rev. Cancer7, 763 (2007). 11. F. P. Kuhajda,Cancer Res.66, 5977 (2006). 12. H. Oritaet al.,Clin. Cancer Res.13, 7139 (2007). 13. M. Leibundgut, S. Jenni, C. Frick, N. Ban,Science316,
288 (2007).
14. E. Ploskonet al.,J. Biol. Chem.283, 518 (2008). 15. G. Bunkocziet al.,Chem. Biol.14, 1243 (2007). 16. B. Chakravarty, Z. Gu, S. S. Chirala, S. J. Wakil,
F. A. Quiocho,Proc. Natl. Acad. Sci. U.S.A.101, 15567 (2004).
17. C. W. Pemble IV, L. C. Johnson, S. J. Kridel, W. T. Lowther,
Nat. Struct. Mol. Biol.14, 704 (2007).
18. Y. Tang, C.-Y. Kim, I. I. Mathews, D. E. Cane, C. Khosla,
Proc. Natl. Acad. Sci. U.S.A.103, 11124 (2006). 19. A. T. Keatinge-Clay, R. M. Stroud,Structure14, 737
(2006).
20. A. T. Keatinge-Clay,Chem. Biol.14, 898 (2007). 21. Y. Tang, A. Y. Chen, C.-Y. Kim, D. E. Cane, C. Khosla,
Chem. Biol.14, 931 (2007).
22. C. Khosla, Y. Tang, A. Y. Chen, N. A. Schnarr, D. E. Cane,
Annu. Rev. Biochem.76, 195 (2007).
23. A. K. Joshi, A. Witkowski, H. A. Berman, L. Zhang, S. Smith,
Biochemistry44, 4100 (2005).
24. Materials and methods are available as supporting material onScienceOnline.
25. J. G. Olsen, A. Kadziola, P. von Wettstein-Knowles, M. Siggaard-Andersen, S. Larsen,Structure9, 233 (2001). 26. J. M. Thorn, J. D. Barton, N. E. Dixon, D. L. Ollis,
K. J. Edwards,J. Mol. Biol.249, 785 (1995). 27. J. L. Martin, F. M. McMillan,Curr. Opin. Struct. Biol.12,
783 (2002).
28. I. Fujii, N. Yoshida, S. Shimomaki, H. Oikawa, Y. Ebizuka,
Chem. Biol.12, 1301 (2005).
29. I. Molnaret al.,Chem. Biol.7, 97 (2000). 30. D. J. Edwardset al.,Chem. Biol.11, 817 (2004). 31. A. Witkowski, A. K. Joshi, S. Smith,Biochemistry36,
16338 (1997).
32. L. Serre, E. C. Verbree, Z. Dauter, A. R. Stuitje, Z. S. Derewenda,J. Biol. Chem.270, 12961 (1995). 33. C. Oefner, H. Schulz, A. D'Arcy, G. E. Dale,Acta
Crystallogr. D Biol. Crystallogr.62, 613 (2006). 34. V. S. Rangan, S. Smith,J. Biol. Chem.272, 11975 (1997). 35. B. Persson, Y. Kallberg, U. Oppermann, H. Jornvall,
Chem. Biol. Interact.143-144, 271 (2003). 36. A. C. Price, Y. M. Zhang, C. O. Rock, S. W. White,
Structure12, 417 (2004).
37. D. A. Rozwarski, C. Vilcheze, M. Sugantino, R. Bittman, J. C. Sacchettini,J. Biol. Chem.274, 15582 (1999). 38. T. J. Sullivanet al.,Am. Chem. Soc. Chem. Biol.1, 43
(2006).
39. M. Leesong, B. S. Henderson, J. R. Gillig, J. M. Schwab, J. L. Smith,Structure4, 253 (1996).
40. M. S. Kimberet al.,J. Biol. Chem.279, 52593 (2004). 41. A. K. Joshi, S. Smith,J. Biol. Chem.268, 22508 (1993). 42. S. Pasta, A. Witkowski, A. K. Joshi, S. Smith,Chem. Biol.
14, 1377 (2007).
43. C. Baldock, J. B. Rafferty, A. R. Stuitje, A. R. Slabas, D. W. Rice,J. Mol. Biol.284, 1529 (1998). 44. R. J. Heath, N. Su, C. K. Murphy, C. O. Rock,J. Biol.
Chem.275, 40128 (2000).
45. R. P. Massengo-Tiasse, J. E. Cronan,J. Biol. Chem.283, 1308 (2008).
46. J. Saitoet al.,Protein Sci.17, 691 (2008).
47. E. Nordling, H. Jornvall, B. Persson,Eur. J. Biochem.269, 4267 (2002).
48. T. T. Airenneet al.,J. Mol. Biol.327, 47 (2003). 49. T. Horiet al.,J. Biol. Chem.279, 22615 (2004). 50. Y. Shimomura, Y. Kakuta, K. Fukuyama,J. Bacteriol.185,
4211 (2003).
51. D. A. Hopwood, D. H. Sherman,Annu. Rev. Genet.24, 37 (1990).
52. C. D. Richteret al.,FEBS J.274, 2196 (2007). 53. C. D. Richter, D. Nietlispach, R. W. Broadhurst, K. J. Weissman,Nat. Chem. Biol.4, 75 (2008).
54. K. J. Weissman,ChemBioChem7, 485 (2006). 55. R. N. Perham,Biochemistry30, 8501 (1991). 56. A. Roujeinikovaet al.,Structure10, 825 (2002). 57. A. Roujeinikovaet al.,J. Mol. Biol.365, 135 (2007). 58. G. A. Zornetzer, B. G. Fox, J. L. Markley,Biochemistry45,
5217 (2006).
59. S. Jones, J. M. Thornton,Proc. Natl. Acad. Sci. U.S.A.93, 13 (1996).
60. S. Smith, A. Witkowski, A. K. Joshi,Prog. Lipid Res.42, 289 (2003).
61. A. K. Joshi, V. S. Rangan, A. Witkowski, S. Smith,Chem. Biol.10, 169 (2003).
62. V. S. Rangan, A. K. Joshi, S. Smith,Biochemistry40, 10792 (2001).
63. All data were collected at the Swiss Light Source (SLS, Paul Scherrer Institute, Villigen). We thank C. Schulze-Briese, S. Gutmann, R. Bingel-Erlenmeyer, S. Russo, A. Pauluhn, and T. Tomizaki for their outstanding support at the SLS; S. Jenni and M. Sutter for critically reading the manuscript and all members of the Ban laboratory for suggestions and discussions; R. Grosse-Kunstleve, P. Afonine, and P. Adams for support with the PHENIX software; and A. Jones for support with the program O. This work was supported by the Swiss National Science Foundation (SNSF) and the National Center of Excellence in Research Structural Biology program of the SNSF. Structure factors and atomic coordinates of the porcine FAS in the apo- and NADP+-bound form have been deposited in the Protein
Data Bank with accession codes 2vz8 and 2vz9.
Supporting Online Material
www.sciencemag.org/cgi/content/full/321/5894/1315/DC1 Materials and Methods
Figs. S1 to S15 Tables S1 to S4 References
3 June 2008; accepted 31 July 2008 10.1126/science.1161269
Internally Generated Cell Assembly
Sequences in the Rat Hippocampus
Eva Pastalkova, Vladimir Itskov,*Asohan Amarasingham, György Buzsáki†
A long-standing conjecture in neuroscience is that aspects of cognition depend on the brain’s ability to self-generate sequential neuronal activity. We found that reliably and continually changing cell assemblies in the rat hippocampus appeared not only during spatial navigation but also in the absence of changing environmental or body-derived inputs. During the delay period of a memory task, each moment in time was characterized by the activity of a particular assembly of neurons. Identical initial conditions triggered a similar assembly sequence, whereas different conditions gave rise to different sequences, thereby predicting behavioral choices, including errors. Such sequences were not formed in control (nonmemory) tasks. We hypothesize that neuronal representations, evolved for encoding distance in spatial navigation, also support episodic recall and the planning of action sequences.
A
prominent theory states that the hippo-campal system primarily serves spatial navigation (1, 2); a component of this theory is that the place-dependent activity of neurons [place cells (1,2)] in the hippocampus arises from external serially ordered environ-mental stimuli (3–7). Place cells are thought to embody the representation of a cognitive map, enabling flexible navigation. However, neural theories of other cognitive processes that may depend on the hippocampus, such as episodicmemory and action planning, draw on the activ-ity of hypothetical internally organized cell as-semblies (8–13).
Center for Molecular and Behavioral Neuroscience, Rutgers, The State University of New Jersey, 197 University Avenue, Newark, NJ 07102, USA.
*Present address: Center for Neurobiology and Behavior, Columbia University, 1051 Riverside Drive, New York, NY 10032, USA.
†To whom correspondence should be addressed. E-mail: [email protected]
on September 5, 2008
www.sciencemag.org
Several observations have refined the navi-gation theory. Hippocampal neurons can predict where the animal is coming from, or its desti-nation (14–17); the sequential activity of place cells during locomotion is replicated within single cycles of the theta oscillation (8 to 12 Hz) (18–20); furthermore, the temporal recruitment of active neurons in the population bursts of rest and sleep also reflects, again on a faster time scale, their sequential activity as place cells during locomotion (21–23). Thus, the sequential activa-tion of hippocampal neurons can be disengaged from external landmarks (24,25). However, in-ternally generated assembly sequences
operat-ing at the time scale of behavior have not yet been reported.
The frameworks of environment-controlled versus internally generated assembly sequences give rise to distinct predictions. Imagine that a rat is frozen in position during its travel (and yet the theta oscillation is maintained). According to the navigation theory, a subset of landmark-controlled place cells should then display sustained activity, and other neurons would remain suppressed (2–6). In contrast, if assembly sequences were gener-ated by internal mechanisms, neurons might rather display continually changing activity. We tested these predictions by examining the activity
of hippocampal neurons while a rat was running in a wheel at a relatively constant speed (26,27) during the delay of a hippocampus-dependent alternation memory task.
[image:3.594.65.559.208.689.2]Internally generated cell-assembly sequences. Rats were trained to alternate between the left and right arms of a figure-eight maze [Fig. 1A and supporting online material (SOM) text]. During the delay period between maze runs (10 s for rat 1; 20 s each for rats 2 and 3), the animals were trained to run steadily in the same direction in a wheel (Fig. 1A). To confront the predictions of the navigation theory with those of the internal sequence-generation hypothesis, we compared
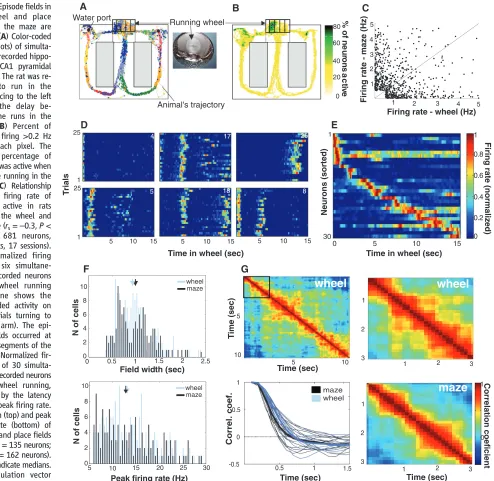
Fig. 1.Episode fields in the wheel and place fields in the maze are similar. (A) Color-coded spikes (dots) of simulta-neously recorded hippo-campal CA1 pyramidal neurons. The rat was re-quired to run in the wheel facing to the left during the delay be-tween the runs in the maze. (B) Percent of neurons firing >0.2 Hz within each pixel. The highest percentage of neurons was active when rats were running in the wheel. (C) Relationship between firing rate of neurons active in rats running the wheel and the maze (rs=–0.3,P<
0.0001, 681 neurons, three rats, 17 sessions). (D) Normalized firing rate of six simultane-ously recorded neurons during wheel running (each line shows the color-coded activity on single trials turning to the left arm). The epi-sode fields occurred at specific segments of the run. (E) Normalized fir-ing rate of 30 simulta-neously recorded neurons during wheel running, ordered by the latency of their peak firing rate. (F) Width (top) and peak firing rate (bottom) of episode and place fields (wheel,n= 135 neurons; maze,n= 162 neurons). Arrows indicate medians. (G) Population vector cross-correlation matrix
(SOM text). The width of the diagonal stripe indicates the rate at which neuronal assemblies transition. (Lower left) The decay of the population vector correlation during wheel running and maze traversal. Thin lines, individual sessions; thick lines, group means.
Running wheel
Animal's trajectory
A
Water port
B
80
0 40
20 60
%
nu
ro
n
a
tv
e
o
f
e
s
c
i
F
5 10 15 20 25 30 0
2 4 6 8 10
Peak firing rate (Hz)
N
of
cells
wheel maze 0 0.5 1 1.5 2 2.5 0
2 4 6 8 10
Field width (sec) wheel maze
N
of
cells
C
1 2 3 4 5 1
2 3 4 5
Firing rate - wheel (Hz)
in
rate
e
z
)
Fr
i
g
-m
a
z
(H
Time in wheel (sec) 5 10 15
D
1 25
1
1
25
5 10 15 5 10 1
4 17 26
8 18
5
s
T
rial
0 5 10 15
E
Time in wheel (sec)
30
1
0 0.2 0.4 0.6 0.8
u
(r
t)
Ne
rons
so
ed
F
ri
gr
a
e(
n
ol
z)
i
nt
rma
ie
d
wheel
maze
wheel
G0.5 1 1.5 -0.5
0 0.5 1
Corre
l.
coef.
maze wheel
Time (sec)
ae
i
i
C
o
rre
l
tio
nc
of
c
e
nt
Time (sec) Time (sec)
ime
sec
T
()
1
2
3
1
2
3 5
10
5 10
1 2 3
1
0
1 2 3
5
on September 5, 2008
www.sciencemag.org
the firing patterns of CA1 hippocampal neurons in rats running the wheel and the maze.
We analyzed the activity of ~500 pyramidal cells recorded in the wheel and ~600 neurons in the maze (mean firing rate >0.5 Hz) (Fig. 1A). Pyramidal neurons were transiently active in rats running both the maze [place cells (1)] and the wheel. Although the position and direction of the rat’s head were stationary during wheel running (fig. S1), the percentage of neurons active in the pixels occupied by the head during wheel run-ning was three to four times greater than in any area of comparable size in the maze (Wilcoxon rank sum test,P< 0.0001) (Fig. 1B). Thus, if pyramidal neurons were solely activated by environmental cues (2–6), this finding would reflect several-fold–stronger neuronal representa-tion of the animal’s posirepresenta-tion within the wheel. Many individual pyramidal cells were active both in rats running the wheel and rats running the maze, but the sequential order of their activation in rats in the wheel was unrelated to that of rats in the maze, and their firing rates in these two areas were inversely correlated [Spearman corre-lation coefficient (rs) =–0.3,P< 0.0001,n= 681
neurons (Figs. 1C and 4B); contrast this with the population of interneurons,rs= 0.85,P< 0.0001,
n = 125 interneurons (fig. S2)]. The average proportion of pyramidal neurons simultaneously
active [firing at least a single spike in 100-ms windows (averaging over 100-ms windows)] was similar in the wheel (10.75 T3.97%) and the maze (12.56T4.32%) (fig. S3).
Pyramidal neurons typically fired transiently, and reliably in successive trials, at specific times of wheel running (episode fields), and most cells had multiple peaks of varying sizes (Fig. 1D). Typically, and reminiscent of a synfire chain (11), at least one episode cell was active at every moment of a wheel run (Fig. 1E).
Were episode cells in rats in the wheel generated by the same mechanism as place cells in rats in the maze? We looked for evidence of differing mechanisms by comparing several mea-sures of the firing of episode and place cells. First, we calculated the duration of activity (field width) (Fig. 1F) of single cells [including only fields with a peak firing rate of≥6.0 Hz and≥4.5 SD above the mean firing rate (SOM text)]. The temporal and spatial extent of the field was determined as those times and positions at which firing rates were at least 10% that of the peak firing rate (in the wheel or maze) (19, 28). By these criteria, 32% of the neurons recorded in the wheel and 22% in the maze had at least one field. Neither the distribution of field widths (medians were 0.94 and 1.0 s, respectively; Wilcoxon test, P= 0.44) nor peak firing rates (medians were
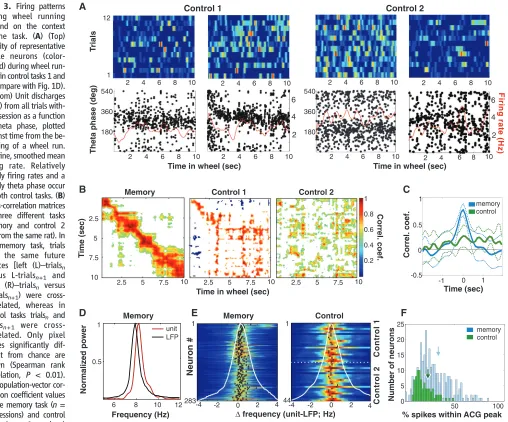
[image:4.594.104.557.359.669.2]13.08 and 12.8 Hz, respectively; P = 0.61) differed significantly between the episode and place fields (Fig. 1F). Second, to measure the average lifetime of assembly activity for a pop-ulation, we determined the maximal time lag at which the autocorrelation of the population’s ac-tivity was above 0.5 (29) and again found no significant difference, with respect to the median, between the populations of episode and place cells (medians were 0.83 and 0.75 s, respectively; P= 0.32) (Fig. 1G). Third, we compared the relationship between spikes and the local field potential in episode and place cells. On linear tracks, sequentially generated spikes of a place cell gradually shift to earlier and earlier phases of the theta oscillation as the rat passes through the place field (phase precession), and there is a sys-tematic relationship between the phase of spikes and the animal’s position (3,18–20,28,30,31). The navigation theory predicts that the phase of spikes will remain fixed if environmental inputs do not change (3, 26,27). In contrast, episode cells displayed phase precession during wheel running (Fig. 2A). Similarly to place cells, the theta frequency oscillation of episode cells was higher than that of the field theta rhythm (Fig. 2B), and the slope of the phase precession was inversely related to the length of the episode field (Fig. 2, A and D) (3,19,20,28,30,31).
Fig. 2.Episode neurons in the wheel display theta phase precession and temporal compres-sion. (A) (Top) Unfiltered (light gray) and filtered (4 to 10 Hz) (dark gray) traces of LFP and phase advancement of action potentials (dots). (Bottom) Activity of six example neurons from the same session. Each dot is an action potential, displayed as a function of theta phase and time from the beginning of wheel run-ning from all trials. One and a half theta cycles are shown (yaxis). Red line, smoothed firing rate. (B) Power spectra of spike trains generated during wheel running (n= 283 pyramidal neu-rons) and the simulta-neously recorded LFP. Faster oscillation of neu-rons occurs relative to LFP. (C) Slope of theta phase precession within episode fields in the
wheel and within place fields in the maze. (D) Relationship between phase precession slope and episode length (left,rs= 0.46,P< 0.0001) and
episode field width (right, rs= 0.52, P< 0.0001), respectively. (E)
Temporal compression of spikes sequences. Correlation of the distance
between the peaks of episode fields of neuron pairs in the wheel with the temporal offset of the pair's cross-correlogram peaks is shown. Each dot represents a neuron pair (n= 105 eligible pairs; three rats;rs=
0.59;P< 0.0001). -1200
-800 -400 0
1 2 3
6 8 10 12
0.4 0.8
N
o
rm
al
iz
ed pow
e
r
-50 -25 0 25 50
∆ distance (m)
∆
ti
m
e
(m
s
e
c
)
Frequency (Hz)
units LFP
Slope (deg/sec)
1 2 3
-1200 -800 -400 0
Episode field width (m)
S
lope
(d
e
g
/m)
A B
D E
C
Time (sec)
ir
g
e
(
)
a
t
F
in
r
Hz
4 8 1212
4 8
5 10 15 0
180 360 540
5 10 15 5 10 15
Thet
a phase
(d
e
g
)
0 180 360
540 ir
g
e
(
)
at
F
in
r
H
z
20
10
12
6
Episode field width (sec) -0.5 -0.25 0 0.25 0.5
4 8 12
Nu
m
b
e
r
o
f
c
e
ll
s
Slope (deg/sec)
wheel maze
-0.5 0
-1
200 msec 360
180 0
on September 5, 2008
www.sciencemag.org
Furthermore, the slopes correlated more strongly with the length of the episode field (rs= 0.52,P<
0.0001) than with the time it took the rat to run through the same field (rs= 0.46,P< 0.0001)
(Figs. 2D and 3) because of the variability of the rat’s running speed (28). The distributions of phase precession slopes for the episode and place fields were also similar (medians were–0.6°/s and –0.6°/s, respectively;P = 0.6) (Fig. 2C). Finally, we compared the spike timing relation-ships among neurons. During maze traversals, the distance between the place-field peaks of a neuronal pair was correlated with the temporal offset between its spikes within the theta cycle, a phenomenon known as distance-time
compres-sion (SOM text) (18, 19). Analogously, the distance between peaks of the episode fields of neuron pairs (episode fields with peak firing rate >5 Hz and >3 SD above the mean firing rate were included in this analysis; n= 105 pairs) was correlated with the temporal offsets between the spikes at the theta time scale (rs = 0.59, P <
0.0001) (Fig. 2E). These findings indicate that the mechanisms generating place and episode fields are similar.
Body cues are not sufficient to generate
assembly sequences.It has been suggested that
in addition to generating a cognitive map of the environment (2), the hippocampus and its asso-ciated structures integrate self-motion–induced
[image:5.594.52.560.208.630.2]information (7, 32, 33). Were the episode cell sequences generated by idiothetic self-motion cues? We examined population firing patterns in two control (nonmemory) tasks. In the first task (control 1), the animals (rats 3 and 4) were required to run in the wheel for a water reward available in an adjacent box (26). In the second task (control 2), the animals (rats 2 and 3) had continuous access to a wheel adjacent to their home cage, and recordings were made during spontaneous wheel-running episodes. Transient firing patterns, consistent across trials, were rarely observed during the control tasks. Rather, the majority of active neurons exhibited relative-ly sustained firing throughout the wheel-running
Fig. 3. Firing patterns during wheel running depend on the context of the task. (A) (Top) Activity of representative single neurons (color-coded) during wheel run-ning in control tasks 1 and 2 (compare with Fig. 1D). (Bottom) Unit discharges (dots) from all trials with-in a session as a function of theta phase, plotted against time from the be-ginning of a wheel run. Red line, smoothed mean firing rate. Relatively steady firing rates and a steady theta phase occur in both control tasks. (B) Cross-correlation matrices in three different tasks (memory and control 2 are from the same rat). In the memory task, trials with the same future choices [left (L)–trialsn versus L-trialsn+1 and
right (R)–trialsn versus R-trialsn+1) were
cross-correlated, whereas in control tasks trialsn and trialsn+1 were
cross-correlated. Only pixel values significantly dif-ferent from chance are shown (Spearman rank correlation, P < 0.01). (C) Population-vector cor-relation coefficient values in the memory task (n= 17 sessions) and control tasks (n = 8 sessions)
(meanTSD). (D) Power spectrum of spike trains of an episode neuron (unit) and simultaneously recorded LFP during wheel running in the memory task (30). The frequency of unit firing oscillation is higher than the frequency of LFP. (E) Difference between unit and LFP oscillation frequency in the memory (left) and control (right) tasks. Each line is a color-coded normalized cross-correlogram between power spectra of a pyramidal neuron and simultaneously recorded LFP. A shift of the maximal correlation values to the right indicates that unit theta oscillation is faster than LFP theta oscillation
(black dots, maxima of the cross-correlograms; white line, sum of all neurons). There is a significant frequency shift in the memory task (0.44T 0.6 Hz) and a lack of frequency shift in control tasks (combined control 1 and 2, 0.07T0.3 Hz). (F) Ratio of spikes in the center and tail of temporal auto-correlograms (SOM text). High values indicate compact episode fields; low values indicate spikes scattered throughout the time of wheel running (memory task,n= 287 neurons; control tasks,n= 85 neurons; rank sum test,
P< 0.0001). Arrows indicate medians. 6 8 10 12
0.5 1
0.2 0.4 0.6 0.8 1
2.5
5
7.5
10
Control 2 Control 1
Memory
-0.5 0 0.5 1
memory control
B C
D
50 100
0 5 10 15 20 25
C
ont
rol
2C
o
nt
ro
l
1
Control Memory
283 44
1 1
N
euron
#
LFP
Memory E F
memory control
Control 2
2 4 6
10 2 4 6 8
10 2 4 6 8 180
360 540
10 2 4 6 8
10 2 4 6 8
A
12
1
Control 1
10 2 4 6 8
10 2 4 6 8 180
360 540
2 4 6 8 10 10
2 4 6 8
2 4 6
e
)
ir
g
a
(
F
n
r
t
i
H
z
2.5 5 7.5 10 2.5 5 7.5 10 2.5 5 7.5 10 -1 0 1
unit
0 2
-4 -2 4 -4 -2 0 2 4
∆ frequency (unit-LFP; Hz) % spikes within ACG peak Time in wheel (sec)
Time in wheel (sec)
Theta phase (deg)
T
rials
Time in wheel (sec)
Time (sec)
Correl. coef.
Correl. coef.
T
ime (sec)
Frequency (Hz)
Normalized power
Number of neurons
on September 5, 2008
www.sciencemag.org
periods (Fig. 3A and fig. S4) (5,26–27). During runs of opposite direction in the wheel, different populations of neurons were active (fig. S5) (26), arguing for the importance of distant cues (2,20) and against a critical role of idiothetic inputs (26). In addition, the temporal organiza-tion of cell assemblies in control tasks was less precise, as reflected by much weaker correla-tions between temporally adjacent populacorrela-tions during the control tasks than during the memory task (Fig. 3, B and C), despite the similarity in firing rates during all tasks (fig. S6). As another contrast to the memory task, neurons recorded during the control tasks fired throughout the trial, with spikes locked to a similar phase of the theta cycle (Fig. 3A). Consistent with these observations, neurons in the rats performing the memory task oscillated faster than the local field potential (LFP) [difference (∆) = 0.44T0.6 Hz] (Figs. 2B and 3, D and E), an indication of phase precession (19,20,29,30), whereas dur-ing the control tasks, the power spectra of the units and LFP were similar (∆= 0.07T0.3 Hz) (Fig. 3E). Finally, to quantify differences in temporal clustering of spikes, we examined an autocorrelogram of each neuron. We applied (after filtering, 0.2 to 2 Hz) the same definition for the peak region boundaries that we used for the episode field detection boundary of the epi-sode field (the 10% boundary) and then com-pared, for each neuron, the ratio of the number of spikes that fell within the peak region bound-ary to those that fell outside. These ratios were significantly larger during the memory task and reflected the temporal compactness of firing during the memory task as opposed to the con-trol tasks (Fig. 3F). Thus, the indicators of tem-porally precise sequential activity in neuronal populations were absent during the control tasks, despite indistinguishable motor character-istics across all tasks.
Assembly sequences depend on memory
load. What is the behavioral function of
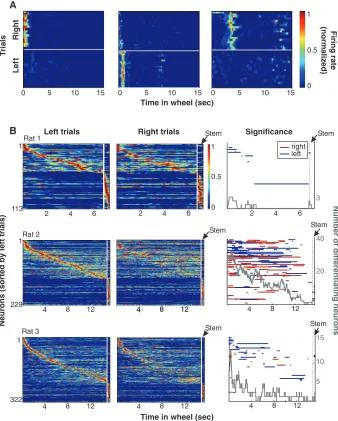
in-ternally generated cell-assembly sequences? Temporarily inactivating neuronal circuits in the dorsal hippocampus, we found that performance in the delayed alternation task depends on the integrity of the hippocampus (fig. S7) (17). Thus, we hypothesized that information about choice behavior is reflected in assembly sequences (34). All correctly performed trials were sorted accord-ing to the rat’s future choice of arm (left or right), and choice-specific firing effects were identified by comparing the firing patterns of single neu-rons with those of surrogate spike trains created by shuffling the left and right labels (Fig. 4, A and B, and SOM text) (34). Some neurons were active exclusively before either the left or right choice, whereas others showed differential firing rates and/or fired at different times after the beginning of wheel running (Fig. 4A, figs. S8 to S10, and movie S1). The largest proportion of neurons exhibiting choice-predictive activity was at the beginning of the run; this proportion de-creased as a function of time during the delay and
in the stem of the maze (Fig. 4B), suggesting a critical role for initial conditions in specifying the sequences (fig. S11). In addition, we designed a probabilistic model of the relationship between neuronal firing patterns and the animal’s choices (SOM text). Using this model, the accuracy of single-trial prediction, under cross-validation, varied from low (near 50%) and not significant to 100% and significant across many sessions (fig. S9).
Because the rat was performing an alternation task, past and future choices were deterministi-cally related on correctly performed trials, and it
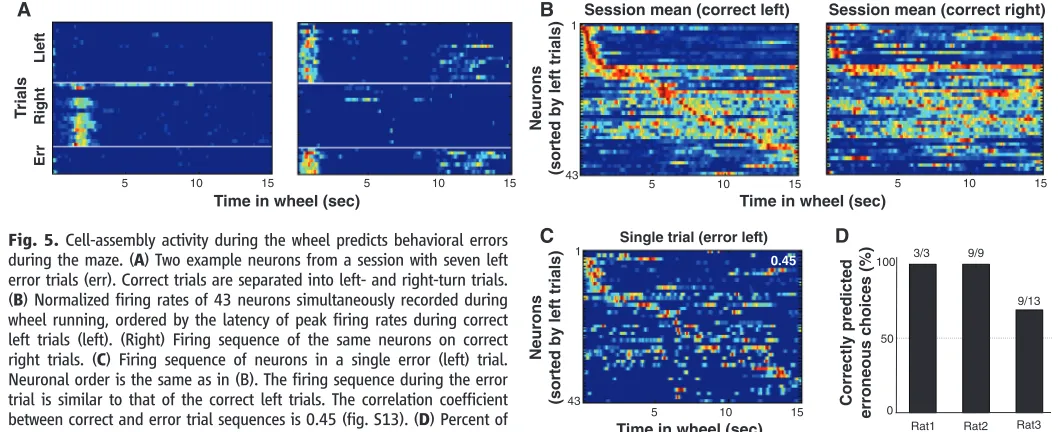
was not possible to disambiguate their influence on neuronal activity. To distinguish such retro-spective and proretro-spective factors (14–17), we examined cell-assembly sequences during error trials. Neurons that reliably predicted the behav-ioral choice of the rat on correct trials continued to predict the choice behavior on error trials (Fig. 5A, fig. S12, and movie S1) (15,24). Similarly, population sequences that differentiated correct behavioral choices continued to predict behav-ioral choice errors (Fig. 5, B and C, and fig. S13). Although there were only a few error trials, a majority of them could be predicted from the A
0 5 10 15
0 5 10 15
5 10 15
0 0
1
0.5
Number of differentiating neurons
Rat 1
Rat 2
Rat 3 2
20 40 3
15
10
Stem
Stem 113
1
1
229
322 1
B
5
Stem
0 1
0.5
right left
Stem Stem
4 6 2 4 6 2 4 6
4 8 12
4 8 12
4 8 12
4 8 12 4 8 12
4 8 12
4 8 12
Stem
Time in wheel (sec) Time in wheel (sec)
Left trials
Lef
t Right
Right trials Significance
T
rials
Firing rate
(normalized)
[image:6.594.217.555.39.460.2]Neurons (sorted by left trials)
Fig. 4.Cell-assembly activity in the wheel predicts the future choice of the rat in the maze. (A) Examples of three neurons that strongly differentiated between wheel-running trials preceding right and left choices (fig. S7 and movie S1). (B) Normalized firing rate profiles of neurons during wheel running and in the stem of the maze, ordered by the latency of their peak firing rates during left trials (each line is a single cell; cells are combined from all sessions). White line, time gap between the end of wheel running and the initiation of maze stem traversal. (Middle) Normalized firing rates of the same neurons during right trials. (Right) Time periods of significant differences (P< 0.05) in firing rates between left and right trials for respective neurons (red line, R > L; blue line, L > R). Gray line, number of neurons discriminating between left and right trials as a function of wheel-running time.
on September 5, 2008
www.sciencemag.org
firing patterns of neurons during wheel running (Fig. 5D). Altogether, these observations demon-strate that a particular sequence of neurons was activated in a reliable temporal order from the moment the rat entered the wheel to the time it reached the reward.
Because running speed, head position, and head direction during wheel running before left and right choices were apparently indistinguishable (fig. S1), the above findings indicate that trial differences in hippocampal assembly configurations cannot solely arise from instantaneous environmental inputs or the integration of motion signals.
Behavioral function of internally
gener-ated cell-assembly sequences.These findings
demonstrate that the rat brain can generate con-tinually changing assembly sequences. The pat-terns of the self-evolving neuronal assembly sequences depend on the initial conditions, and the particular sequences of cell assemblies are predictive of behavioral outcome.
Our results offer new insights into the rela-tionship between hippocampal activity and navigation (2–7,14–20,26–30,33). Hippocam-pal firing patterns during maze navigation were similar to those during wheel running in the delayed alternation memory task with stationary environmental and body cues. Therefore, we suggest that hippocampal networks can produce sequential firing patterns in two possibly interact-ing ways: under the influence of environmental/ idiothetic cues or by self-organized internal mech-anisms. The high-dimensional and largely ran-dom (nontopographical) connectivity of the CA3 axonal system (35) and its inputs makes the hippocampus an ideal candidate for internal se-quence generation (13,33,36,37). The parame-ters of cell-assembly dynamics (including their trajectory and lifetimes) are probably affected by a number of factors, including experience-dependent and short-term synaptic plasticity (34,38); asymmetric inhibition (39); brain state;
and, fundamentally, the character and context of the input. The evolving trajectory can be ef-fectively perturbed, or updated, by external inputs in every theta cycle (40). Because of this flexibility in the sources of cell-assembly control, we hypothesize that neuronal algorithms, having evolved for the computation of distances, can also support the episodic recall of events and the planning of action sequences and goals (19). During learning, the temporal order of external events is instrumental in specifying and securing the appropriate neuronal representations, whereas during recall, imagination (35), or action plan-ning, the sequence identity is determined by the intrinsic dynamics of the network.
References and Notes
1. J. O’Keefe, J. Dostrovsky,Brain Res.34, 171 (1971). 2. J. O’Keefe, L. Nadel,The Hippocampus as a Cognitive
Map(Clarendon, Oxford, UK, 1978).
3. J. Huxter, N. Burgess, J. O’Keefe.Nature425, 828 (2003). 4. B. L. McNaughton, C. A. Barnes, J. O’Keefe,Exp. Brain
Res.52, 41 (1983).
5. J. O'Keefe, N. Burgess,Nature381, 425 (1996). 6. R. U. Muller, J. L. Kubie, J. B. Ranck Jr.,J. Neurosci.7,
1935 (1987).
7. B. L. McNaughtonet al.,J. Exp. Biol.199, 173 (1996). 8. D. O. Hebb,The Organization of Behavior:
A Neuropsychological Theory(Wiley, New York, 1949). 9. E. Tulving,Elements of Episodic Memory(Clarendon,
Oxford, UK, 1983).
10. L. R. Squire,Psychol. Rev.99, 195 (1992).
11. M. Abeles,Corticotronics: Neural Circuits of the Cerebral Cortex, (Cambridge Univ. Press, New York, 1991). 12. M. W. Howard, M. S. Fotedar, A. V. Datey,
M. E. Hasselmo,Psychol. Rev.112, 75 (2005). 13. W. B. Levy, A. B. Hocking, X. Wu,Neural Netw.18, 1242
(2005).
14. L. M. Frank, E. N. Brown, M. Wilson,Neuron27, 169 (2000).
15. J. Ferbinteanu, M. L. Shapiro,Neuron40, 1227 (2003). 16. E. R. Wood, P. A. Dudchenko, R. J. Robitsek,
H. Eichenbaum,Neuron27, 623 (2000). 17. J. A. Ainge, M. A. van der Meer, R. F. Langston,
E. R. Wood,Hippocampus17, 988 (2007). 18. W. E. Skaggs, B. L. McNaughton, M. A. Wilson,
C. A. Barnes,Hippocampus6, 149 (1996). 19. G. Dragoi, G. Buzsáki,Neuron50, 145 (2006).
20. J. R. Huxter, T. J. Senior, K. Allen, J. Csicsvari,Nat. Neurosci.11, 587 (2008).
21. G. Buzsáki,Neuroscience31, 551 (1989).
22. M. A. Wilson, B. L. McNaughton,Science265, 676 (1994). 23. K. Louie, M. A. Wilson,Neuron29, 145 (2001). 24. S. A. Deadwyler, T. Bunn, R. E. Hampson,J. Neurosci.16,
354 (1996).
25. H. Eichenbaum, P. Dudchenko, E. Wood, M. Shapiro, H. Tanila,Neuron23, 209 (1999).
26. A. Czurko, H. Hirase, J. Csicsvari, G. Buzsáki,Eur. J. Neurosci.11, 344 (1999).
27. H. Hirase, A. Czurko, J. Csicsvari, G. Buzsáki,Eur. J. Neurosci.11, 4373 (1999).
28. C. Geisler, D. Robbe, M. Zugaro, A. Sirota, G. Buzsáki,
Proc. Natl. Acad. Sci. U.S.A.104, 8149 (2007). 29. K. M. Gothard, W. E. Skaggs, B. L. McNaughton,J.
Neurosci.16, 8027 (1996).
30. J. O’Keefe, M. L. Recce,Hippocampus3, 317 (1993). 31. A. P. Maurer, S. L. Cowen, S. N. Burke, C. A. Barnes,
B. L. McNaughton,J. Neurosci.26, 13485 (2006). 32. F. Sargoliniet al.,Science312, 758 (2006). 33. B. L. McNaughton, F. P. Battaglia, O. Jensen, E. I. Moser,
M. B. Moser,Nat. Rev. Neurosci.7, 663 (2006). 34. S. Fujisawa, A. Amarasingham, M. T. Harrison,
G. Buzsáki,Nat. Neurosci.11, 823 (2008). 35. X. G. Li, P. Somogyi, A. Ylinen, G. Buzsáki,J. Comp.
Neurol.339, 181 (1994).
36. G. Kreiman, C. Koch, I. Fried,Nature408, 357 (2000). 37. J. E. Lisman,Neuron22, 233 (1999).
38. L. F. Abbott, W. G. Regehr,Nature431, 796 (2004). 39. M. Rabinovich, R. Huerta, G. Laurent,Science321, 48
(2008).
40. M. B. Zugaro, L. Monconduit, G. Buzsáki,Nat. Neurosci.
8, 67 (2005).
41. We thank H. Hirase for sharing his data and C. Curto, C. Geisler, S. Ozen, S. Fujisawa, K. Mizuseki, A. Sirota, D. W. Sullivan, and R. L. Wright for comments. Supported by NIH (NS34994 and MH54671), NSF (SBE 0542013), the James S. McDonnell Foundation, NSF (A.A.), the Swartz Foundation (V.I.), and the Robert Leet and Clara Guthrie Patterson Trust (E.P.).
Supporting Online Material
www.sciencemag.org/cgi/content/full/321/5894/1322/DC1 SOM Text
Figs. S1 to S13 Table S1 Movie S1 References
29 April 2008; accepted 29 July 2008 10.1126/science.1159775
B
Single trial (error left)
Rat1 Rat2 0
50 100
Rat3
C
Err
Right Llef
t
5 10 15
A
1
43
D
3/3 9/9
9/13 1
43
5 10 15 5 10 15 5 10 15
5 10 15
0.45
Time in wheel (sec) Time in wheel (sec)
Session mean (correct left) Session mean (correct right)
Time in wheel (sec)
T
rials
Neurons
(sorted by left trials)
Neurons
(sorted by left trials) Correctly predicted
[image:7.594.32.561.41.257.2]erroneous choices (%)
Fig. 5.Cell-assembly activity during the wheel predicts behavioral errors during the maze. (A) Two example neurons from a session with seven left error trials (err). Correct trials are separated into left- and right-turn trials. (B) Normalized firing rates of 43 neurons simultaneously recorded during wheel running, ordered by the latency of peak firing rates during correct left trials (left). (Right) Firing sequence of the same neurons on correct right trials. (C) Firing sequence of neurons in a single error (left) trial. Neuronal order is the same as in (B). The firing sequence during the error trial is similar to that of the correct left trials. The correlation coefficient between correct and error trial sequences is 0.45 (fig. S13). (D) Percent of correctly predicted errors from the neuronal population activity.