Simulation of an Emergency Situation for the Purpose of Evaluating a Crowd-Based Rescue System
Svenja Polst (s1228765)
Faculty of Behavioural, Management, and Social Sciences, University of Twente,
Enschede, the Netherlands
ln partial fulfillment of the master’s thesis requirements Primary supervisor: Prof. dr. Jan Maarten Schraagen
Secondary supervisor: Dr. Martin Schmettow External supervisor: Eduard C. Groen
2 Acknowledgement
I like to thank Jan Maarten Schraagen, Martin Schmettow, and Eddy Groen for your supervision, the feedback and your time you put in reading the different versions of the thesis.
Furthermore, I like to thank Fraunhofer IESE for offering the opportunity to write my thesis there and the project leaders of RESCUER, Karina Villela and Claudia Nass, for their support.
3 Abstract
4 Contents
Acknowledgement ... 2
Abstract ... 3
Contents ... 4
Glossary ... 6
1. Introduction ... 7
1.1. Use Context of a Crowd-Based Rescue App ... 9
1.2. Stress ... 9
1.2.1. Stressors ... 11
1.2.2. Stress measures ... 14
1.3. Moderator Variables ... 16
1.4. Creating the Simulation ... 16
1.4.1. Creating the use context for the RESCUER App. ... 17
1.4.2. Stressors for the simulation ... 18
1.4.3. Issues to take into consideration ... 18
1.4.4. Pilot study ... 19
1.5. Research Question and Hypotheses... 19
2. Method ... 20
2.1. Participants ... 20
2.2. Materials ... 21
2.3. Scenario and Task ... 21
2.4. Stress Manipulation ... 22
2.5. Procedure ... 23
2.6. Measures ... 24
2.7. Data analysis... 25
3. Results ... 25
3.1. Cortisol measures ... 25
3.2. Subjective Ratings ... 27
5
3.4. Other data ... 31
4. Discussion ... 32
4.1. Discussion of the Results ... 32
4.1.1. Subjective ratings. ... 32
4.1.2. Cortisol. ... 33
4.1.3. Other data ... 34
4.1.4. Stressors ... 34
4.2. Limitations... 35
4.3. Future Research ... 36
5. Conclusion ... 39
References ... 40
Appendix A. Laboratory Stress Protocols ... 46
Appendix B. g*-Analysis ... 49
Appendix C. Protocol of the Experiment ... 50
Appendix D. Informed Consent ... 59
Appendix E. Ethical Requirements ... 61
Appendix F. Presentation about the Experiment ... 63
Appendix G. Questionnaires ... 65
Appendix H. Example Slides of the Presentation about an Explosion ... 104
Appendix I. Text in Scenario ... 107
Appendix J. Instructions for Assistants including Maps of the Location ... 111
Appendix K. Photos on Posters ... 115
Appendix L. Powerpoint Presentation of Results with regard to the RESCUER App ... 117
Appendix M. Result Tables ... 127
Appendix N. Testing of Assumptions ... 133
6 Glossary
The definition of crowd is derived from http://www.oxforddictionaries.com. The definitions of emergency, eyewitness and incident are copied from Nass et al., 2015.
Crowd: a) A large number of people gathered together in a disorganized or unruly way b) An audience, especially one at a sporting event
Emergency: An event or situation which threatens to impose serious damage to human welfare (e.g., loss of human life, illness, injury, homelessness, damage of property, disruption of a supply of money, food, water, systems of communication, facilities for transport, or services relating to health) or the environment (e.g., contamination of land, water or air with biological, chemical or radioactive matter, or disruption or destruction of plant life or animal life).
Eyewitnesses: People at the place of the incident that caused the emergency situation.
Incident: Can cause damages to life and property and seriously affect the image of a business and/or a country. The concept of incident as defined here includes the concept of accident.
RESCUER App: An app that is developed in the scope of the RESCUER Project. The app has the objective that a crowd can efficiently provide the command centre of rescue services with information about an incident.
Abbreviations
7 1. Introduction
Current rescue systems do not provide all the functions required to organize a large-scale rescue operation. The functions meant here are alternative communication channels in case the mobile network is overloaded, integration of the communication systems used by police officers, fire-fighters, and other rescue workers and integration of information given by a crowd. A consortium of companies and research institutions from the European Union and Brazil was formed to build a rescue system that integrates the aforementioned functions. The rescue system is built in a project partially funded by the European Union called ‘Reliable and smart crowdsourcing solution for emergency and crisis management’, abbreviated with the acronym RESCUER (Nass et al., 2015). Its mission statement is “The RESCUER project aims at developing a smart and interoperable computer-based solution for supporting emergency and crisis management, with a special focus on incidents in industrial areas
and on large-scale events.” (RESCUER, 2016).
Within the project, the RESCUER App was developed, which enables the crowd to send information about an incident directly to the command centre. The design of the app takes into consideration that stress, which is evoked by an emergency situation, impairs cognitive processes (Nass et al., 2015). Three screens for interaction with the command centre were designed that differ in their cognitive demand (see figure 1). The first screen is meant to be used close by the incident and the third one when the user is in a safe place. To ensure an effective use of the app, it has to be evaluated in an emergency situation or a simulation of such a situation. So far, the app had been evaluated twice, once by attendees of an event in soccer stadiums and by people in industrial parks, but without inducing stress, (Nakagawa, Soares Santos, Bueno Ruas de Oliveira, & Duran, 2015) and the second time in a laboratory setting with a stress manipulation (Nass et al., 2015). Stress was induced by an auditory n-back task (Nass et al., 2015). In both evaluations, the participants had to complete some pre-defined tasks, such as ‘Describe the properties of the fire’ while standing or sitting still, thus, without simulating flight behaviour. Flight behaviour should be simulated since it could impair the app use (Delignières, Brisswalter, & Legros, 1994). Stress has to be induced since it affects several stages of information processing (Duncko, Johnson, Merikangas, & Grillon, 2009; Ozel, 2001). A third evaluation needs to be conducted which simulates the use context, an emergency situation, as realistically as possible. Without another evaluation an effective use of the app in a real emergency is not ensured. Users may not be able to use the app under stress, resulting in providing wrong information or no information at all.
8 proposals do not take stress into consideration (Streefkerk, 2011). Therefore, we created a simulation of an emergency situation ourselves that is applicable for evaluating a crowd-based rescue system, like the RESUCER App. The simulation consists of a selection of stressors and the creation of the use context. The suitability of the simulation was tested by evaluating the RESCUER App. Therefore, we will subsequently describe the context of an emergency in which a crowd is involved since the context defines the requirements for the simulation. Thereafter, stress, stressors, ways of measuring, and moderator variables will be described so that the reader may be able to reconstruct our decisions concerning the simulation. The simulation of an emergency situation is subsequently described. The simulation of the use context could be adapted to the rescue system. In this study, it is adapted to the evaluation of the RESCUER App.
Figure 1. Illustration of the screens of the RESCUER App and their order for reporting an explosion. At the One-click interaction Screen, the user can send information about the emergency type with a single click. The confirmation screen informs about the information sent. The Guided-Interaction Screeen asks more specific questions about the reported emergency type. The user can directly continue to the chat screen or send the answers to the questions. After sending, another confirmation screen appears. The Chat Screen allows the user to send text messages to the command centre of the rescue services. The last screen confirms the sending of information through the chat screen.
One-click Interaction Screen
1st Confirmation
Screen Guided-Interaction Screen
2nd Confirmation Screen
9 1.1. Use Context of a Crowd-Based Rescue App
A crowd is a large group of people who gather, for instance, at public places, at large-scale events or in industrial parks. The crowd could consist of people from various cultures. Crowd-based rescue apps are likely to be used in an emergency by eyewitnesses and first responders. In case of an emergency, those people have to cover quite a distance to reach a safe area. They show flight behaviour, which is reflected probably in walking fast or even running. However, there might be emergencies that do not require that people run or walk fast. On the way to safety, people pass through a maximum of three zones depending on where they are respectively the incident. The zones are called the hot zone, warm zone, and cold zone. In the hot zone, individuals are close to the incident. The most cognitive resources are needed to flee from the incident (Nass et al., 2015). In the warm zone, individuals have already made some physical and timely distance from the incident thus, the immediate danger is lower and fewer cognitive resources are demanded for fleeing and the experienced stress is lower (Nass et al., 2015). Cold zone means the individuals left the area at risk and are able to calm down. Thus, the available cognitive resources and experienced stress of the zones differs. On the way to the cold zone, it is likely that people enter unknown (event) areas or unfamiliar parts of an industrial park. In all areas, individuals probably come across environmental cues about the incident, such as fire, smoke, damaged objects, and injured persons. Not everyone in the crowd would use an emergency app, since it requires owning a smartphone, which is charged sufficiently, and the belief in the benefits of the app. The requirements for the simulation are summarized in table 1.
1.2. Stress
Three common stress approaches, the stimulus-based, the response-based, and the transactional stress approach, are introduced to help the reader understand topics that are discussed later on.
The stimulus-based stress approach emphasises that a stimulus that causes psychological distress or physiological impairment or deterioration is a stressor (Hobfoll, 1989). A stressor can be a condition such as heat or noise (Sanders, 1983). The human reaction to these stressors is called stress. Stressors can be categorized as acute and time-limited, such as a visit to a dentist, stressor sequences such as losing a job, chronic and intermittent stressors such as writing exams or chronic stressors such as chronic illnesses (Hobfoll, 1989, based on Elliot and Eisdorfer, 1982). An emergency situation is an acute and time-limited stressor. The stimulus-based approach is criticized for not taking individual differences into consideration (Hobfoll, 1989).
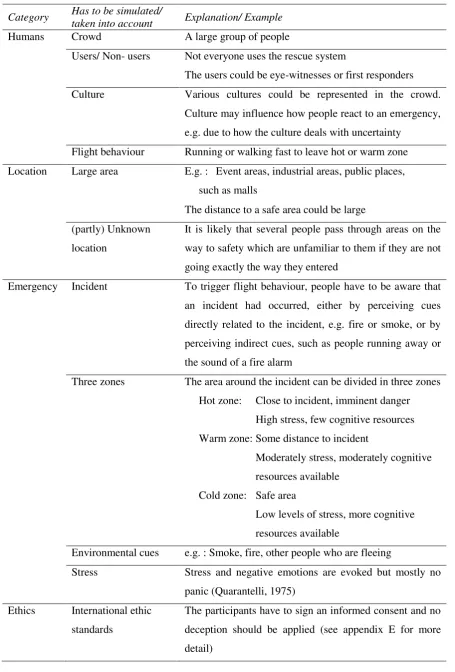
10 Table 1
Overview of the Requirements for the Simulation of the Use Context of a Crowd-Based Rescue System
Category Has to be simulated/ taken into account Explanation/ Example
Humans Crowd A large group of people
Users/ Non- users Not everyone uses the rescue system
The users could be eye-witnesses or first responders Culture Various cultures could be represented in the crowd.
Culture may influence how people react to an emergency, e.g. due to how the culture deals with uncertainty
Flight behaviour Running or walking fast to leave hot or warm zone Location Large area E.g. : Event areas, industrial areas, public places,
such as malls
The distance to a safe area could be large (partly) Unknown
location
It is likely that several people pass through areas on the way to safety which are unfamiliar to them if they are not going exactly the way they entered
Emergency Incident To trigger flight behaviour, people have to be aware that an incident had occurred, either by perceiving cues directly related to the incident, e.g. fire or smoke, or by perceiving indirect cues, such as people running away or the sound of a fire alarm
Three zones The area around the incident can be divided in three zones Hot zone: Close to incident, imminent danger High stress, few cognitive resources Warm zone: Some distance to incident
Moderately stress, moderately cognitive resources available
Cold zone: Safe area
Low levels of stress, more cognitive resources available
Environmental cues e.g. : Smoke, fire, other people who are fleeing
Stress Stress and negative emotions are evoked but mostly no panic (Quarantelli, 1975)
Ethics International ethic standards
11 At the second stage, resistance, the activity of the sympathetic nervous system declines but the Hypothalamus-Pituitary-Adrenal (HPA) Cortex axis is activated. The HPA axis initiates the production of cortisol and other hormones which support a prolonged resistance to stress. These hormones support the body to maintain alertness and to fight illness. The last stage is exhaustion which is characterized by inactivity and tiredness of the body due to exhaustion of the immune system and the nervous system. Kemeny (2003) criticized the general adaption syndrome for assuming a non-specific reaction to stressors. She states that different stressors could elicit different responses depending on whether the threat is evaluated as controllable or uncontrollable. Furthermore, the reaction to stress is said to be influenced by personality as well (Vollrath, 2001). Despite this point of critique, many studies measure stress by analysing the increase of salivary cortisol (e.g. von Dawans, Kirschbaum, & Heinrichs, 2011; Schwabe & Wolf, 2010; Gathmann et al., 2014).
The transactional model states that stress results from an interaction between environment and individual (Hobfoll, 1989). According to this approach, stress results from a mismatch between environmental demand and perceived coping capabilities.
For this thesis, it is not important to apply a single definition since all approaches have some valuable points. The stimulus-based approach helps to understand what stressors are. The response-based approach is the basis for physiological measures of stress, which are explained in 1.2.2. The transactional approach served as the basis for a model that explains the interplay of stress with the time and distance to a threat (Nass et al., 2015) and the influence of the feeling of control on stress. 1.2.1. Stressors
We learnt from the previous section that the simulation is about acute stressors. We have reviewed laboratory studies to learn more about stressors (see appendix A for an overview over those studies).
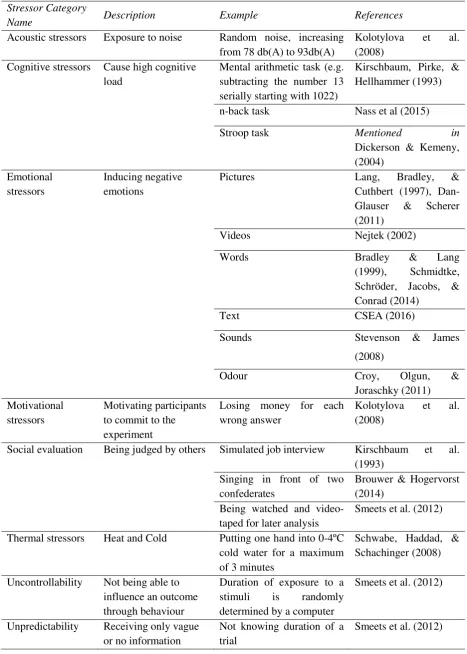
12 Table 2
Overview over Stressor Categories, the Belonging Stressors, Examples and References
Stressor Category
Name Description Example References
Acoustic stressors Exposure to noise Random noise, increasing from 78 db(A) to 93db(A)
Kolotylova et al. (2008)
Cognitive stressors Cause high cognitive load
Mental arithmetic task (e.g. subtracting the number 13 serially starting with 1022)
Kirschbaum, Pirke, & Hellhammer (1993)
n-back task Nass et al (2015)
Stroop task Mentioned in
Dickerson & Kemeny, (2004)
Emotional stressors
Inducing negative emotions
Pictures Lang, Bradley, &
Cuthbert (1997), Dan-Glauser & Scherer (2011)
Videos Nejtek (2002)
Words Bradley & Lang
(1999), Schmidtke, Schröder, Jacobs, & Conrad (2014)
Text CSEA (2016)
Sounds Stevenson & James
(2008)
Odour Croy, Olgun, &
Joraschky (2011) Motivational
stressors
Motivating participants to commit to the experiment
Losing money for each wrong answer
Kolotylova et al. (2008)
Social evaluation Being judged by others Simulated job interview Kirschbaum et al. (1993)
Singing in front of two confederates
Brouwer & Hogervorst (2014)
Being watched and video-taped for later analysis
Smeets et al. (2012) Thermal stressors Heat and Cold Putting one hand into 0-4ºC
cold water for a maximum of 3 minutes
Schwabe, Haddad, & Schachinger (2008) Uncontrollability Not being able to
influence an outcome through behaviour
Duration of exposure to a stimuli is randomly determined by a computer
Smeets et al. (2012)
Unpredictability Receiving only vague or no information
Not knowing duration of a trial
13 Those stressors can be summarized into categories, which we call stressor categories. Table 2 summarizes stressor categories that are mentioned in the literature about laboratory stress tests.
Some stressor categories are not interesting for the simulation of an emergency situation, because they do not fit an emergency. In an emergency situation, individuals are exposed to acoustic stressors such as noise, for instance, the sound of fire alarm and screaming people. They may see emotional stimuli, for instance, injured persons and crying children, which make them feel desperate. They probably experience the feeling of uncontrollability because they cannot influence the situation through their behaviour, especially when they are close to the incident, and a feeling of unpredictability since they do not know what is about to happen and when the unpleasant situation will be over. Moreover, negative emotions, such as fear, arise. Their cognitive load will be high since they are exposed to many stimuli, they have to find the way to a safe place, and try to make sense of the situation. Thus, social evaluative stressors do not fit an emergency situation. Moreover, motivational stressors are not applicable, too, because adding an external motivator may incite the participants to behave more competitively within a group. Thermal stressors take too much effort to apply in movement and to control. In the following section, the relevant stressor categories are described in more detail.
Uncontrollability and unpredictability. Uncontrollability means that individuals could not influence an outcome through their behaviour (Dickerson & Kemeny, 2004). More precisely, “the presence of continuous or intermittent loud noise, auditory distraction, or other emotionally distressing stimuli without the possibility of a behavioural response” (Dickerson & Kemeny, 2004, p. 361) makes a situation uncontrollable. A characteristic that is similar to uncontrollability is unpredictability. It means, that a subject cannot predict the procedure. Unpredictability is also related to the release of cortisol (Mason, 1968). Several studies do not distinguish properly between uncontrollability and unpredictability (Kudielka, Hellhammer, & Kirschbaum, 2007; Smeets et al., 2012) probably because they are often related.
Emotional stressors. Negative feelings in an emergency situation are, for example, fear, anxiety, a feeling of helplessness, and frustration (Nass et al., 2015). Emotions could be seen as accompaniment of emergency situations (Nass et al., 2015), but also as a stressor (Dickerson & Kemeny, 2004). In our study, emotions were used as a stressor but also seen as accompaniment of the simulated emergency situation. Emotions could be evoked by applying stimuli from databases, which are mentioned under references in table 1. The stimuli in the databases were rated on the Self-Assessment manikin (SAM) scale (e.g. Bradley & Lang, 1999; Lang et al., 1997). The SAM ratings of pictures are very similar between US citizens and Brazilians (Ribeiro, Pompéia & Amodeo Bueno, 2005). This is an indication that other cultures rate the pictures similarly. The ratings of pictures revealed that some pictures evoke only one emotion while other pictures evoke multiple emotions (Mikels et al., 2005).
14 Cognitive tasks are often applied in laboratory stress tests (e.g. TSST: Kirschbaum et al., 1993; MMST: Kolotylova et al., 2008). Some authors (Brouwer & Hogervorst, 2014; Niculescu, Cao, & Nijholt, 2008) assume that the cognitive tasks evoke stress through increasing workload. The transactional stress model emphasis that stress is evoked when the demands exceed the capabilities. Therefore it is reasonable, that stress is evoked if cognitive tasks increase cognitive load up to a certain level.
Acoustic stressors. Talking at a normal volume is around 60 dB(A), but even noise levels of 55 decibels are enough to make communication more difficult (Bahr et al., 2015). When people are exposed to 80 decibels constantly, the noise can impact health. Above 130 decibels even a short exposure time is enough to harm the sense of hearing. In laboratory studies, acoustic stressors of 90 db(A) (Miki, Kawamorita, Araga, Musha, & Sudo, 1998) and increasing from 78 to 93 db(A) (Kolotylova et al., 2008) were applied. The study by Miki et al. (1998) found an interaction effect of an acoustic and a cognitive stressor. Completing an arithmetic task (cognitive stressor) only had a small effect on cortisol under quiet conditions but in a noisy condition much more cortisol was released.
Several conclusions can be drawn from the presented literature. Firstly, there are different categories of stressors. According to Dickerson and Kemeny (2004), the categories differ in their effectiveness of evoking stress. Secondly, also the stressors within a category differ in their effectiveness. Thirdly, the meta-analysis by Dickerson and Kemeny (2004) and the study by Miki et al. (1998) about acoustic stressors indicate that combinations of stressor categories are beneficial. Many laboratory stress protocols, such as the well-known Trier Social Stress Test (TSST; Kirschbaum, Pirke, & Hellhammer, 1993) and the Mannheim Multicomponent stress test (MMST; Kolotylova et al., 2008), already combine several stressor categories. For instance, the MMST combines among others an emotional stressor, cognitive stressors and acoustic stressors.
1.2.2. Stress measures
Stress can be measured in several ways. This paragraph discusses objective and subjective measures and users’ performance metrics.
15 Endocrine stress measures analyse the alpha-amylase level (Takai et al., 2004) and cortisol level (e.g. Bigert, Bluhm, & Theorell, 2005). The focus is put on cortisol measures, because it is the most often used and most discussed endocrine measure. Cortisol samples can be obtained from saliva, urine, or blood serum (Bigert et al., 2005). Salivary cortisol has the advantage that it is not necessary to store it at a certain temperature until analysis (Bigert et al., 2005). A disadvantage of measuring cortisol is that some factors influence the amount of cortisol (Hellhammer, Wüst & Kudielka, 2009). Those factors are among others the time of day (Hellhammer et al., 2009), medical conditions, smoking, caffeine and alcohol use, exercise and recent meals (Adam & Kumari, 2009). Cortisol decreases during the day (Raff & Trivedi, 2013). Furthermore, several studies found variations in cortisol levels between healthy individuals and individuals with psychological disorders (e.g. Yehuda, Teicher, Trestman, Levengood, & Siever, 1996). Physiological diseases, such as a renal disease, also cause variation in cortisol (e.g. Raff & Trivedi, 2013). Even genes could moderate the amount of cortisol induced by some stressors (Allen, Kennedy, Cryan, Dinan, & Clarke, 2014).
Cortisol is released when the activity of the sympathetic nervous system declines (see description in 1.2). Therefore, the peak in the cortisol response to a stressor is delayed. The presented stress protocols vary in delay. The MMST reports a delay of twenty minutes (Reinhardt et al., 2012) and the TSST a delay of forty-five minutes (Kirschbaum et al., 1993) after the start of the experiment. According to Dickerson and Kemeny (2004) not all stressor categories are able to evoke the release of cortisol. Their meta-analysis did not show an effect of emotional and acoustic stressors. However, other studies did find an effect (e.g. Fernández et al., 2012; Miki et al., 1998). The MMST and TSST as well as other stress tests combined several stressor categories. Therefore, we assume that a combination of stressors evoke the release of cortisol.
Subjective measures. Subjective stress measures were in line with the objective measures in several studies (e.g. McRae et al., 2006; Reinhardt et al., 2012). Subjective stress ratings could be obtained by marking the stress level on a visual analogue scale ranging from zero to one-hundred (Hellhammer & Schubert, 2012) or indicating the stress level by means of a Likert scale ranging from zero to nine (Reinhardt et al., 2012) or to ten (Brouwer & Hogervorst, 2014). Both types of measurements, the line and the Likert scale, lead to similar results (Carifio & Perla, 2007). How long the stress experience lasts depends on the stress manipulation. Five to thirty minutes are reported by McRae et al. (2006). The Self-Assessment Manikin (SAM) could be applied to measure emotions (e.g. Bradley & Lang, 1999; Lang et al., 1997). It consists of three scales: the valence scale assessing how happy people feel, the arousal scale assessing how excited participants feel, and the dominance scale assessing how much they feel under control of the situation.
16 decrements. Oei et al. (2006) stated that performance in a reaction task and memory recall task decreased when cortisol was high. However, neither the app nor the other speech analyses were applied because a proper voice recording during the experiment cannot be assured, since voice recording apps may interfere with the RESCUER App. The memory recall task could be a possibility to measure stress.
1.3. Moderator Variables
The variables moderating the cortisol response were already presented in 1.2.2. The variables moderating the performance and stress perception in an emergency situation are presented here. Some papers discuss the relation of personality and stress (Mogg, Bradley, & Hallowell, 1994; Stankovic, Fairchild, Aitken, & Clark, 2014; Vollrath, 2001). The study by Mogg et al. (1994) found a relation of stress and trait anxiety, which affected the direction of attention to threat words. Stankovic et al. (2014) found a relation of stress and trait impulsivity in a risky choice task. Personality also influences the coping strategies (Penley & Tomaka, 2002). Some people benefit from medium or high emotional intelligence when coping with stress (Gohm, Corser, & Dalsky, 2005). To sum it up, personality could account for individual differences in the stress response.
The participants’ age may affect the performance in a stress experiment since some brain regions involved in information processing mature late and are affected by aging. For instance, the prefrontal cortex (PFC) is responsible for decision making and working memory (Glendon, 2011). It is one of the last brain regions to mature (Glendon, 2011), and its functionality declines in almost all older adults (Schultheis & Manning, 2011). Furthermore, walking affects dual task performance in older people more than in younger ones (Srygley, Mirelman, Herman, Giladi, & Hausdorff, 2009).
Previous experience with emergencies may affect the experiment. Experiences are stored in long-term memory, which could influence other parts of information processing (Wickens, Lee, Liu, & Gordon Becker, 2004). In one evaluation of the RESCUER App, an interaction effect was found between ratings of cognitive load and prior experience with emergency situations (Nass, Jung, Groen, & Villela, 2015b). The participants with experience rated the app screens as more difficult in comparison to participants without experience.
Some moderator variables could be excluded by the selection of the participants. Selection criteria are age, no physiological impairments that affect using an app and walking, and no severe psychological disorders. Other variables have to be assessed by a questionnaire, such as experience with emergencies, or be assessed by other means.
1.4. Creating the Simulation
17 adjustments to other crowd-based rescue systems or another evaluation if the incident type is different. For instance, when the incident is a fire the sound of a smoke detector can be used as an acoustic stressor. In case of an earthquake other sounds make more sense. The simulation of the use context for the RESCUER App and the stress manipulation are described in the following, as well as some practical issues that should be considered.
1.4.1. Creating the use context for the RESCUER App
The use context (see 1.1.) and table 1 described the requirements for simulations for crowd-based rescue systems in general. In the following section, a simulation is described that is adapted to the evaluation of the RESCUER App.
18 1.4.2. Stressors for the simulation
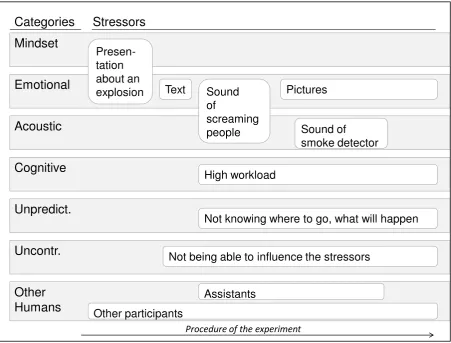
[image:18.595.75.527.165.508.2]From the section about stress (see 1.2.) we learnt that a combination of stressor categories should be applied that make use of visual and acoustic channels. Olfactory and thermal stressors could also be considered but they are not applicable in the given location. The selected stressors are presented in figure 2 and are explained in more detail in the method section (see 2.4.).
Figure 2. Overview over the applied stressor categories (grey boxes) and the related stressors (white boxes). Some stressors could be assigned to two categories. The order of the stressors represents the order during the experiment. Several stressors were present at the same time. In those cases, interaction effects are possible.
1.4.3. Issues to take into consideration
The set-up of the simulation has to take into account that stress and emotion affect perception (Mendl, 1999; Schwabe & Wolf, 2010). Stress may cause attentional tunnelling, that means the range of attention is restricted (Wickens et al., 2004). Peripheral cues are not perceived so that the focus is on the more important cues (Ozel, 2001). Thus, participants may miss visual stimuli because their focus is more on cues helping them to find the way to safety. To counteract this, the visual stimuli should be positioned on prominent places and the participants should be instructed to actively look for them. Moreover, people may forget that they have the rescue system with them (Bergstrand & Landgren, 2009). In the simulation, the participants should be reminded about using it.
Acoustic
Cognitive
Uncontr.
Other
Humans
Unpredict.
Emotional
Mindset
Not being able to influence the stressors Pictures Sound of smoke detector Sound of screaming people Presen-tation about an explosion Assistants Other participants Text
Not knowing where to go, what will happen High workload
Categories
Stressors
19 To analyse whether the participants really experience stress, a control group was necessary that experiences stress not at all or only mildly. The procedure should stay the same, but all negative stimuli should be replaced by positive ones, for instance pictures of happy persons and relaxing music instead of sad persons and the sound of a smoke detector. A presentation at the beginning of the simulation is supposed to bring the participants in a mindset that facilitates emphasizing with the scenario. In the control group, the presentation functions as a protective frame (Fokkinga & Desmet, 2013), which enables the participants to enjoy an explosion. In the simulation applied to the RESCUER App the frame was created by putting the explosion in a controlled setting in which it is assumed to lose its harmfulness.
1.4.4. Pilot study
In a pilot study, two people represented the control group and two the experimental group. One person in each group was provided with the app. In the experimental group, the experiment started with a presentation about explosions to bring the participants into the right mindset, and then they read a text saying that they are close to an explosion. The text contained eleven bold printed words which were related to emergencies or negative emotions. Next they watched a video of an explosion and then went back to the text to memorize the bold printed words within two minutes. The memorizing task was meant to increase the cognitive workload and to keep emotional words in mind during the experiment. After two minutes, they went to Point B while listening to the sound of fire alarm, which was played from the smartphone for practical reasons, and reporting the incident via the app. Along the way, there were photos they had to report. The procedure of the control group was the same but with positive stimuli, such as relaxing music instead of the sound of fire alarm.
The pilot study revealed that the participants forgot the words too fast to keep cognitive load high during the experiment. Therefore, the memorizing task was removed. The new approach was then to include more stimuli that are present in an emergency situation to make the simulated emergency situation itself cognitively demanding enough. New stimuli were assistants who stood along the path to Point B and shouted at the participants to hurry and acted hectic. Other added stimuli were one confederate in each group who behaved in a stressed manner in the experimental group and calmly in the control group. Those stimuli were based on the assumption that people adopt emotions of others (Nass et al., 2015). Moreover, the pilot study revealed that the stressors have to be closer in time to keep the stress level constant. Another pilot study with an improved stress manipulation was successful in evoking constant stress.
1.5. Research Question and Hypotheses
This thesis had the purpose of answering the following research question:
Is the presented simulation of an emergency situation useful for evaluating crowd-based rescue
20 Two subquestions had to be answered. Namely, was the stress induction successful and was the simulation of the use context successful?
The success of the stress manipulation was reflected in the data in three ways; cortisol level, subjective stress ratings and ratings on the Self-Assessment Manikin (SAM). The cortisol level was assumed to increase from the first to the second measure in the experimental group. In the control group the difference between the two measures was assumed to decrease slightly according to the normal day schedule. The subjective stress level was hypothesised to be higher during the experiment in comparison to before the experiment in the experimental group. The control group was assumed to only indicate mild levels of stress during the experiment and only a small difference compared to before and after the rating. The participants in the experimental group were expected to feel less happy, less under control, and more aroused during the experiment than before the experiment (Dickerson & Kemeny, 2004; Nass et al., 2015). Their absolute ratings were assumed to reflect unhappiness, low control and high arousal during the experiment. The control group was expected to feel as happy and under control of the situation during the experiment as before and after the experiment. The control group was expected to feel aroused during the experiment, too, since those participants had to be active during the experiment. However, the increase in arousal was expected to be lower than in the experimental group. The control group was assumed to feel medium to high levels of valence and dominance. Furthermore, we assumed that the mean ratings of the stressors reflect at least medium stressfulness.
The simulation was considered to be successful, when the participants empathized with the scenario. Empathizing took place when they walked to the safe area while reporting the incident, they perceived the stressors, and they were not distracted by anything not related to the experiment. It was expected that the participants in the experimental group would run or at least walk fast if they feel that it is necessary to flee from the incident. The assistants did not tell them to run so that it could be observed how the participants behaved because of the simulation. The control group on the other hand was expected to walk at a normal pace.
2. Method
2.1. Participants
21 participants’ study program was in English. The participants were recruited by sending e-mails and by personally asking students related to Fraunhofer IESE. The invitation informed about the exclusion criteria (physiological or psychological impairments) and from which activities they should refrain from. All participants indicated to have refrained from consuming food, beverages containing alcohol or caffeine and extensive exercise at least one hour before the experiment and half an hour before from any beverages. Personality, emotional awareness and genetics were not controlled since obtaining them would consume too much time and budget. Several nationalities were represented in the sample. In the control group, 50% were Iranian, 30% German, and 20% Indian. In the experimental group 50% were Indian, 25% Brazilian, 16.7% Pakistani, and 8.3% Iranian.
None of the participants indicated to be physically or mentally handicapped in a way that could have influenced the experiment. Six of the participants had experience with emergencies. An emergency was defined as a situation that required calling rescue workers.
2.2. Materials
Different types of smartphones with the Android operating system were used (Archos 50 Platinum, 2x LG Nexus 2, LG Nexus 5, Samsung Galaxy S3, and Samsung Note 2). The latest version of the RESCUER App was installed, called rescuer_0.42.0.r425. This version was used without WiFi because of the network instability in certain parts of the escape route. The data was saved on the phone and was sent via e-mail to a computer for analysis after the experiment. The app icon was on the start screen. The video showing an explosion used was derived from YouTube (YouTube, 2015). The presentations and the texts were accompanied by music. In the experimental group a sad and dramatic piece of music was used (Secession Studios, 2014) and in the control group happy music (YouTube, 2013) was used. The statistical analyses were conducted using IBM SPSS 23.0.
2.3. Scenario and Task
22 2.4. Stress Manipulation
Stressors belonging to the categories (mentioned in 1.4.2.) were applied. Figure 2 provides an overview over the stressors and their chronological order. The experiment was approved by the ethics committee at the University of Twente.
The presentation (appendix F) at the beginning of the simulation was about the fireworks disaster in Enschede in 2000. The presentations did not contain any signs of fire so that the participants could not confuse the disaster with a fire. The emotional stressors were a text and pictures. The text (appendix H) described the scenario and included bold printed words, which were related to emotions or emergencies (e.g. sad, harmful). It was planned to use words of the Affective Norms of English Words (ANEW: Bradley & Lang, 1999), however, the institute responsible for providing the ANEW did not respond to requests to make the words available for research purposes. The pictures (appendix K) showed a crying child and people running away from a threat and were in approximately A2 format attached to the walls along the path to point B. Acoustic stressors were the sound of a fire alarm played at the volume of 80dB and the sound of screaming people. The sound of screaming people was also an emotional stressor.
A cognitive stressor was not included for the reasons described in ‘1.4.4. pilot study’. The situation itself was considered to be cognitively demanding, because the participants had to complete several tasks at the same time; they had to keep the information from the video active in their memory, they had to look for information in their surroundings, extract relevant information and report it through the app or keep it in working memory, and they had to listen to the instructions of the assistants and find their way through the building. Uncontrollability was part of the experiment since the participants could not influence the unpleasant stimuli such as the sound of the smoke detector. Unpredictability was evoked by not providing information about the duration of the experiment, the exact way to point B, and what was going to happen during the experiment (see procedure). A feeling of uncontrollability and unpredictability was also described in the text about the scenario. Furthermore, when the participants left the meeting room, they entered a dimly lit corridor which was assumed to make it more difficult to get an overview over the situation.
The behaviour of the assistants along the way to Point B and the confederate among the participants was meant to evoke stress and negative emotions in the participants by behaving erratically and not smiling. The assistants informed the participants about the direction to point B by shouting “Go in this direction” and they told them to hurry (see appendix J for their instructions). Telling them the direction assured that the participants walked along the pre-defined way. Still, the participants had to orient themselves to find the way to point B. Moreover, participants expressing emotions may act as emotional stimuli, too (Nass et al., 2015).
23 Mythbuster experiment went slightly wrong but the participants were at a safe distance, neutral or positive words were highlighted (appendix I). The presentation and the text describing the scenario were accompanied by happy music (YouTube, 2013). After the text the sound of laughing people was played at the volume similar to a conversation. On the way to point B, relaxing music was played (Explosions in the Sky, 2004). Instead of posters depicting negative stimuli, happy persons were depicted. The assistants along the way were smiling and informing the participants where to go in a calm and friendly way.
2.5. Procedure
The procedure is described from the perspective of the experimental group. The control group followed the same procedure but with the non-stressful stimuli. Figure 3 illustrates the procedure. The control group started at 10 a.m. and the experimental group in the afternoon at 3 p.m. Each experiment lasted about 80 minutes. In each group, there was supposed to be one confederate and twelve participants. The number of participants was calculated with a g*-analysis (appendix B). However, in the control group, two persons did not show up resulting in ten participants. Appendix C presents the protocol of the experiment with more details about the procedure and an explanation of the justifications of the procedure.
24 participant number was stuck to the phones to later identify the user of the phone. When all questionnaires were filled out, the participants in the experimental group were debriefed directly and the control group was informed that they would receive an e-mail the next day. They were not debriefed directly so that they could not pass on any details about the experiment to the participants who participated later that day as part of the experimental group. All participants were thanked for participating. The control group was served coffee, which was announced days before the experiment so that they had an incentive to refrain from caffeine beverages in the morning.
Figure 3. Overview of the most important steps of the experiment. Inside the grey box, the steps of the experiment are depicted.
2.6. Measures
Subjective measures. The participants indicated their stress level on a Likert scale ranging from zero to ten. This type of scale was chosen because it takes less effort to analyse than a line ranging from zero to one hundred. The Self-Assessment Manikin (SAM) was not used to determine the exact emotion but to analyse whether the participants felt accordingly to an emergency situation. SAM was introduced in questionnaire 1 (appendix G) with a short explanation about the scales. All three scales (valence, arousal, and dominance) were applied. A version of SAM was used that depicted circles under the nine pictures to facilitate marking the SAM pictures. Only in the questionnaire for the experimental group without app, the circles were mistakenly not depicted. The subjective measures were obtained for three moments in time: before, during, and after the experiment. The measures for before and during the experiment were obtained at the same time, namely when filling in the second questionnaire. Asking the participants directly during the experiment to rate stress and SAM would have interrupted the flow of the experiment. We assumed that a few minutes after the experiment ended, they were still able to express how they felt during the experiment.
Objective measures. Stress was measured objectively by analysing salivary cortisol samples. Salivary cortisol was chosen because it does not require the assistance of medical staff as blood cortisol does and it is easier to obtain at a certain point in time than urinary cortisol. Saliva cortisol was obtained by using the Medivera® saliva kit. The samples were taken twice; about 20 minutes before the
Explanation of the Tasks
25 experiment started and 25 minutes after the experiment ended. The measure before the experiment was obtained before the participants faced any stimuli related to emergencies. The time of the peak cortisol level differs between studies (e.g. Kirschbaum et al., 1993; Kolotylova et al., 2008). The time of the second measure was inspired by the peak level in the Manheim Multicomponent Stress Test (MMST), because the duration of the stress manipulation in the MMST (5 min) is similar to our study (5-7 min) and choice of stressors is similar to MMST, which also combined an acoustic stressor with psychological stressors. The second cortisol measure was supposed to be 20 minutes after the experiment, but the actual time was 25 minutes so that more participants could finish the second questionnaire before the measure. The cortisol analysis was conducted by Medivera®.
Other measures. The assistants and the experiment leader reported their observations. They did not follow an observation protocol since this would have distracted them from their main task. Additionally, the perceived stressfulness ratings of the stressors and other elements of the experiment that may have unintentionally evoked stress were obtained from the participants. The SAM dominance ratings gave an indication for the success of the stressor uncontrollability.
2.7. Data analysis
A linear mixed model was applied since it is a convenient way to deal with repeated measures. The cortisol was measured two times, and the subjective stress ratings and the SAM ratings three times. The predictors in all analyses were the group, the app use, and the moment of measure. Interaction effects between all variables were included.
From the stress elements, only the means were calculated to get an impression of the perceived stressfulness of the elements. Further analyses, such as comparing the means, was not conducted since the design of the experiment did not allow for the exclusion of interaction effects. The success of the simulation was determined based on the reported information through the app, the observation of the participants, and the reports of the participants and a confederate about how they perceived the experiment in an open interview.
3. Results
The tables about the descriptive statistics and the variance are presented in appendix M, the testing of assumptions in appendix N, and the syntax in appendix O.
3.1. Cortisol measures
26 the experiment. An increase implied an increase in stress; a decrease implied that the participants experienced no stress or their stress level decreased. The diagram shows that in both groups the cortisol level of most participants decreased from before to after the experiment. Only five participants showed an increase in cortisol, two in the control group and three in the experimental group. That means the cortisol measures did not support the success of the stress manipulation. The statistical data supported this finding (table 3). The interaction effect of moment and group is small while at the same time the confidence interval is large (B = 206.03, 95% CI = [-2901.56, 3313.62]).
Figure 4. Depiction of the individual results of the cortisol measures . The moment of measure is with regard to the experiment. The results are distinguished by the group the participants were in. The control group is depicted on the left and the experimental group on the right.
Table 3
Estimates of Fixed Effects of Cortisol Measures Excluding Participants with Extreme Values
Parameter 95% Confidence Interval
Estimate Sig. Lower Bound Upper Bound
Intercept 1632.00 <.01 711.89 2552.11
[Moment=before] 1176.17 .26 - 918.97 3271.30
[Group=Control] 2026.40 .01 661.65 3391.15
[image:26.595.74.525.535.768.2][App = without] -55.00 .94 -1509.82 1399.82
[Mom=before] * [Group=Control] 206.03 .89 -2901.56 3313.62
[Mom=before] * [App= without] -770.42 .63 -4083.12 2542.29
[Group=Control] * [A = without] -1911.07 .08 -4107.80 285.67 [Mom=before] * [Group=Control]
27 Note. N = 17
3.2. Subjective Ratings
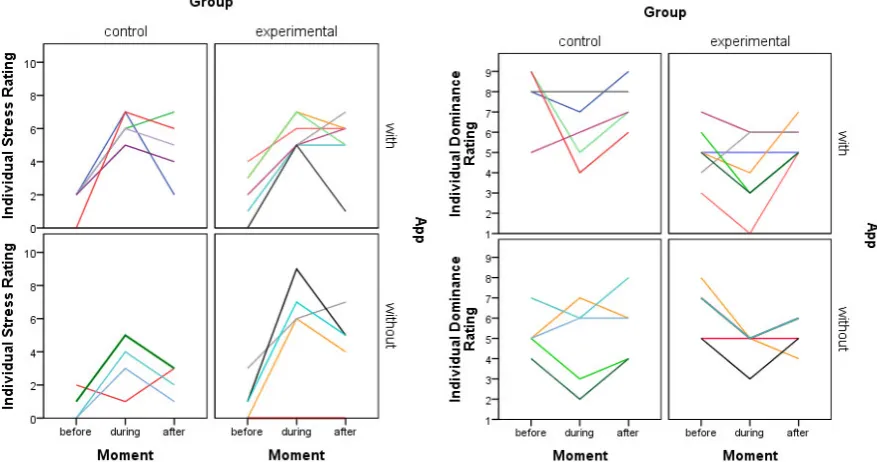
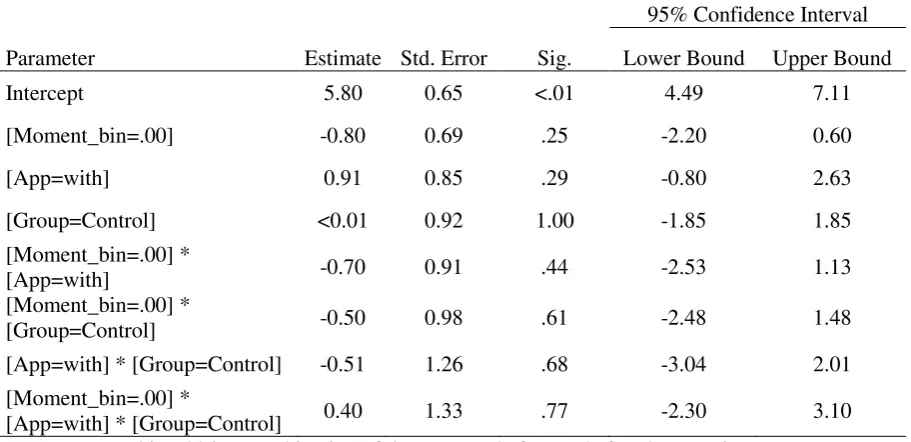
Figure 5 presents the stress ratings. The value zero means not stressed at all and ten means extremely stressed. Figure 5 shows that all participants indicated an increase in stress from before to during the experiment, except for two participants. The mean increase for the control group with the app (M = 4.60, SD = 1.52) is as high as in the experimental group without the app (M = 4.60, SD = 3.13).
[image:27.595.76.515.194.425.2]Figure 5. Individual stress ratings sorted by group and app use.
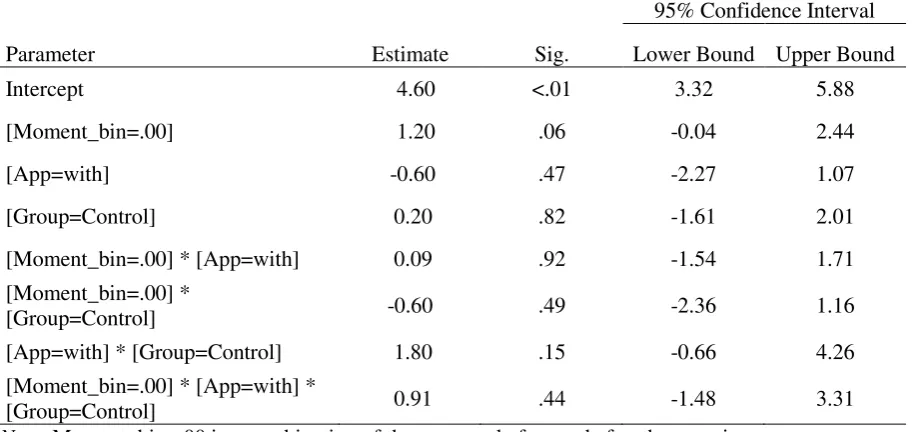
Figure 6. Individual dominance ratings sorted by group and app use.
The statistics confirm the effect of the moment (B = -3.00, 95% CI = [-5.24, -0.76] ). The participants in the control group without the app indicated only low to moderate stress (range = [1, 5]) and the other participants moderate to high levels (range = [5, 9]). Table 4 confirms that the control group indicated lower stress ratings and that there is an effect of the 2x2 groups (= app*group) but shows only a small effect of the interaction of the group and the moment. The assumption that the experimental group shows an obvious increase in stress during the experiment and the control group only a mild increase compared to before and after the experiment is not confirmed since it was not expected that the control group indicated such an increase in stress and that the control group without the app showed similarly high ratings as the experimental group.
28 Table 4
Estimates of Fixed Effects of the Subjective Stress Ratings
Parameter Estimate Sig.
95% Confidence Interval Lower Bound Upper Bound
Intercept 5.60 <.01 3.72 7.48
[Moment_bin=.00] -3.00 .01 -5.24 -0.76
[App=with] 0.11 .93 -2.35 2.58
[Group=Control] -2.00 .14 -4.66 0.66
[Moment_bin=.00] *
[App=with] 0.79 .59 -2.15 3.72
[Moment_bin=.00] *
[Group=Control] 1.00 .53 -2.17 4.17
[App=with] * [Group=Control] 2.49 .18 -1.14 6.11
[Moment_bin=.00] *
[App=with] * [Group=Control] -1.79 .41 -6.10 2.53
Note. Moment_bin=.00 is a combination of the measure before and after the experiment.
Table 5
Estimates of Fixed Effects of the Subjective Dominance Ratings
Parameter Estimate Sig.
95% Confidence Interval Lower Bound Upper Bound
Intercept 4.60 <.01 3.32 5.88
[Moment_bin=.00] 1.20 .06 -0.04 2.44
[App=with] -0.60 .47 -2.27 1.07
[Group=Control] 0.20 .82 -1.61 2.01
[Moment_bin=.00] * [App=with] 0.09 .92 -1.54 1.71
[Moment_bin=.00] *
[Group=Control] -0.60 .49 -2.36 1.16
[App=with] * [Group=Control] 1.80 .15 -0.66 4.26
[Moment_bin=.00] * [App=with] *
[Group=Control] 0.91 .44 -1.48 3.31
Note. Moment_bin=.00 is a combination of the measure before and after the experiment.
29 1.16]). However, the group in combination with the app use had an effect on the ratings (B = 1.80, 95% CI = [-0.66, 4.26]). The control group with the app felt like they had more control, than the other group and app use combinations. The hypothesis that only the experimental group felt less under control and low in the absolute control rating during the experiment is not confirmed.
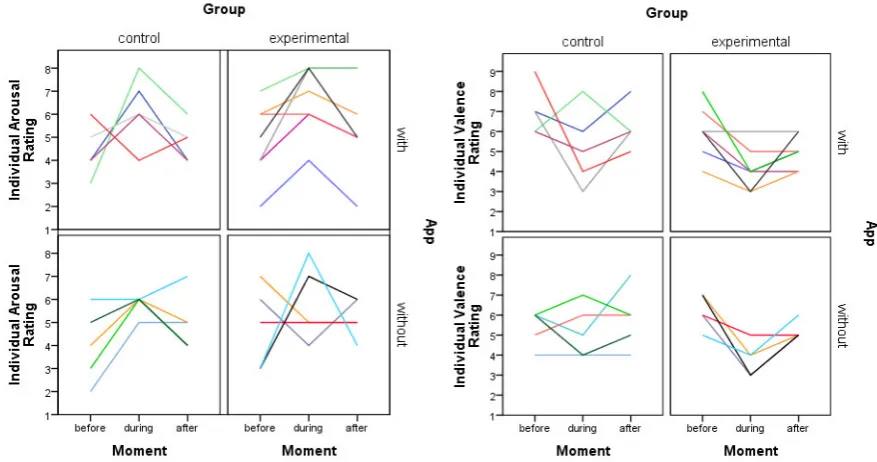
Figure 7. Individual arousal ratings sorted by group and app use.
Figure 8. Individual valence ratings sorted by
group and app use.Figure 7 presents the individual arousal ratings. All participants except for five indicated to feel more aroused during the experiment compared to before and after. However, table 6 shows only a small effect of the moment of measure on the ratings as well as of the interaction of moment and group. The ratings in the control group without the app do not exceed six during the experiment. In the other app and group combinations the maximum arousal ratings were eight, which represented a high level of arousal. All predictor variables only have a small effect on the ratings (see table 6). Figure 7 shows that the assumption that both groups experience more arousal during the experiment was true for most participants. However, the assumption that the control group experienced less arousal than the experimental group is not confirmed (B < 0.01, 95% CI = [-1.85, 1.85]).
30 during the experiment. However, the data shows that there were participants in the control group who felt unhappy and less happy compared to before and after the experiment. On the other hand, the experimental group indicated a larger decrease in happiness during the experiment and the control group had in general higher ratings. Therefore, the hypothesis is only partly confirmed.
Table 6
Estimates of Fixed Effects of the Subjective Arousal Ratings
Parameter Estimate Std. Error Sig.
95% Confidence Interval Lower Bound Upper Bound
Intercept 5.80 0.65 <.01 4.49 7.11
[Moment_bin=.00] -0.80 0.69 .25 -2.20 0.60
[App=with] 0.91 0.85 .29 -0.80 2.63
[Group=Control] <0.01 0.92 1.00 -1.85 1.85
[Moment_bin=.00] *
[App=with] -0.70 0.91 .44 -2.53 1.13
[Moment_bin=.00] *
[Group=Control] -0.50 0.98 .61 -2.48 1.48
[App=with] * [Group=Control] -0.51 1.26 .68 -3.04 2.01
[Moment_bin=.00] *
[App=with] * [Group=Control] 0.40 1.33 .77 -2.30 3.10
Note. Moment_bin=.00 is a combination of the measure before and after the experiment.
Table 7
Estimates of Fixed Effects of the Subjective Valence Ratings
Parameter Estimate Sig.
95% Confidence Interval Lower Bound Upper Bound
Intercept 3.80 <.01 2.75 4.85
[Moment_bin=.00] 1.90 <.01 0.67 3.13
[App=with] 0.34 .62 -1.04 1.72
[Group=Control] 1.40 .07 -0.09 2.89
[Moment_bin=.00] *
[App=with] -0.54 .50 -2.16 1.07
[Moment_bin=.00] *
[Group=Control] -1.50 .09 -3.24 0.24
[App=with] * [Group=Control] -0.34 .74 -2.37 1.69
[Moment_bin=.00] *
[App=with] * [Group=Control] 1.54 .20 -0.83 3.92
[image:30.595.74.527.490.716.2]31 3.3. Stressors
Figure 9. Mean ratings with error bars of the stressfulness ratings of elements in the experiment. 1 = not stressful to 5 = very stressful. Only the experimental group rated the elements. Most elements were intended to evoke stress (i.e., stressors) except for ‘Pictures of Explosion’, ‘Presentation about Explosion’, ‘Video of Explosion’, and ‘Using the App’. N = 12 for all elements except for sound of screaming people, pictures of humans and pictures related to explosion, for them N = 11 due to missing ratings. Using the app was only rated by the participants with the app.
The people in the experimental group rated the stressfulness of the elements of the experiment. A score of one indicates ‘not stressful’ andfive means ‘very stressful’. The sound of the smoke detector (M = 3.42, SD = 1.08) and the video about the explosion (M = 3.42, SD = .90) were rated as most stressful. The figure shows that three more elements had a mean rating of three or higher. All other stressors or unintentional stressful elements were rated lower than three but higher than 2.5, except for the persons within the group (M = 2.08, SD = 0.90).
3.4. Other data
32 have the app. The participants in the experimental group arrived at point B individually, indicating that no groups were formed. In the control group, the participants arrived almost all at the same time. The confederate in the experimental group reported to not have seen any of the posters because she was so focused on fleeing. Moreover, a participant in the experimental group indicated to have paid so much attention to the app that he missed some posters.
4. Discussion
First, the results are discussed. Then, limitations are discussed and suggestions for future research are presented.
4.1. Discussion of the Results
We start with the discussion of the subjective stress and SAM ratings, next the cortisol measures are discussed, thereafter other data, such as the observations, and finally the stressors.
4.1.1. Subjective ratings
The experimental group’s subjective ratings were in favour of the success of the stress manipulation. The differences between the measures before to the measures during the experiment is similar to the one caused by a Stroop task but lower than caused by the Paced Auditory Serial Addition Task (PASAT) (Kolotylova et al., 2008). The mean stress ratings were a bit higher than the ratings in the Trier Social Stress Test (TSST), the MAST and the different versions of the cold pressure test (McRae et al., 2006; Schwabe et al., 2008; Smeets et al., 2012) and a bit lower than in the Sing-a-song stress test (SSST: (Brouwer & Hogervorst, 2014), the MMST, and the TSST for groups (TSST-G: Von Dawans et al., 2011). In the control group without the app, the mean rating during the experiment (M = 3.60, SD = 1.67) is higher than in the control group of the TSST-G (about M = 2.00). The control group with the app indicated similar stress ratings to the experimental group but higher dominance and valence ratings. The control group with and without the app showed higher ratings than in other studies. Perhaps, some participants were reminded of the Paris terror attacks of November 2015, which took place four days prior to the experiment, while watching the video and for this reason rated stress higher. However, this cannot be the only explanation, otherwise, the ratings in the control group with the app and without the app would be more alike.
33 knew that an app for emergencies should be evaluated. This is called good-subject effect (Nichols & Maner, 2008).
The SAM ratings revealed that the control group was happier, less stressed, equally aroused and similar in perceived control. The expectations were that they felt more in control and less aroused than the experimental group. Consequently, the control condition should be redesigned to increase the feeling of control and to reduce the arousal.
4.1.2.Cortisol.
The cortisol measures did not confirm the hypothesis that the control group experienced no or only mild stress and the experimental group experienced stress. As expected the two groups cannot be compared directly because they were tested at different times of the day. That means, the cortisol levels of the two groups differed due to the circadian rhythm of cortisol causing the time of measurement to be a confound in this experiment. We assumed we could compare the tendency of the two groups. However, the tendencies did not reflect a stress response. This contradicts other stress protocols, such as TSST (Kirschbaum et al., 1993) or MMST (Reinhardt et al., 2012).
34 selection of stressors, and that there was no control over the activities before the experiment may have been responsible for the lack of increase in cortisol that was found.
4.1.3. Other data
The results in 3.4. support the success of the scenario of an emergency situation. The reported information through the app, the interviews and the observation were in favour of the success of the simulation. The confederate in the experimental group had not been informed about what exactly would happen after leaving the first meeting room. The fact that the confederate failed to see the posters was probably due to attentional tunnelling. Thus, the confederate was stressed even though she had received some information about the experiment. The reported information through the app revealed unexpected findings. In the control group participants reported information objectively, however participants in the experimental group did not. The participants in the experimental group reported “(…) the one car exploded” “(…) resulted in killing of people, many of them got injured”, “I think 2 people died on spot”. Not reporting objectively is probably due to the impact of stress on information processing. Stress may impair among others the perception of stimuli (Ozel, 2001; Wickens et al., 2004) and decision making processes (Leach, 2004). This means that fewer stimuli are perceived to draw conclusions from due to attentional tunnelling and fewer alternatives are considered due to cognitive tunnelling (Wickens et al., 2004) when making a decision. This makes the report of wrong information more likely. The reported information also revealed that some participants reported an explosion and a fire; however, fire was meant to be a consequence of the explosion but not the incident itself. Participants indicated that their understanding of an explosion is related to fire. Future simulations of an explosion should take this into consideration.
4.1.4. Stressors
Most stressors were successful in evoking stress. The stressors ‘Sound of screaming persons’, ‘Pictures of humans’, and ‘Persons within the group’ got a mean rating below three, indicating low to moderate stressfulness. Thus, they were perceived as less stressful than expected. The sound of screaming people may have been rated lower than the sound of the smoke detector because it did not come in combination with a cognitive task. The participants namely did not start with answering questions in the app and looking for information. The study by Miki et al. (1998) found only an increase in cortisol when the acoustic stressor came in combination with an arithmetic task (cognitive task). The other people in the group may have been rated low on stressfulness since there was almost no interaction within the group; nobody needed the help of other participants, the distance between the most participants was too big to get influenced by other participants’ behaviour and facial expressions, and some participants interacted more with the app than with their surroundings. If the group would be bigger and if some confederates would simulate the need for help, then the interaction among participants would probably increase, resulting in an effect of the stressor ‘people in the crowd’.
35 a stressor but apparently contributed to stress. The presentation was meant to evoke some emotions but they were not assumed to be strong enough to evoke stress. Maybe the pictures of sad persons, the mentioning of death in the presentation, and the likelihood that people got severely hurt in the video worked as emotional stressors. Using the app may have increased the cognitive workload since some participants used the chat screen even when they did not feel able to. Improving the instructions about when to use this screen may reduce or eliminate the perceived stressfulness. The stressfulness of uncontrollability was not measured directly. However, the dominance ratings indicated that not all participants experienced a loss in control and a feeling of not being in control. This is an indication that the stressor was not successful for all persons.
To sum it up, the scenario was successful. Still, the visual stressors should be improved to evoke a stronger feeling of unhappiness and the stressor uncontrollability should be improved so that it affects more participants and has a stronger response. The stress manipulation is considered successful since the subjective ratings and the findings presented in ‘other data’ were in favour of the stress manipulation for the most participants, at least in the experimental group. The cortisol measure did not confirm the stress manipulation, probably because it was affected by measurement errors and the stressors were not strong enough for a cortisol reaction. Moreover, the high arousal and stress ratings in the control group with the app and the decrease in valence and dominance ratings in several participants in the control group did not support the success of simulation. However, the ratings are contradicting which indicates that they did not experience real stress. Thus, the simulation for the control group has to be improved, so that they are more relaxed during the experiment. This study showed that the simulation is applicable to evaluate the RESCUER App and, therefore, it is likely that the simulation can also be applied to other crowd-based rescue systems.
4.2. Limitations
36 explanation. Therefore, the feeling of uncontrollability was probably low when leaving the meeting room. However, shortly after that when the path made an unexpected turn, the feeling of uncontrollability was probably higher than without the wrong impression. Therefore, the ambiguous explanation probably did not affect the experiment negatively in a big way. Thirdly, the experiment took place inside a building. The app is mainly meant for big industrial areas and large-scale events, which mostly include areas outside of buildings. In this study, limitations of the app were not unveiled that only appear in outside areas, such as poor contrast of the display due to sun. Fourthly, the simulated incident was described in the text, as taking place on the street and not in the building, which would had simulated the closeness to the incident better. This was done, since a simulation of an explosion directly in the room would have stressed the control group too much. Fifthly, the volume of the screaming people and the sounds in the control condition could not be measured. This should not have happened since it complicates the reproducibility of the simulation. In future simulations, the sounds should be played at least at a volume of 80 dB. Sixthly, in this simulation, it was assumed that running indicates that the participants felt the necessity to run and that this would resemble a real emergency. However, the assistants used the word ‘hurry’, which some participants maybe have interpreted as an instruction for running. Moreover, there are incidents where people do not feel the necessity to run. That means the argument that running is indicating the behaviour of a real emergency was poor. Seventhly, the other stressors in the questionnaire were not formulated well, e.g. walking to Point B did not express well that the activity of walking was addressed. Furthermore, an option saying ‘don’t know’ should have been added to the questionnaire. Eighthly, the cortisol measures of the two groups were not at the same time of the day, which was a confound. Therefore, a direct comparison was not possible. Furthermore, some moderator variables were not assessed, such as personality traits and renal diseases. The subjective ratings were influenced by a testing effect, which is clear limitation. The subjective ratings were therefore less reliable. The testing effect probably occurred because the participants knew that the purpose of the experiment was the simulation of an emergency situation, that stress was probably evoked, and because they tried to be a good subject (Nichols & Maner, 2008). However, they did not indicate that one objective of the experiment was the induction of stress when asked about the purpose of the experiment.
4.3. Future Research