STEM or Not.
Does the
Teacher
Determine This?
Psychology Learning Sciences
Carlijn Veldhorst MSc
1 Title of the final project
STEM or not. Does the teacher determine this?
Researcher
Carlijn Veldhorst MSc, [email protected]
Supervisors
Dr. S. van Aalderen, [email protected]
Prof. dr. J. H. Walma van der Molen, [email protected]
Keywords
2 Acknowledgement
I investigated the mindset of teachers. By performing this master thesis I also investigated my own mindset. Although I think sometimes that I reached my limits, I learned to find new ways to reach my goal and to discover new challenges. So, performing this master thesis was an absolute mess of having a fixed and growth mindset. This master thesis is part of a result I did not expected: By following additional psychology courses, I decided to do the Master Psychology Learning Sciences. By being interested in the field, I did an internship. And by stepping outside comfort zone, I applied for a wonderful job.
Although you learn a lot by doing, I could not completed my master thesis without my two supervisors. Juliette, thank you for your honest feedback. Sandra, thank you for making it clear that I was learning and my skills improved. You are a very inspiring teacher. I think it is very special I met you during my first study, and after all these years you are my supervisor. And of course, I had a little (lot) help from family, friends, and my boyfriend Joeri. Thanks for helping me with my English language, listening to my extended speeches on education and all the nice things for extraction.
For now I will enjoy all the things I learned until now and focus on my job as educationalist. And after a while, I will find new things to learn. Because if I learned something from this master thesis, it is that you can always learn new things.
It took me so much, to get to where we are And right now you are
3 Contents
Acknowledgement ... 2
Abstract ... 4
Introduction ... 5
Theoretical Framework ... 6
Expectancies of Teachers ... 6
Mindset ... 8
Effort Beliefs ... 10
Student Characteristics ... 11
Context ... 13
The Current Study ... 14
Research Question and Model ... 14
Method ... 15
Research Design ... 15
Participants ... 15
Instrumentation ... 16
Procedure ... 19
Methods of Analysis ... 19
Results ... 22
Descriptive Statistics ... 22
Cross-sectional Analysis ... 24
Conclusion ... 29
Mindset of STEM-teachers ... 29
Relation Mindset and Advice ... 30
Mediating Role Expectancies and Effort Beliefs in the Relation between Mindset and Advice ... 31
The Effect of Students’ Gender and Ethnicity on Teachers’ Expectancies and Advice ... 31
Differences in Expectancies and Advice between Teachers with a High and Low Score on Fixed Mindset. ... 32
Suggestions for Future Research ... 32
Content ... 32
Methodological Suggestions ... 33
Research Design ... 36
Practical Implications ... 37
Concluding ... 37
References ... 38
Attachment 1 ... 43
4 Abstract
In the Netherlands there is a great demand for technical employees. For that reason, The Dutch government initiates several activities in order to stimulate students for choosing a technical study profile, study and profession. Several factors influence these choices of students. Because teachers have a great influence on students’ choices and performances, we focused on the teachers’
expectancies and advices about the capabilities of students to follow a STEM study profile. Previous research showed that the mindset of teachers effects their expectancies of students. We investigated therefore the relation between the mindset of teachers and their expectancies and advice to students about following a STEM study profile. Combining the three concepts led to the following research question: What is the mediating role of expectancies in the relation between the mindset of teachers and the advice about the study profile? Because people with a more fixed mindset are sensitive to stereotypic thinking, we examined whether the gender and ethnicity of students influenced the expectations of teachers.
5 Introduction
Technical companies have an essential role in the Dutch economy; the technical sectors account for 40% of the national production and for about 66% of the exports. In addition, nearly 80% of the national expenditures which is spent on research and development is focused on this sector
(Volkerink, Berkhout, Bisschop, & Heyma, 2013). Every year, about 30.000 new technical employees are needed to respond to new technological developments (Ministerie van Economische Zaken and Platform Bèta Techniek, 2015; Rijksoverheid, 2013). To stimulate employees to work in the technical sector, the Dutch government initiates several initiatives to increase the number of technical
employees, but also to increase the number of technical students and the number of children that is choosing a technical study profile during high school (Ministerie Economische Zaken and Platform Bèta Techniek, 2015). Most interventions are targeting the students directly. However, several studies indicated that teachers have a great influence on the behaviour and achievement of students (e.g. Jussim & Eccles, 1992; Rosenthal & Jacobsen, 1968 as cited in Jussim & Harber, 2005). For this reason, this study is choosing a complementary angle: the influence teachers have on choosing for the technical field.
During high school, Dutch students already give direction to their (educational) career. During the third year of high school (9th grade) students of HAVO (higher general secondary education) and
VWO (pre-university education) choose a specific set of school subjects, called study profile. In order to stimulate the choice for STEM-related study profiles (science, technology, engineering and
mathematics), the above mentioned initiatives of the government are also focused on this moment of choice (VHTO, 2012). Namely, if students do not choose a STEM-related study profile at this moment, students restrict their career options to studies and function outside the technical field (Korpershoek, 2011). Van Langen and Vierke (2009) found that both student characteristics and classroom- and school characteristics play a major role in the choice for a specific study profile. Examples of important aspects are self-confidence in STEM-courses, the pleasure students experience with STEM-courses and the (estimated) talent in STEM-courses.
One of the factors that have been shown to influence students’ performances is teachers’ expectancies about students’ performances and potential development. In 1968, Rosenthal and Jacobsen presented a study that showed the relation between expectations of teachers and student’s performances. They found that high-expectancy students showed better performances than low-expectancy students. Also Miller and Turnbell (1986) showed that teachers’ expectancies were important in such a way that it influenced students’ performances.
A factor that has been shown to affect the expectancies of teachers is their mindset (Gutshall, 2013; 2014). A teachers’ mindset can be described as the implicit beliefs about the nature and malleability of intelligence (Blackwell, Trzesniewski, & Dweck, 2007). Dweck (2000) makes a distinction between a fixed and growth mindset. Whereas a person with a fixed mindset has the implicit belief that intelligence is fixed and cannot be developed, a person with a growth mindset has the implicit belief that intelligence is malleable and something that can be developed (Dweck, 2000). Research of Gutshall (2013) showed that the mindset of teachers was related to their expectancies about their students’ potential development. The study of Gutshall (2013) focused on students’ development in general. In the context of the choice for a (technical) study profile, it is relevant to investigate whether this relationship does not only apply to students’ development in general, but also for specific STEM-performances. Teachers express their expectations by means of an advice to a student when a student chooses a study profile. Hence, this advice of teachers can be seen as an indicator of their expectancies (De Boer, Bosker, & van der Werf, 2010).
6 potential to follow a STEM study profile and the advice teachers give to students about choosing a STEM study profile.
The expectations of teachers are generally influenced by students’ characteristics like gender (e.g. Lavy & Sand, 2015), previous performances (e.g. Timmermans, Kuyper, & van der Werf, 2015), ethnicity (e.g. Glock & Krolack-Schwerdt, 2013) or socioeconomic status (e.g. De Boer et al., 2010). As appeared from the study of McKnown and Weinstein (2002), teachers had different expectancies about their immigrant and native students. Another example: Lavy and Sand (2015) found that teachers graded girls’ answers on a math test lower than boys’ answers on the math test, although the performances of boys and girls were equal. These biases can be seen as stereotypic thoughts.
According to Dweck (2000), students with a fixed mindset are more likely to have stereotypical thoughts. Thus, the question arises if this also applies to teachers. And if yes, would teachers with a fixed mindset have different expectancies for students with different ethnical backgrounds or gender regardless of the equal level of achievement? Hence, it would be interesting to investigate if teachers with a fixed mindset do have different expectancies based on students’ gender and ethnicity.
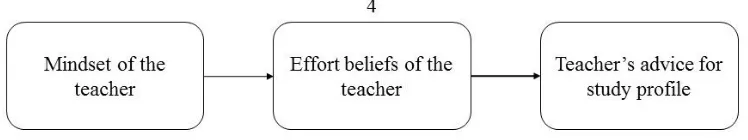
Blackwell et al. (2007) stated that students with a fixed mindset and a growth mindset have different beliefs about effort. These effort beliefs can be described as the extent to which one thinks that showing effort results in positive outcomes. For example, someone with strong positive beliefs believes that he or she can improve his or her STEM-grades with showing effort, although these grades are not high yet. If teachers have strong positive effort beliefs, it is plausible that they think students can improve their STEM-performances if they do their best. Hence, it is likely they are more tended to give students a positive advice regarding a STEM-study profile because they think students can improve their performances. On the other hand, teachers with strong negative effort beliefs think performances cannot improve by showing effort. It is likely that these teachers are more tended to give a negative advice regarding a STEM study profile because they think students cannot improve their STEM-performances. According to Dweck (2000), effort beliefs is a part of mindset. However, Tempelaar, Rienties, Giesbers, and Gijselaers (2015), stated that mindset and effort beliefs are two different concepts. They argued that someone with a fixed mindset can have both negative and positive effort beliefs. The same applies to someone with a growth mindset. Therefore, we will interpret effort beliefs as a mediating variable in the current study. Thus, we will investigate the relation between the teachers’ mindset and the advice they give to students about choosing a STEM study profile to students and how effort beliefs could influence this relationship.
In order to gain insight in the choice for the STEM field of students, van Aalderen and Walma van der Molen (2016) conducted a study that investigated the relation between the mindset of students and their STEM study choice. The current study is related to this topic, and will investigate the
mindset of teachers. Therefore, a questionnaire will be filled in by STEM-teachers teaching students of 3 HAVO and VWO or higher in order to measure teachers’ expectancies, mindset and effort beliefs. To get more insight, the goal of this research is (1) to investigate how the mindset of teachers is distributed, (2) to examine the relation between the mindset of teachers and the advice they give, and subsequently whether this relation is mediated by (3) teachers’ expectancies and (4) by the effort beliefs they have. Finally, it will be examined if (5) teachers with a strong fixed mindset are inclined to have different expectancies about students’ performances based on students’ gender and ethnicity.
Theoretical Framework Expectancies of Teachers
7 specific high school level is based on previous performances of students and the advice of teachers (Driessen & Doesborgh, 2005; PO-raad VO-raad, n.d.). Such advice can be seen as an expression of the teacher’s expectations about the future performances of students during high school (De Boer et al., 2010). Accuracy of these expectations is of great importance for optimal positioning within secondary education. To illustrate, a recent research of CBS (2016) showed that, in case of equal scores on the final test of primary school (CITO), students with highly educated parents were more likely to have a higher school advice for secondary education than students with lower educated parents. This indicates that advices for students can have a detrimental effect if teachers base this on false expectancies.
Students that choose for senior general higher education (HAVO) or pre-university secondary education (VWO) at secondary school have to make another choice during the transfer from the third to the fourth year. These students have to choose a specific study profile that they will continue during their educational career. The choice for this study profile is based on several aspects like
self-confidence, interest in the subjects, and the input of teachers and parents (Van Langen & Vierke, 2009).
Numerous studies showed that beliefs and expectations of teachers about their students affect the learning performances of students. Rosenthal and Jacobsen (1968, as cited in Jussim & Harber, 2005) presented the first study about the effect of the expectations of teachers about students’ performances on the performances of students. In this study, students were randomly assigned to a group with potential for intellectual growth or a group with no potential for intellectual growth. Although the performances of both groups of students were similar in advance, results from the post-test showed that students from the group with potential for intellectual growth had better performances than the group with no potential for intellectual growth. The explanation for these results was not the actual potential of the students, but the behaviour of the teachers based on their expectations. Although this study of Rosenthal and Jacobsen (1968) was heavily commented in the later years (e.g. Jussim & Harber, 2005), this study can be seen as one of the founders of research on the effects of expectations of teachers on the performances of students.
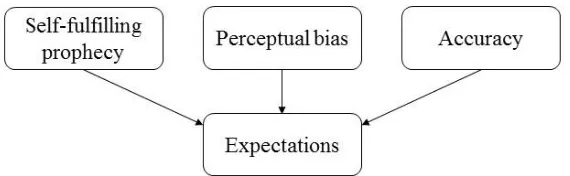
Jussim & Eccles (1992) also studied the expectations of teachers about their students. Here they distinguished three components of expectations: self-fulfilling prophecy, perceptual bias, and accuracy. The first component, self-fulfilling prophecy, reflects the behaviour of teachers that derives from the expectations they have of their pupils. These expectations determine the actions of the teachers and they will act to confirm these expectations. For example, if a teacher has high expectations of a specific student, he or she will deliver more support to this student in order to
confirm these expectations and stimulate the student to get high grades. Perceptual bias is the tendency to interpret results in such way that they match your expectations (Jussim & Eccles, 1992). This is a type of expectancy confirmation that is more situated in the mind of the teacher than the actual performance of students. For example, if a low-scoring student has a high grade for a difficult course, this can be attributed to chance and luck according to a negative view. With a more positive view, this can be attributed to effort and hard work. Lastly, accuracy refers to “successfully predicting
8
Figure 1. Components of expectations, adapted from Jussim & Eccles (1992). Besides studies that investigated the relation between teachers’ expectancies and students’
performances, research has been done about the relations between teachers’ expectations and teachers’ actions. Fennema, Peterson, Carpenter and Lubinsi (1990) studied the relation between teachers’ expectations and what attributions they make for students’ successes and failures. They found that teachers attributed successes and failures of boys to ability and successes and failures of girls to effort. Furthermore, Lavy and Sand (2015) found that the different expectations teachers have of boys and girls have positive effects on boys’ achievement and negative effects on girls’ achievement.
Expectancies of teachers are widely investigated, for example by Rosenthal and Jacobsen (1968, as cited in Jussim & Harber, 2005), Jussim and Eccles (1992), Jussim and Harber (2005), and Lavy and Sand (2015), However, only a small amount of studies, focused on the effect of teachers’ expectations and the advice they give their students regarding their educational career, was conducted in the Netherlands. Usually this advice was related to the transition from primary to secondary school. In previous studies, Mulder (1993) and Koeslag and Dronkers (1994) found that having positive expectations about students and pronouncing this, had a positive impact on the performances of students. This worked even if these positive expectations were not fully justified and actually
overestimated students’ capabilities. Research showed that students could fulfil these expectations and followed a higher learning level than they could manage in the first instance (Koeslag & Dronkers, 1994). A study of De Boer et al. (2010) also confirmed the positive effects of positive expectations, and stressed that positive expectations had more positive effects than negative expectations. The current study will focus on teachers’ expectations about students’ capability to follow a STEM study profile.
Mindset
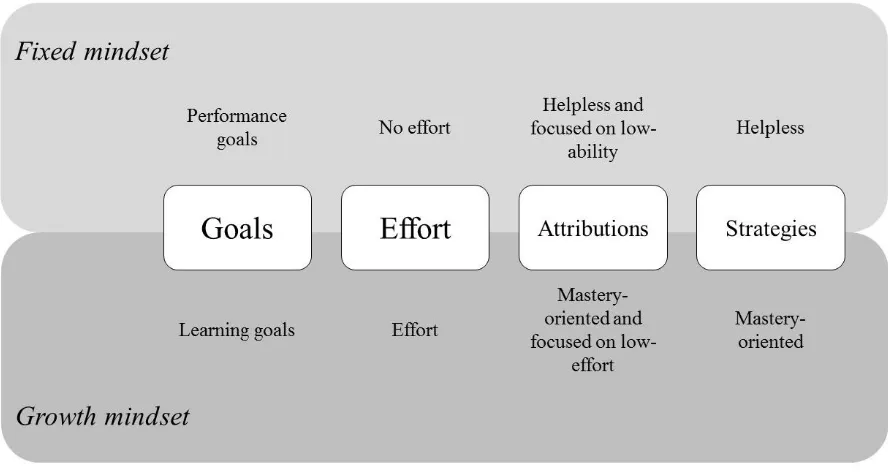
9 A second difference is that having a growth mindset is all about showing effort; through practice someone is capable to learn something. In comparison, someone with a fixed mindset thinks that showing effort is a confirmation of a lack of capacity (Blackwell et al., 2007; Dweck, 2000). A third difference mentioned is by Blackwell et al. (2007) and has to do with attribution. People with a fixed mindset often have helpless attributions in case of failing; they blame the failure to low ability. People with a growth mindset often have mastery-oriented attributions in case of failing; they blame the failure to low effort. Lastly, the fourth difference can be found in the strategies that are used to learn. People with a fixed mindset usually use helpless strategies in case of failing (e.g. withdrawing or repeating the strategy). Strategies of people with a growth mindset are usually mastery-oriented (e.g. increasing effort or changing strategies) (Blackwell et al., 2007). The four differences between having a fixed and growth mindset are shown schematically in Figure 2.
Figure 2. Differences between fixed and growth mindset based on Blackwell et al. (2007). Several studies investigated the effect of mindset on different educational variables and found that having a growth mindset can support students during their school time (See Blackwell et al., 2007; Crocker, Karpinski, Quinn, & Chase, 2003; Dweck & Molden, 2013; Hong, Chiu, Dweck, Lin, & Wan, 1999; Molden & Dweck, 2006). For example, these studies indicated that in contrast to students with a fixed mindset, students with a growth mindset had a higher score on self-esteem, they more appreciated their social groups, had more harmonious relationships with others, believed that performances can be improved by effort and had better educational achievements. Having a growth mindset seems to have an added value for the educational career of students.
Although the mindset of students is thoroughly investigated, less studies are conducted that investigated the mindset of teachers (Gutshall 2013; 2014). However, it is suggested that teachers’ mindsets affect their professional behaviour (Dweck, 2014; Gutshall, 2013; 2014; Swann & Snyder, 1980). Recent research of Gutshall (2013; 2014) mapped the mindset of teachers and indicated that teachers predominantly have a growth mindset regarding the general development opportunities and intelligence of students. Based on hypothetical student scenarios the researchers showed a significant relation between teachers’ general mindset and their expectations about the potential development opportunities of students. This means that, if teachers believe in general that skills and intelligence are developable, it is highly probable that they believe that their students can also develop their
10 ways in the current study. Both the mindset regarding intelligence in general and intelligence of students will be measured.
In 1980, Swann and Snyder (1980) studied the effect of teachers’ mindset on their didactic actions. The study showed that teachers who thought that intelligence is fixed and not developable, provided less support and ownership to their students. By contrast, teachers who believed that intelligence was malleable provided their students with more support and stimulated students to find their own answers. Similar studies were performed beyond an educational context. For instance, the study of Heslin, Vandewalle and Latham (2006) illustrated that managers with a growth mindset coached their employees more than managers with a fixed mindset.
The similarities between the above mentioned studies is that they all combined the constructs growth mindset and fixed mindset into one construct: mindset. Temperlaar et al. (2015) criticized this and chose to handle growth mindset and fixed mindset as two separate constructs. A first argument to use two separate constructs was the fact that previous studies showed correlations between scores on growth and fixed mindset from -.19 (Malmber & Little, 2007) to -.78 (Braten & Stromso, 2004). A second reason was the mediating role of effort beliefs in relations between the mindset and learning-related constructs. This is discussed further in the section effort beliefs. The current study follows the reasoning of Tempelaar et al. (2015) and will handle growth and fixed mindset as two single
constructs.
Effort Beliefs
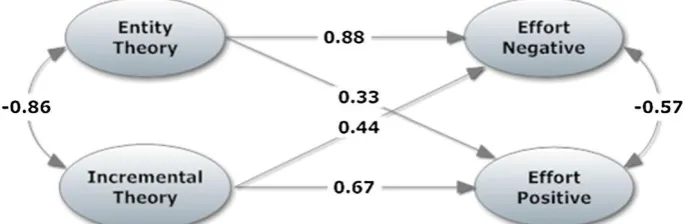
11 (seen as behaviour) is mediated by effort beliefs. This reasoning makes it possible that, even though they have a growth mindset, teachers could have negative effort beliefs and vice versa.
Figure 3. Path diagram with standardized estimates of the structural equation model relating mindset and effort beliefs, adapted from Tempelaar et al. (2015)
Student Characteristics
Accuracy of the expectations of teachers are important for the educational career of students
(Südkamp, Kaiser, & Möller, 2012, as cited by Timmermans et al., 2015). Although most teacher have quite accurate expectations (Jussim & Eccles, 1992; Jussim & Harber, 2005) there is still an ongoing debate about the possible consequences of inaccurate recommendations for the educational career of students (Timmermans et al., 2015). Here, it is not particularly about low expectations or an
expectation about a student that turned out to be wrong. It is about biased teacher expectations of specific subgroups or students (Timmermans et al., 2015). For example, these subgroups can be based on socioeconomic status (SES), age, gender and ethnicity (De Boer et al., 2010; Timmermans et al., 2015). Timmermans et al. (2015) found that teachers mostly base their expectations abouts’ students’ level on previous performances of students. Namely, they found that the variation in the expectations about students was determined on previous performances of students, for 80 %. However, the above aspects are of interest as well. For Example, McKown and Weinstein (2002) found in their study that teachers had lower expectations of students from stigmatized groups (African-American students versus white-American students and girls versus boys concerning math). Results of De Boer et al. (2010) showed that, among other things, previous performances, IQ, parents’ aspirations and SES affected expectations of teachers. Although they did not find a moderating effect for gender and ethnicity, a study of Lavy and Sand (2015) showed a significant effect of gender and ethnicity on the expectancies of teachers.
Stereotyping: students’ gender. The gender of students often leads to stereotypic thinking of both teachers and students. Several studies have been conducted investigating gender differences in performances. Keller and Dauenheimer (2003) performed a study where they divided male and female high school students over two groups. The first group was told that previous performed research showed gender differences in the scores of a math test, in disadvantage of girls. The second group was told that in previous research no differences in math-scores for gender were found. Notable, girls of the first group performed significantly worse than boys of the first group.
Apart from students (Jacobs & Eccles, 1992), the application of stereotypic thinking was also found by parents (Jacobs & Eccles, 1992; Yee & Eccles, 1988) and teachers (Fennema et al., 1990; Lavy & Sand, 2015; Tiedemann, 2000). The extent to which adults believe in stereotypic
performances, affects their expectations and attributions. If teachers believe in performance
12 Lavy and Sand (2015) studied the differences in teachers’ judgments about academic
performances of girls and boys. Participating teachers were divided over two groups. Both groups had to evaluate an exam. The first group of teachers did not know the gender of the students who took the test. The second group did know the gender of the students who took the test. The results showed that girls graded by teachers of the first group (gender unknown) scored higher than boys. By contrast, girls graded by teachers of the second group (gender known) scored lower than boys. According to this study, girls were graded lower than boys based on their gender (Lavy & Sand, 2015). Levy and Sand (2015) also suggested that these teachers’ biases of gender can have long term effects. For example, if students do not choose courses like math or science because teachers think they are not able to follow these courses, a career in the STEM field is ruled out as these courses are prerequisites for a STEM study.
Besides expectations for school performances, attributions for performances of boys and girls are affected as well. The attributional gender bias is the tendency to generate different attributions for school performances for boys and girls (Espinoza, Arêas de Luz Fontes, & Arms-Chavez, 2014). Teachers who believe that boys perform better in math than girls, have different attributions for the success. In general, if boys have great performance, it is devoted by talent. On the contrary, if girls have a great math performance, it is devoted to effort (Espinoza et al., 2014; Fennema et al., 1990; Yee & Eccles, 1988). These attributions are also evident in the feedback teachers give. Whereas teacher with stereotypic attributions praise girls mostly with non-intellectual feedback, they praise boys with intellectual feedback. An example of non-intellectual feedback is praising the neatness of an assignment. An example of intellectual feedback is praising the strategies the student used (Gunderson et al., 2011). Stereotypic attributions are most used for performances of middle-achieving students based on course grades. This may be because the performance of middle-achieving students is more ambiguous than obviously low- or high scoring students (Gunderson et al., 2011). Overall,
understanding the behaviour of teachers and how this affects school performances can help to change teachers’ (stereotypic) behaviour (Gunderson et al., 2011).
Stereotyping: students’ ethnicity. In the Netherlands, there is an ongoing discussion about the accuracy of teachers’ recommendations and the possible consequences of inaccurate
recommendations for the school careers of students (Timmermans et al., 2015). Besides gender, the variable ethnicity and socio-economic background are often referred. Several studies investigated the effect of ethnicity and socio-economic background on students’ school performances, with mixed results. Numerous studies did not find a structural bias against students from ethnic minority groups (e.g. Driessen & Doesborgh, 2005; Driessen & Smeets, 2007; Roeleveld, Driessen, Ledoux, Cuppen, & Meijer, 2011). On the other hand, several studies presented that ethnicity (e.g. Glock & Krolak-Schwerdt, 2013; Glock, Krolak-Krolak-Schwerdt, Klapproth, & Böhmer, 2013; Rubie-Davies, Hattie, & Hamilton, 2006) and the socio-economic background of students (e.g. De Boer et al., 2010;
Speybroeck, Kuppens, van Damme, van Petegem, Lamote, Boonen, & de Bilde, 2012; Timmermans, et al., 2015) are related to students’ performances. Besides, the meta-analysis of Tenenbaum and Ruck (2007) showed that expectations of teachers and the accompanied behaviour varied, dependent on the ethnic background of students (after controlled for previous performances).
13 Context
In the Netherlands, where high school is divided over several levels, both HAVO (higher general secondary education) and (VWO) (pre-university education) know two phases. The first three years have a regular program. After these three years, all students choose a specific study profile. Four profiles can be distinguished, where two profiles have STEM-related courses (Science, Technology, Engineering and Mathematics), namely Science and Health and Science and Technology. The other two profiles, Culture and Society and Economics and Society are more related to the social sciences (DUO, 2015).
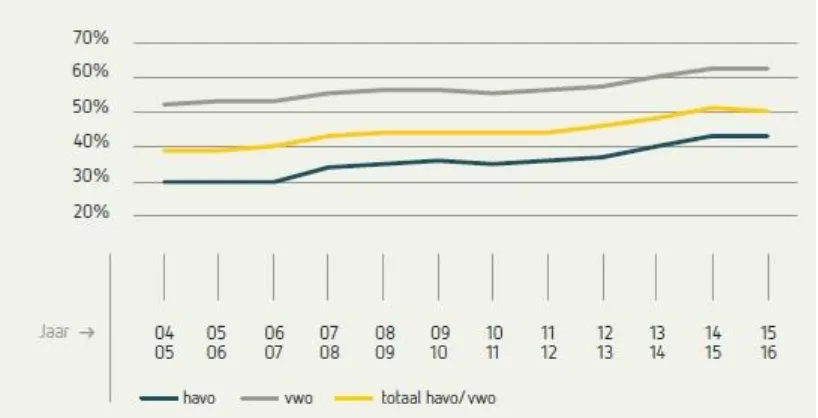
[image:14.595.94.503.304.513.2]Figures of Ministerie van Economische Zaken and Platform Bèta Techniek (2016) show that the amount of students that is choosing a STEM study profile has increased since 2004. During the school year of 2015/2016 43% of the HAVO students chose a STEM study profile. For VWO students this share was even bigger, namely 62%. The increase of the amount of students that chose a STEM study profile can be found in Figure 4. DUO (2015) made an overview of the division of study profiles between the two educational levels HAVO and VWO (See Attachment 1).
Figure 4. The amount of students from HAVO and VWO that chose a STEM study profile. From the figure above, it can be concluded that more and more students are choosing for a STEM-related study profile. Looking closer to the differences between boys and girls, the figures show that the distribution became more equal (See
14 Table 1. Increase of the amount of HAVO and VWO girls that is choosing a STEM profile relative to the total amount of students (DUO, 2015)
2005/2006 2015/2016
HAVO 35.0% 45.0%
VWO 46.0% 50.0%
The Current Study
In sum, while mindset and expectancies of teachers have been investigated previously, no relation has been made with the advice teachers give to secondary school students regarding the choice for a STEM study profile. The current study will build on the findings of Gutshall (2013; 2014). We
hypothesize that the teachers’ mindset is related to the advice they give to students whether to follow a STEM study profile, and that this relation is mediated by teachers’ expectations about the ability of students to follow a STEM study profile. As expectations are influenced by several (students) aspects, we will examine the influence of students’ gender and ethnicity on teachers’ expectancies. Combining all these concepts lead to two research models that are explained below (see Figure 5 and Figure 6).
Research Question and Model
To investigate the mindset of teachers a quantitative method will be used. Five research questions are formulated in order to guide the research. A summarizing model can be found in Figure 5 and Figure 6. First will be investigated how the mindset of teachers is distributed. Therefore the following research question is formulated:
1. How is the mindset of STEM-teachers shaped?
Because both the mindset regarding intelligence in general (personal mindset) and students’
intelligence (student-oriented mindset) will be measured, a sub-question is defined to get more insight in how these two mindsets are interrelated:
a. How is the personal mindset of teachers related to the student-oriented mindset? According to de Boer et al. (2010), the advice teachers give to students, can be seen as an expression of their expectancies. Gutshall (2013) found that the mindset effects the expectancies they have about their students. By combining these two findings, the following research question is posed:
2. What is the relation between the mindset of teachers and the advice they give to students with respect to choosing a study profile?
In order to study the relation between teachers’ mindset, expectancies and advice in detail,
expectancies will be used as a mediating variable for the relation between teachers’ mindset and the advice they give. Research question 2 and 3 are displayed in Figure 5.
3. What is the mediating role of expectancies in the relation between the mindset of teachers and the advice about the study profile?
Next to the mediating role of expectancies between mindset and advice, effort beliefs could mediate the relation between mindset and advice. This reasoning is based on Tempelaar et al. (2015), who found that someone with a growth mindset can have positive effort beliefs as well as negative beliefs. Therefore, effort beliefs could be interpreted as a mediating variable in the relation between mindset and advice. This expectation is inspired by the results of Chen and Pajares (2010). They found that effort beliefs mediated the relation between the mindset and task and performance approach of students. Giving an advice can also be seen as an action. Therefore, we conducted a second research model (See Figure 6), accompanied by the fourth research question:
4. What is the mediating role of effort beliefs in the relation between the mindset of teachers and the advice about the study profile?
15 stereotypical thoughts and have different expectancies for students based on students’ gender and ethnicity. The fifth research question of the study will be:
5. Do teachers with a strong fixed mindset have different expectancies about their students based on students’ gender and ethnicity?
Following on the fifth research question, with the last research question we will investigate whether teachers with a high score on fixed mindset and teachers with a low score on fixed mindset differ in their expectancies about students and advices to students. Therefore the last research question is posed:
[image:16.595.108.486.245.364.2]6. Do teachers with a strong fixed mindset have different expectancies about their students and give different advices to their students than teacher with a low score on fixed mindset?
Figure 5. Research model of research question 2 and 3
Figure 6. Research model of research question 4 Method
Research Design
For the proposed research we used a cross-sectional design, which was of quantitative nature (Babbie, 2010). A cross-sectional design is characterized by focusing on a specific group and measuring in one point of time. Although a longitudinal design (measurements for a longer period of time) could have delivered more information about the whole process, a cross-sectional design was more preferable for this study because of time-constraints (Bobbie, 2010). To gather information, we asked teachers that teach a STEM-course at a high school to fill in a digital questionnaire. To measure the expectancies of students’ STEM performances and the advice about choosing a STEM study profile, fictive student scenarios were conducted. To measure teachers’ mindset and effort beliefs, validated questionnaires were used. After gathering information, analyses were performed in the statistical program SPSS.
Participants
[image:16.595.113.487.408.478.2]16 students of higher general secondary education (HAVO) or third-, fourth-, fifth-, and sixth year
students of pre-university education (VWO). Teachers that did not teach STEM courses, only taught students from the first or second year or taught only students from preparatory general secondary education (VMBO) were excluded from this study. This was because they were not involved in the specific situation of choosing one of the four study profiles.
The sample consisted of 38 participants, (39.50 % men). The average age of the participants was Mage= 44.13 (SD = 9.98). The average teaching experience in years of the participants was M teaching experience= 13.12 (SD = 9.75) in September and October 2016. All participants worked at a high
school in the Netherlands. 97.40% had a Dutch nationality. An overview of the distribution of the teachers and their courses can be found in Table 2.
Table 2.
Demographical Background of the participants
Study year
Year 1 Year 2 Year 3 Year 4 Year 5 Year 6
14 12 23 28 22 18
Level of students
HAVO VWO
34 35
Teaching course
Biology Science Mathematics Physics NLT Informatics
7 8 14 6 1 2
Gender
Male Female
15 23
Teaching grade
First grade Second grade
24 14
Nationality
Dutch Other
37 1 (Italian)
Instrumentation
17 the study, questions about the demographic background of the participants were added to the
questionnaire.
The structure of the questionnaire was as follows: After an informed consent, the first part of the questionnaire was about the demographic characteristics of the participants. In the second part, teachers were presented with eight students scenario’s each describing a fictive student. For each scenario, teachers were asked to indicate their expectations about the student’s ability to follow a STEM study profile. Furthermore, they were asked to give their advice to this particular student. This was followed by a third part that included questions regarding the mindset of the participant. The last questions were about the effort beliefs of the teachers. The questionnaire ended with a short seclusion. Before distributing the questionnaire, it was checked by two employees of the University of Twente who were also teaching at a high school. All participants received the same questionnaire with the same order of questions and fictive student scenarios.
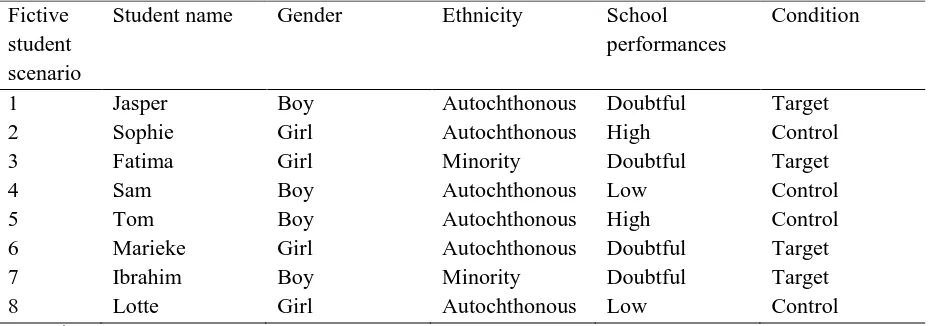
Fictive student scenarios. In the current study, we focus on the advice to students for whom it is unclear if they are able to follow successfully a STEM study profile. For example, this is the case for students with grades that are just sufficient, but are highly motivated. In these cases, the teacher’s advice depends on whether he/she see sufficient development opportunities. This invokes among other things the mindset of teachers. The questionnaire included eight hypothetical cases about students for whom the choice for a STEM study profile was still unclear. The student scenarios consisted of the following aspects: motivation, insight, scheduling, behaviour, study approach, wellbeing,
concentration, gender and ethnicity. Except for the last two concepts, the concepts were taken from the Dutch education monitoring system Magister. We tried to compose the scenarios in a similar way. This means that the eight scenarios were substantially the same, except for students’ gender and ethnicity. The student scenarios were divided over three categories. The target group consisted of two boys and two girls. One boy and one girl had an autochthonous ethnicity. The other boy and girl had a minority ethnicity. School performances were all equal for the four students. The target group
consisted of the students for who it is unclear whether they can handle a STEM study profile. The other two categories served as control categories. Control group 1 included two students (male and female) with low school performances. Based on their grades, a STEM study profile is not suitable. This group was added to confirm that students with low performances indeed received a negative advice. Control group 2 included two students (male and female) with high school performances. Based on their grades, a STEM study profile is suitable. This group was added to conform that students with high performances indeed received a positive advice. In Table 3 an overview of the fictive student scenarios can be found.
Student’s gender. The fictive student scenarios differed between genders, to study the effect of students’ gender. Four of the eight fictive students were male, the other four fictive students were female. Gender was indicated by the name and the photo of the fictive student.
Students’ ethnicity. The fictive student scenarios of the target group differed between
ethnicity. To measure the influence of students’ ethnicity. Two of the students of the target group were minority students, the other two fictive students of the target group were autochthonous students. The two control groups contained only autochthonous students. Ethnicity was indicated by the name and the photo of the fictive student.
18 the internal consistency was α= .89. The internal consistency of control group 1 and control group 2 was respectively α= .86 and α= .73. All alphas were indicated as good (Field, 2009).
Advice. The advice of teachers regarding choosing a STEM study profile was also measured by using the fictive student scenarios. Besides the expectancies concerning successfully following a STEM study profile, participants gave the fictive students a positive or negative advice for choosing a STEM study. For each student scenario, participants could explain their choice. The question
participants had to answer for each fictive student was: “I will recommend Jasper to choose a STEM study profile”. Participants could answer with ‘yes’ or ‘no’.
Mindset. The concept mindset was measured by 16 items that both measured the general mindset of teachers (eight items) and a domain-specific mindset: the mindset about intelligence of students (eight items).
Personal mindset. First the general mindset of teachers (i.e. personal mindset) was measured by eight items based on De Castella and Byrne (2015). These items referred to the development opportunities of intelligence in general. In line with Tempelaar et al (2015), the scores for fixed and growth mindset were measured and analysed separately. Four items were measuring the score on a growth mindset (α= .93). One of the questions was: “With enough time and effort I think I could significantly improve my intelligence level”. The other four items were related to a fixed mindset (α= .87). Both values of the alpha are good (Field, 2009). An example of a question was: “I don’t think I personally can do much to increase my intelligence”.
Student-oriented mindset. Next to the personal mindset, this study measured also the mindset of teachers when it comes to the STEM-intelligence of students. Because this study is conducted within a STEM-context, a mindset that is specifically focused on the STEM-performances of students, could have a distinct influence on the expectations of teachers. This division in the mindset is in line with a previous study of the mindset of students of Meijer (2016). The mindset of teachers regarding the STEM-intelligence of students (i.e. student-oriented mindset) was measured by seven items based on Dweck (2000). Four items were related to the score of a growth mindset (α= .59). One of these questions was: “I believe students can always change how well they perform in STEM-courses”. The remaining three items measured the extent of a fixed mindset (α= .35). An example of a question was: “I think students cannot change how well they perform in STEM-courses”. Both alphas were low (Field, 2009). Therefore, results from the analyses had to be interpreted with caution.
Effort beliefs. Beliefs about the utility of effort were measured by 11 items adapted from Blackwell (2002). We translated the original items of Blackwell (2002) into Dutch. Besides, we changed ‘you’ into ‘student’ and focused on STEM-performances. An example of an original question is: ‘If an assignment is hard, it means I’ll probably learn a lot doing it’. We adapted the question to: ‘If a math- or science assignment is hard, a student will probably learn a lot doing it’.
In line with Tempelaar et al. (2015), we measured and analysed effort beliefs separately from mindset. Besides, the scores on positive and negative effort beliefs were measured separately. Six items were focused on negative effort beliefs (α= .29) and five items were focused on positive effort beliefs (α= .54). Both Cronbach’s alphas were indicated as low (Field, 2009). In fact, such low alphas means that the constructs are not reliable to use. As we had no time to make adjustments in the questionnaire and distributed the questionnaires a second time, we used the constructs in the analyses. So, the results from the analyses have to be interpreted with caution. Two example questions
19 Procedure
The data collection took place from September 2016 till the end of November 2016. Before this data collection took place, participants from Dutch high schools had to be selected. In order to involve participants in the research, six Dutch high schools were visited in June 2016 and July 2016 to ask for participation. In total, seven schools accepted participation. Via a contact person from each
participating high school, teachers were asked to participate. The participation was voluntary and all participants could make the choice to perform the questionnaire by paper-and-pencil or via an online survey. Eventually, all 38 participants filled out the questionnaire via an online survey per e-mail on a self-chosen time. The questionnaire started with a written informed consent. The informed consent informed the participants about the purpose, risks and benefits, the process and the use of the results. After a written confirmation of participation, participants started with filling in the questions. Completing the questionnaire took about 20 minutes per person. All participants filled in the questionnaire personally and no help of the researcher was needed.
The research was performed according to the ethical guidelines of the University of Twente. Before the data collection started, an ethical form was filled out and approved by the ethical
[image:20.595.67.535.491.654.2]committee of the University of Twente. Because the participants were fully informed by the informed consent at the start of the questionnaire, a debriefing sessions was not necessary (Bobbie, 2010). In addition, the risk of stress or discomfort was minimal and the anticipating benefits of participating were higher than the risk. Also, there was no question of a relation of dependency between the researcher and the participants. The data was handled confidentially, as the names of the participants were not asked and the names of the high school were not used in any published or written material concerning the research. Only the researcher and the supervisors had access to the interview materials. Participants could pose questions or comments regarding the research to the researcher by sending an e-mail. All contact persons were given the option to receive the research report after completion of the research.
Table 3.
Overview of the fictive student scenarios*
Fictive student scenario
Student name Gender Ethnicity School performances
Condition
1 Jasper Boy Autochthonous Doubtful Target
2 Sophie Girl Autochthonous High Control
3 Fatima Girl Minority Doubtful Target
4 Sam Boy Autochthonous Low Control
5 Tom Boy Autochthonous High Control
6 Marieke Girl Autochthonous Doubtful Target
7 Ibrahim Boy Minority Doubtful Target
8 Lotte Girl Autochthonous Low Control
Note. *Displayed as the order of the questionnaire.
Methods of Analysis
20 investigate the relation between the scores on the fixed and growth mindset and the advice teachers gave to the fictive students in the target group. Before this multinomial regression analysis was performed, an ANOVA confirmed the differences in advice for the three categories (target group, control group 1, control group 2). A mediation analysis by using PROCESS was executed to
21
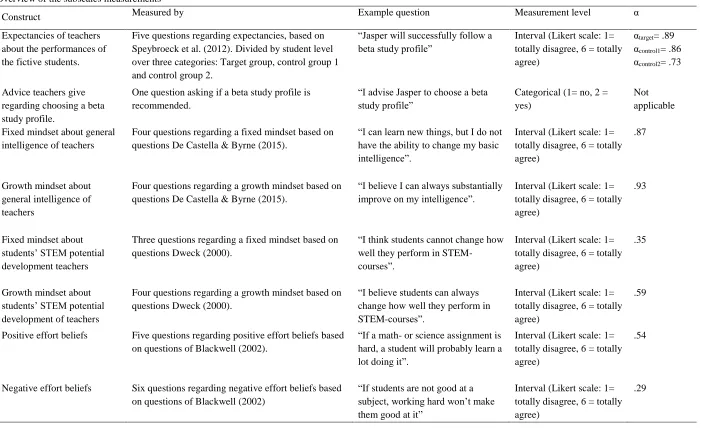
Table 4.
Overview of the subscales measurements
Construct Measured by Example question Measurement level α
Expectancies of teachers about the performances of the fictive students.
Five questions regarding expectancies, based on Speybroeck et al. (2012). Divided by student level over three categories: Target group, control group 1 and control group 2.
“Jasper will successfully follow a beta study profile”
Interval (Likert scale: 1= totally disagree, 6 = totally agree)
αtarget= .89 αcontrol1= .86 αcontrol2= .73
Advice teachers give regarding choosing a beta study profile.
One question asking if a beta study profile is recommended.
“I advise Jasper to choose a beta study profile”
Categorical (1= no, 2 = yes)
Not applicable
Fixed mindset about general intelligence of teachers
Four questions regarding a fixed mindset based on questions De Castella & Byrne (2015).
“I can learn new things, but I do not have the ability to change my basic intelligence”.
Interval (Likert scale: 1= totally disagree, 6 = totally agree)
.87
Growth mindset about general intelligence of teachers
Four questions regarding a growth mindset based on questions De Castella & Byrne (2015).
“I believe I can always substantially improve on my intelligence”.
Interval (Likert scale: 1= totally disagree, 6 = totally agree)
.93
Fixed mindset about students’ STEM potential development teachers
Three questions regarding a fixed mindset based on questions Dweck (2000).
“I think students cannot change how well they perform in STEM-courses”.
Interval (Likert scale: 1= totally disagree, 6 = totally agree)
.35
Growth mindset about students’ STEM potential development of teachers
Four questions regarding a growth mindset based on questions Dweck (2000).
“I believe students can always change how well they perform in STEM-courses”.
Interval (Likert scale: 1= totally disagree, 6 = totally agree)
.59
Positive effort beliefs Five questions regarding positive effort beliefs based on questions of Blackwell (2002).
“If a math- or science assignment is hard, a student will probably learn a lot doing it”.
Interval (Likert scale: 1= totally disagree, 6 = totally agree)
.54
Negative effort beliefs Six questions regarding negative effort beliefs based on questions of Blackwell (2002)
“If students are not good at a subject, working hard won’t make them good at it”
Interval (Likert scale: 1= totally disagree, 6 = totally agree)
22 Results
The current research aimed to investigate how the mindset of teachers was composed and how this was related to their expectancies of students and the accompanied advices they gave their students regarding the study profile. First, the goal was to identify the composition of both fixed and growth mindset of teachers and to analyse how these two mindsets differ. In addition we measured the relation between the personal mindset and the student-oriented mindset. The second goal was to determine the relationship between teachers’ mindset and the advice they gave to students. Thirdly, the mediating role of teachers’ expectancies in the relation between teachers’ mindset and their advice to students was analysed. In the same way, the mediating role of effort beliefs was measured for the relation between the mindset and the advice of teachers. Finally, the influence of students’ gender and ethnicity on teachers’ expectancies with a (high) score on fixed mindset was studied.
To answer the research questions, quantitative analyses were performed. First, general
descriptive statistics are presented. Thereafter cross-sectional analyses are discussed, structured by the research questions.
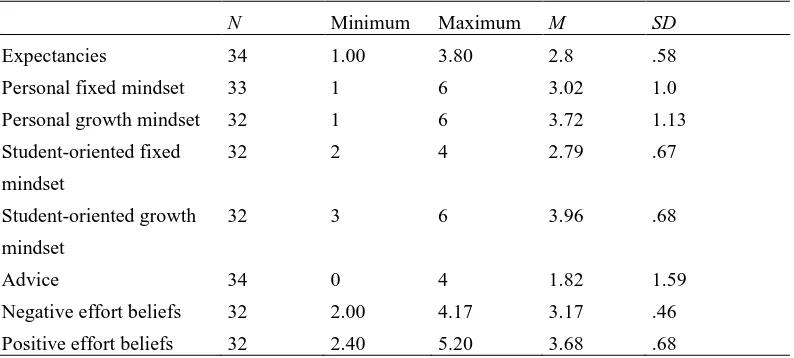
Descriptive Statistics
The descriptive statistics are presented in Table 5. The expectancies about students’ potential performances and advice about choosing a STEM study profile, were divided over three categories, based on students’ performances (target group, control group 1, control group 2). As expected, the mean score expectancies for control group 1 was the lowest with M = 1.64 (SD = .49), on a scale from 1 to 6, the mean score expectancies for the target group was M = 2.84 (SD = 0.58). The highest mean score for expectancies was for control group 2 (M = 3.17, SD = .33). A same distribution can be found for an advice (Mcontrol1 = .06, SD = .24; Mtarget= 1.82, SD = 1.59; Mcontrol2 = 2.00, SD = .00), on a scale from 1 to 4 for the target group and 1 to 2 for the control groups. Strikingly, the mean score of expectancies of control group 2 is still quite low while the mean score of advice is maximum. Results of the target group will be used for further analyses. The high standard deviation of mean score of the target group showed that there was a lot of variation in the advice and expectancies of the participants.
Participants had a mean score of M = 3.02 (SD = 1.10) on personal fixed mindset, on personal growth mindset they scored M = 3.72 (SD = 1.13). For oriented fixed mindset and student-oriented growth mindset these mean scores were slightly different. For student-student-oriented fixed mindset participants had a mean score of M = 2.79 (SD = .67) and for student-oriented growth mindset the mean score is M = 3.96 (SD = .68). Here, the difference was slightly larger. For all four constructs a maximum score of 6.00 was possible. The last two variables were effort beliefs. For negative effort beliefs, participants had a mean score of M=3.17 (SD = .46). For positive effort beliefs participants had a mean score of M = 3.68 (SD = .68).
Table 7 presents the correlations between the measured variables. I will mention some (marginal) significant correlations. If STEM-teachers had a growth mindset (both personal and student-oriented) they were less tended to have negative effort beliefs (r = -.42; r = -.44). By contrast, positive
correlations were found for personal fixed mindset and negative effort beliefs (r = .31) and for student-oriented fixed mindset and negative effort beliefs (r = .53). Correlations between mindset variables will be discussed in the next section about the mindset of teachers. Further correlations between the variables will be discussed in the section of cross-sectional analyses.
Mindset of teachers. The current study aimed to identify the mindset of STEM-teachers. Four categories of mindset were measured. The mean scores can be found in Table 5.
23 score on student-orientated growth mindset (r = .51). A positive correlation was also found for
personal fixed mindset and student-orientated fixed mindset (r = .62). We must keep in mind that the Cronbach’s Alpha from both student-oriented fixed and growth mindset was quite low. Results have therefore to be interpret carefully.
As the variables were continuous and not categorical, a paired-samples t-test was conducted to compare the scores of the personal mindset and student-oriented mindset for both fixed and growth mindset. Although the mean scores were slightly different, there were no significant differences in the growth mindset between the personal (M = 3.72, SD = 1.13) and student-oriented mindset (M = 3.96,
SD = .68); t(31) = -1.40, p = .17. Also for fixed mindset no significant difference was found between the personal mindset (M = 3.06, SD = 1.10) and student-oriented mindset (M = 2.79, SD = .67); t(31) = 1.80, p = .08.
[image:24.595.73.470.411.590.2]Expectancies. An ANOVA with repeated measures is performed in order to confirm that the expectancies for the three groups differed significantly. Using an ANOVA with repeated measures with a Greenhouse-Geisser correction, the mean scores for expectancies were statistically significantly different (F(1.80, 59.59) = 172.24, p < .01). Post hoc tests using the Bonferroni correction revealed that expectancies for the target group (M = 2.83, SD = .10) and control group 1 (M = 1.64, SD = .08) were significantly different (p < .01). Also the mean scores of expectancies between the target group and control group 2 (M = 3.18, SD = .06) differed significantly (p < .05). Lastly the mean scores for control group 1 and control group 2 were significantly different (p < .01). So, this analysis showed that the expectancies for the three groups differed significantly.
Table 5.
Descriptive statistics
N Minimum Maximum M SD
Expectancies 34 1.00 3.80 2.8 .58
Personal fixed mindset 33 1 6 3.02 1.0
Personal growth mindset 32 1 6 3.72 1.13
Student-oriented fixed
mindset
32 2 4 2.79 .67
Student-oriented growth
mindset
32 3 6 3.96 .68
Advice 34 0 4 1.82 1.59
Negative effort beliefs 32 2.00 4.17 3.17 .46
Positive effort beliefs 32 2.40 5.20 3.68 .68
Advice. In order to confirm the differences in advice between the two control groups and the target group a one way ANOVA with repeated measures was performed. Before the ANOVA with repeated measures was conducted, the variable advice was changed from a dichotomous variable into a continuous variable. This change has been made to perform further analyses. Although advice was originally a dichotomous variable (positive advice vs. negative advice) because this relates to reality, for analyses we needed a continuous variable. The variable advice can now be interpreted as a mean score that indicates the tendency towards a positive advice instead of ‘yes’ or ‘no’. M = .0 means that no positive advices were given, M = 1.0 means that all advices were positive.
24 .46, SD = .40) significantly differed from the mean scores of advice from control group 1 (M = .0.3,
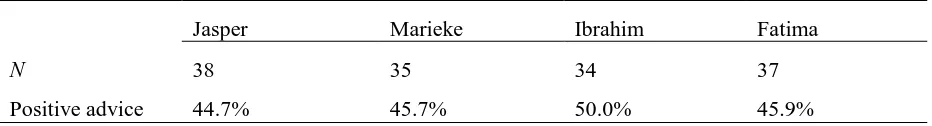
[image:25.595.66.532.237.300.2]SD = .12) and the means cores on advice between the target group and control group 2 (M = 1.0, SD = .00) (p < .01, p < .01, respectively). Also, the mean scores for control group 1 and control group 2 were significantly different (p < .01). These results confirmed that the three groups based on the student scenarios were sufficiently distinctive. Table 6 shows the percentages of the positive advices the students of the target group received. The percentages showed that the ratio of positive and negative advice for this group was substantially equal. So indeed, there were doubts about the advices that are given.
Table 6.
Positive advice for choosing STEM study profile
Jasper Marieke Ibrahim Fatima
N 38 35 34 37
Positive advice 44.7% 45.7% 50.0% 45.9%
Table 7.
Bivariate correlations between the variables
1. Per son al f ixed m in dse t 2. Per son al g row th m in dse t Stude n t-or ien ted Fixe d m indse t 3. Stude n t-or ien ted g row th m inds et 4. Expect anc ies 5. A dvi ce doub t 6. N ega ti ve ef for t bel ief s 7. Posi ti v e e ff o rt bel ief s 1.
1 -.82** .62** -.43* -.33Ϯ -.15 .31 Ϯ -.30 Ϯ
2.
1 -.63** .51** .24 .12 -.42* .22
3.
1 -.63** -.12 -.31 Ϯ .53** -.05
4.
1 .10 .22 -.44* .28
5.
1 .56** -.22 .33
6.
1 -.42* .28
7.
1 -.23
8.
1
Note. ** Correlation is significant at the .01 level (2-tailed). * Correlation is significant at the .05 level (2-tailed). Ϯ = Marginal significant
Cross-sectional Analysis
25 mindset of teachers and the advice they gave to students will be discussed (RQ 2). Subsequently, research questions three, four, five and six are answered.
The relation between teachers’ mindset and the advice to students. To examine the relation between the mindset of the teachers and the advice they give to students, four simple linear regression analyses were performed. It would be logical to use a multiple regression analysis in order to test the relation between the several mindset variables and the dependent variable advice. This is because the variable advice was a categorical variable. However, using a multiple regression analysis requires some conditions. First, a multiple regression analysis requires a data set with many
participants. As we had less than 40 participants in the current study, using a multiple regression analysis was difficult. Second, when using a multiple regression analysis, no high correlation between the dependent variables is allowed. This is because SPSS cannot distinguish the variables. Our descriptive statistics showed that there are some strong, significant relations between the mindset-variables. Third, in order to measure the mediating effect of effort beliefs on the relation between mindset and advice, we adapted the categorical variable advice into a continuous variable to perform the analyses. To stay consistent, it would be logical to interpret the variable advice as a continue variable as well in the regression analysis. Based on these three reasons, we choose to the simple linear regression analysis to measure the relations between the mindset variables and the advice of teachers. As we have four mindset variables, we performed for each variable a linear regression analysis.
To interpret the results of the linear regression analysis, a couple of values are of interest. First, we look to the R-value. This value indicates the degree of correlation between the mindset variable and the variable advice. R2 indicates how much of the total variation in the variable advice can be explained by the mindset variable. The F-value indicates that the regression model predicts the dependent variable significantly well or not. The p-value indicates whether the regression model statistically significantly predicts the outcome variable or not. Lastly, we can use the coefficient (b). This value determines whether the mindset variable contributes statistically significantly to the model.
No significant regression was found for personal fixed mindset (F(1, 31) = .69, p = .41), personal growth mindset (F(1, 30) = .43, p = .52), student-oriented growth mindset (F(1, 30) = 1.53, p
[image:26.595.72.524.703.763.2]= .23) and student oriented fixed mindset (F(1, 30) = 3.26, p = .08). The p-value of student-oriented fixed mindset is lower than 1.0. Therefore we could speak of a trend. However, the Cronbach’s alpha was insufficient. Therefore, there is no mention of a reliable effect or trend. The R-values, R2-values and b-values are presented in Table 8. All R-values are quite low, which implies that there is only a small correlation between the mindset and the advice. The same applies for the R2-values. The mindset variables explain only a little variation in the advice scores. Lastly, the b-values represent the change in the outcome advice from a change in the predictor mindset. Although all b-values are different from 0, the values are quite low. Notable, the b-values of personal fixed mindset and student-oriented fixed mindset are negative. This implies that, when the value of the predictor mindset becomes bigger, the value of the outcome advice becomes smaller. All b-values were not significant at a .05 level. The results of the linear regression analyse show that the mindset of teachers had no significant influence on the advice they gave to the students.
Table 8.
Linear regression analysis (N = 38)
R R2 b
Personal fixed mindset .15 .02 -.05
Personal growth mindset .12 .01 .04
26
Student-oriented growth mindset .22 .05 .13
The mediating role of expectancies in the relation between mindset and advice. The third research question entails the mediating role of expectancies in the relation between the mindset of teachers and the advice about the study profile. With a mediation analysis the mediating role of expectancies on the relation between mindset and advice can be studied. Because no significant relation is found between mindset and advice, a mediation analysis is unnecessary. Yet, the analysis has been conducted and described below in order to show which steps should be taken.
In order to confirm the mediating variable expectancies, first it has to be showed that while the mediator expectancies is caused by the independent variable mindset and is a cause of the dependent variable advice, the initial independent variable mindset lost significance when the mediator
expectancies is included in the model (Elite Research LLC, 2013). To execute the mediation analysis, four steps are performed.
1. Confirm the significance of the relationship between the initial independent variable mindset and the dependent variable advice.1
2. Confirm the significance of the relationship between the initial independent variable mindset and the mediator expectancies.
3. Confirm the significance of the relationship between the mediator expectancies and the dependent variable advice in the presence of the independent variable mindset.
4. Confirm the insignificance or reduction in effect of the relation between the initial independent variable mindset and dependent variable advice in the presence of the mediator expectancies.
First the mediation analysis was executed for the mediating role of expectancies. Thereafter, the mediation analysis was executed for the mediating role of effort beliefs. The mediation analyses are only performed with the personal fixed and growth mindset because student-oriented fixed and growth mindset have an insufficient Cronbach’s alpha.
Mediation of expectancies between fixed mindset and advice. In step 1 of the mediation model, the regression of the score on fixed mindset on the advice, without the mediator was not significant, b = -.21, t(31) = -.83, p = .41. Conversely, step 2 showed that the regression of the score on fixed mindset on the mediator, expectancies, was marginal significant, b = -.17, t(31) = -1.94, p = .06. Step 3 of the mediation process showed that the mediator (expectancies), controlling for the score on fixed mindset, was not significant, b=.1.52, t(30) = .23, p = .82. Also step 4 of the analyses
revealed that, controlling for the mediator (expectancies), fixed mindset was not a significant predictor of advice, b = .04, t(31) = .23, p = .82. The Sobel test confirmed that there was no full mediation in the model (z = -1.65, p = .10). Overall, it was not found that expectations mediated the relationship between the score on fixed mindset and the advice teacher give to students regarding the study profile.
Mediation of expectancies between growth mindset and advice. In step 1 of the mediation model, the regression of the score on growth mindset on the advice, ignoring the mediator was not significant, b = .17, t(30) = .66, p = .52. Step 2 showed that the regression of the score on growth mindset on the mediator, expectancies, was not significant, b= .12, t(30) = 1.32, p = .20. Step 3 of the mediation process showed that the mediator (expectancies), controlling for the score on growth mindset, was significant, b= 1.49, t(29) = 3.45, p < .01. However, step 4 of the analyses revealed that, controlling for the mediator (expectancies), growth mindset was not a significant predictor of advice, b
= -.01, t(30) = -.06, p = .95. Subsequently, a Sobel test was conducted and found no full mediation in
1 In fact, the previous analysis (linear regression analyses) already confirmed that there is no significant effect of