UNIVERSITY OF TWENTE
Master of Science Thesis
Service and Change Management
Business Administration
“Humor in Meetings : Does it affect their Effectiveness?”
K.B.M. Beerens
University of Twente, The Netherlands
Supervisors University:
Prof. Dr. C.P.M. Wilderom
A.M.G.M. Hoogeboom
March, 2016
2 Title “Humor in Meetings: Does it affect their Effectiveness?”
Author K.B.M. Beerens (s0187828)
Master of Science Business Administration Service & Change Management
Faculty of Bahavioral, Management and Social Sciences Department Change Management & Organizational Bahavior University of Twente
Date
23 March 2016
Supervisors
3 TABLE OF CONTENTS
AKNOWLEDGEMENTS ………. 5
ABSTRACT……… 6
INTRODUCTION……… 7
THEORY AND HYPOTHESES………. 8
Team Effectiveness………. 8
Leader Effectiveness……….. 9
Transformational Leadership Style……….. 10
Transactional Leadership Style………... 10
Humor………. 11
Hypotheses 1-3……… 14
Hypotheses 4-6……… 15
METHODS……… 16
Sampling & Data Collection……… 16
Measures……….. 16
1. Survey Data……… 16
2. Video Data……… 18
Control variables……….. 19
Data Analysis……… 19
RESULTS……… 20
Preliminary analysis……… 20
Hypothesis testing……… 20
Residual Analyses………. 21
DISCUSSION………. 22
Practical implications……….. 23
Strengths, limitations and future research directions……….. 24
CONCLUSION……….. 26
REFERENCES……….. 28
APPENDIX 1:……….. 40
APPENDIX 2:……… 42
4
TABLE 1:……… 44
TABLE 2:……… 45
TABLE 3: ……… 46
APPENDIX 4:……… 47
APPENDIX 5:……… 47
APPENDIX 6:……… 48
5 ACKNOWLEDGEMENTS
Completing this master thesis means the end of my study Business Administration, Change Management and Organizational Behavior. For this thesis I dedicated myself almost a year to effective behaviors, leadership and teams. I would not have been successful without the chances and support of Mrs. Prof. Dr. C.P.M. Wilderom. Thank you for giving me the opportunity to be part of the ‘Leadership Lab’, and your open-minded and inspiring vision toward new ideas. I would also thank Mrs. A.M.G.M. Hoogeboom for the contributing ideas and constructive feedback.
A special thanks for Marlies Kleinsman for the pleasant collaboration and your helpfulness of the past year. We shared frustrations and setbacks, but there was also a lot of positivity and humor. Sometimes we made the joke, with our group of master students, that the whole ‘codebook’ passed in one day.
6 ABSTRACT
The use of humor in organizations is an under-researched topic. Humor is an important element of human interaction and therefore has an impact on how workgroups operate effectively and subsequently on organizations. However in the literature, empirical research within the team context is scarce. Humor is an important contributor to group productivity because of its positive effect on group cohesiveness, communication and creativity, hence it seems a ‘valuable behavior’ in organizations. In this study we do not only examine the direct effect of humor on team
effectiveness, but also investigate the sequences of behaviour after humor is displayed. During regular staff meetings, 79 leaders and their followers were video-taped, and their behaviors were coded by two independent raters. Because we were interested in
Leader-Follower and Leader-Follower-Leader interaction sequences, we analysed interaction sequence tables in order to determine how often ‘humor’ was followed by other behavior. Three categories of chain-reactions are distinguished: Humor – Humor, Humor- Transformational Style, Humor – Transactional Style. The effectiveness scores were obtained through survey data among leaders and followers. Results indicated that a transactional (TAL) reaction of the leader on humor behavior of a follower, can decreases team effectiveness significantly. On the other hand, humor displayed by the leader ‘works’ only, when the follower reacts with transformational behavior (TLS); As hypothesized, the combination Leader Humor – Follower TLS, was positively
significant for team effectiveness.
7 INTRODUCTION
The use of humor in organizations is an under-researched managerial topic. Although it has been suggested from previous literature, that humor may be a valuable ‘behavior’ in
organizations, empirical data investigation into the effects of humor on performance has yielded sparse data (Duncan, 1990). “Humor is a tool to study the social forces in an organization
because the content and form of humor reflect social relations, power distributions and changes in both” (Decker & Rotondo 2001; p.1). Moreover, humor is an important element of human interaction and triggers positive socio-emotional communication, procedural structure and new solutions. (Lehman-Willenbrock & Allen, 2014; p.1). Humor can be observed in a social setting, like a team context, and regular staff meetings are pre-eminently suitable to investigate
interaction processes.
Humor is also often discussed as an important characteristic associated with leadership (Bass, 1990; Shamir, 1995), but empirical research examining humor and leadership are limited (Avolio et al., 1999). The purpose of this study is to contribute to the literature of team- and leader effectiveness, by offering new insights in the role of humor. Dwyer (1991) noted that the effectiveness of humor also depends on the ‘status’ of its initiator, target, and audience.
Therefore it is important to study both leaders and followers.
With The Multifactor Level Questionnaire (MLQ), we examine the effectiveness scores as perceived by leaders and followers. The systematic approach of video-based coding (Wilderom, Klaster, Ehrenhard & Hicks, 2010) of leader and follower behaviors provides us with the
8 We contribute to the literature in the following ways. While earlier research focused mainly on the role of humor on an individual level, this study investigated humor within its social context. Humor is considered as a part of interaction patterns, which also provides insights in effective or ineffective reactions on humor behavior. Second, this study connects humor and performance, by measuring the leader- and team effectiveness.
THEORY AND HYPOTHESES
Team Effectiveness
A team is defined as a group which is restricted in size and works together interdependently based on common overarching objectives in order to achieve its common goals (Cameron & Green, 2012). Usually, the different members of the teams are mutually dependent on each other (Spencer, 1993). Numerous definitions of groups, teams, and other forms of collectives are composed over the years. Given that the focus of this study is on work teams, we adopt the definition advanced by Kozlowski and Bell (2003; p. 334):“Teams are collectives who exist to perform organizationally relevant tasks, share one or more common goals, interact socially, exhibit task interdependencies, maintain and manage boundaries, and are embedded in an organizational context that sets boundaries, constrains the team, and influences exchanges with other units in the broader entity.”
In 1964, McGrath advanced an ‘input-process-outcome’ framework for studying team effectiveness. The inputs include ‘individual team member characteristics’ (e.g., competences, personalities), ‘team-level factors’ (e.g., task structure, external leader influences) and
‘organizational and contextual factors’ (e.g., organizational design features, environmental complexity). The inputs enable and constrain members ’interactions, the processes describe members’ interactions toward task accomplishment and the outcomes are the results and by-products of team activity. Within the outcome, there’s a distinction between the performance (e.g., quality and quantity) and members’ affective reactions (e.g., satisfaction, commitment, viability). Moreover, Cohen and Bailey (1997) emphasize the ‘process-stage’ and developed a model of group effectiveness which links the external influential factors to effectiveness, and specify the ‘process-stage’ into external processes, internal processes and group psychological traits.
9 Salas & Morgan, 1989; Stout, Cannon-Bowers, Salas & Milanovich, 1999). ‘Taskwork’ describes functions that individuals must perform to accomplish the team’s task, and ‘teamwork’
describes the interaction between team members (McIntyre & Salas, 1995). In line with these findings, Waller, Gupta and Giambatista (2004) emphasizes ‘teamwork’ and suggest that specific interaction patterns between team members (groups dynamics) enhances team effectiveness. Instead of two dimensions, Marks et al. (2001) categorized team processes into three
superordinate categories: transition phase (members concentrate on mission analysis, planning, goal specification and strategies), action phase ( members focus on task accomplishments, monitoring progress and systems, coordinating team members) and the interpersonal phase (conflict management, motivation, confidence building).
Leadership plays an important role in all of these three phases and is one of the most important factors within interaction patterns (Kahai, Sosik, & Avolio, 1997; Tarricone & Luca, 2002). Hence, it is important to understand the exact role of leaders within team interaction processes, in order to explain which team processes and specific interaction patterns enhances team effectiveness.
Leader Effectiveness
Leader effectiveness refers to judgements about a leader’s impact on individual, team or organizational performance. In most studies ‘ratings’ are used to evaluate the individual leader (Hogan, Curphy & Hogan, 1994). However, Yukl (2012) advocates that behaviors which are important for leadership effectiveness are explained better by theories about group/team performance and organizational performance than leadership theories focused on individual leaders or followers. According to Hogan et al (1994), “The key to a leaders’ effectiveness is his or her ability to ‘build’ a team” (p.16). Other scientists stated: ‘Leaders have the primary
responsibility for a successful team and play a critical role’ (Zaccaro et al., 2001), and Chemers (2001) indicate that effective leadership is to maintain that a group is cohesive, motivated and directed. But these terms are relative subjective, unspecified, and therefore difficult to bring into practice and hard to measure. A little more specific, important leadership functions are: ‘the developing and shaping of team processes’, and ‘monitoring and managing of team performance’ (Fleishman et al., 1991; Kozlowski & Bell, 2003). Hallam and Campbell (1992) went a step further and have related leader effectiveness to team performance and identified eight
10 organize, coordinate work activities, and acquire needed resources. Two involve team
maintenance: minimize and resolve conflicts among group members, and ensure that team members understand the team’s goals, constraints, resources and problems. These ‘team building’ tasks are in line with the leader behaviors developed by Yukl et al. (1990).
In order to maintain a high performing team, leaders use different motivational strategies and techniques. The transformational- and transactional leadership style are frequently used, and components of both are essential for guiding a team or organization to success. In addition, team processes play a crucial role in establishing team effectiveness, but the formally
responsible for developing and shaping these team processes is the leader.
Transformational Leadership Style: Prior leadership studies have consistently shown a positive link between the transformational leadership style (TLS) and leader effectiveness (Lowe, Kroeck & Sivasubramaniam, 1996; Bass, Avolio, Jung & Berson 2003; Judge & Piccolo, 2004; Yukl, 2010). Transformational leaders are leaders who motivate their followers to exhibit extra effort and to look beyond their self-interest (Bass, 1990) They build personal and social identification among followers, resulting in enhanced commitment and performance of their followers (Bass et al., 2003). The four dimensions of transformational leadership are: idealized influence, inspirational motivation, intellectual stimulation, and individualized consideration (Bass, 1999). Idealized influence is also referred to charisma, and consists of two scales: ‘idealized influence behaviors’ and ‘idealized influence attributed’ (Bass,1999). Idealized influencing- and inspirational leaders motivate followers by inspiring them with a vision of the future and behave themselves charismatic, in such a way that followers can identify themselves within the leaders vision and goals. With intellectual stimulation, the leader challenges followers to be creative, innovative and facilitate them in solving problems. Individual considerate
behavior of leaders refer to paying attention to individual needs for achievement and growth by acting as a mentor or coach (Bass & Avolio, 1995; Bass, Avolio, Jung & Berson, 2003; Judge & Piccolo, 2004). Transformational leaders can make an important contribution to both team and organizational performance. Members of transformational teams inspire and stimulate each other, which makes them a highly performing team (Bass, 1999).
11 follower takes place to achieve routine performance goals. The second behavior (MBE) can take an active or passive form. With ‘active management by exception’, the leader actively monitors the work, watch deviations from rules and standards and takes corrective actions to prevent mistakes. With ‘passive management by exception’, the leader intervenes only when standards are not met, or when critical problems arise. The main difference between MBE-A and MBE-P, is the moment of intervention (Howell, Avolio, 1993). In this study we concentrate on the
contingent reward dimension and the MBE -active part of dimension two.
One of the core arguments made by Bass (1985) was that transformational leadership would account for a greater share of variance in performance outcomes when compared with some traditional transactional styles of leadership. So in this study we focus on both transformational- and transactional leadership style. The Multifactor Level Questionnaire (MLQ) is the most
frequently used instrument to rate effectiveness of a leader by measuring the degree of both, transformational and transactional, styles (Judge & Piccolo, 2004).
As described, reflected from the existing literature, it can be concluded that effective leadership (transformational- or transactional style) contributes to team effectiveness.
With this study we aim to explain both; leader- and team effectiveness.
Humor
Humor is regarded as a basic element of human interaction (Romero & Cruthirds, 2006) and therefore has an impact on workgroups and organizations. This behavior is rarely included in behavioral taxonomies, such as the TLS and TAL paradigm (Judge & Piccolo, 2004). According to Martineau (1972), humor is “any communicative instance which is perceived as humorous”, and consists of non-verbal and verbal communications which produce a “positive cognitive or
affective response from listeners” (Crawford, 1994). Our focus is on ‘verbal communications’, such as joking and laughing, but in the literature the distinction is frequently indefinite. For example, Romero and Cruthirds (2006) defined organizational humor as “amusing
communications that produce positive emotions and cognitions in the individual, group, or organization”, which entails vagueness about differences between verbal- and non-verbal interaction.
12 humor, a mechanism of dealing with stress. People who exhibit self-enhancing humor have a positive perspective/ humorous view of life, and the initiators intention is to enhance his/her image relative to others in the group. (3) Aggressive humor. Individuals who employ aggressive humor aim to manipulate others by means of an implied threat of ridicule (Janes & Olsen, 2000). (4) Self-defeating humor, utilized by people who ridicule themselves in an attempt to amuse and seek acceptance from others (Martin et al., 2003). The third (and fourth) style of humor shows a more malicious side of the intention of humor, and similar to that ‘The superiority model of Humor’ (Foot, 1986; Moreall, 1987) is based on the notion that humor can be used to ridicule and make others feel inferior in order to feel superior oneself (Zillman & Stocking, 1976). In line with this, Martineau (1972) involved both sides and noted that humor can on the one hand function to facilitate social connections and engender positive responses (positive humor), but it can on the other hand function as a social abrasive, creating friction and conflict within a social group and leading to negative reactions (negative humor). Because negative humor (i.e. humor that induces negative feelings) counteracts the team processes essential for team effectiveness, in this paper we explicitly refer to positive humor.
Positive humor is an important contributor to group productivity because of its positive effect on group cohesiveness, communication (Duncan, 1982), creativity (O’Quin & Derks, 1997), and stress reduction (Moreall, 1991). Thus humor is more than just a funny concept, it may be a valuable management tool in organizations that can be used to achieve many objectives. It can strengthen collegiality (Vinton 1989; Hay 1995; Ehrenberg 1995; Clouse & Spurgeon 1995), soften an instruction or criticism (Cox et al. 1990; Moreall 1991; Ross 1992; Barsoux 1993), and release tension (Coser 1960; Consalvo, 1989).
13 However, the use of humor in organizations and the effects on group processes is an under-researched topic. So, in this study the focus is on interaction (group) processes instead of individual processes and effects.
During regular staff meetings all team members interact with another, which makes it the ideal context for studying humor, as well as many other team interaction processes (Kauffield & Lehman-Willenbrock, 2012; Lehman-Willenbrock, Meyers, Kauffield, Neininger, & Henschel, 2011). Because, as already mentioned, humor is ‘a basic element of human interaction’ and interaction is a reciprocal action or influence, we suspect that humor has more effect in combination with a similar positive reaction. Humor in team meetings is embedded in verbal interactions by different team members, and an unique opportunity for examining humor-reaction patterns. When a team member makes a humorous statement, he/she invites others to react. Within this study we restricted ourselves to verbal communication, and humor is coded when a team member makes a joke to another team member (on a friendly/kind way). Also, laughing about jokes and stories by team members is coded as humor.
The lag sequential analysis (Sackett, 1979, 1987) has become an important tool for
researchers of interpersonal interaction. Because we were interested in Leader-Follower and Follower-Leader interaction sequences, we used parts of this analysis strategy. First, we generated interaction sequence tables, in order to determine how often one specific behavior (humor) was followed by another behavior (Lag 0 – Lag 1). Lag 1 is the direct reaction on the initiator (Lag 0). Based on these frequency matrices, we derived transition probabilities (the probabilities that a specific behavior (lag 1) occurs after a particular behavior (lag 0) within in the interaction process (Benes, Gutkin, & Kramer, 1995).
From the video data, very specific behaviors were obtained, but we are also interested in reactions derived from the two leadership styles TLS and TAL. These styles contain different observed behaviors and therefore broader categories were composed. In designing the
categories, the structure of the MLQ is followed, and for this study we bundled agreeing, positive feedback, intellectual stimulation and individualized consideration as TLS (transformational style). We included humor and personally informing into this category as well, because these behaviors are also very relation-oriented. Providing negative feedback, directing/correcting and verifying is bundled as TAL (transactional style).
14 not understand how and when humor really contributes to team performance. With the
transition probabilities we were able to design ‘new variables’, combining lag 0 and lag 1 information, and subsequently with a multiple regression analysis we were able to link the interaction patterns to performance. Because leadership is one of the most important factors within these interaction patterns, we decided to test the variables with both leader effectiveness and team effectiveness.
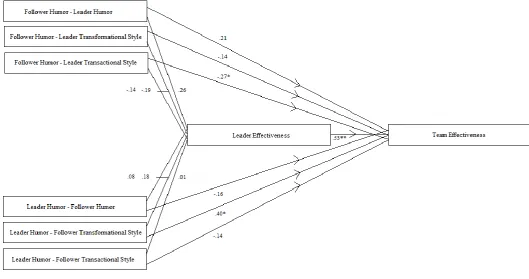
Hypothesis 1a: The combination of Follower Humor - Leader Humor is positively related to leader effectiveness.
Hypothesis 1b: The combination of Follower Humor - Leader Humor is positively related to team effectiveness.
Hypothesis 2a: The combination of Follower Humor - Leader TLS is positively related to leader effectiveness.
Hypothesis 2b: The combination of Follower Humor - Leader TLS is positively related to team effectiveness.
Because humor is a social phenomenon, every joke requires both a teller and an audience, we suspect that humor has only positive effect on effectiveness in combination with a similar
positive reaction. A task-oriented reaction ‘blocks’ the humor pattern, and the intention of the humor initiator ‘fails’. Therefore in hypotheses 3 and 6, we suppose that there’s a negative correlation between humor and effectiveness, if the subsequent reaction is task-oriented.
Hypothesis 3a: The combination of Follower Humor - Leader TAL is negatively related to leader effectiveness.
15
Hypothesis 4a: The combination of Leader Humor - Follower Humor is positively
related to leader effectiveness.
Hypothesis 4b: The combination of Leader Humor - Follower Humor is positively related to team effectiveness.
Hypothesis 5a: The combination of Leader Humor - Follower TLS is positively related to leader effectiveness.
Hypothesis 5b: The combination of Leader Humor - Follower TLS is positively related to team effectiveness.
Hypothesis 6a: The combination of Leader Humor - Follower TAL is negatively related to leader effectiveness.
Hypothesis 6b: The combination of Leader Humor - Follower TAL is negatively
[image:15.595.37.552.379.665.2]related to team effectiveness.
16 METHODS
This study used a cross-sectional design with four different data sources that reduces
common method bias. 1) three to four expert raters per leader rated the overall effectiveness of the leaders. 2) a survey measured followers’ perceptions of transactional leadership style,
transformational leadership style, leader effectiveness and team effectiveness, 3) another survey assessed leaders’ perceptions of the items listed above, and 4) systematic video-coding of the behaviors exhibited during regular held staff meetings. For this study, unfortunately the expert ratings were not captured, but by using still a variety of three different methods and sources, we restrain common source bias (Podsakoff et al., 2003)
Sampling & Data collection
In total 79 leaders participated in this study. They were employed by a variety of divisions within the tax authorities sector. These leaders worked at several departments in either a middle-management or a first-line supervisory type of position. The leader sample consisted of 20 female leaders and 55 male leaders (4 leaders did not fill in this question). On average, the leaders were 50,21 years old, ranging from 27 to 64 years. The leaders had an average tenure of 9,77 years and they chaired staff meetings with 4 to 29 employees. The follower subsample consisted of 950 followers: 336 females and 559 males (55 followers did not fill in this
question). The average age of the follower subsample was 48,99 years, and their average tenure was 11,87 years. The data are treated confidentially.
Measures
1. Survey data
Transformational Leadership Style
The extent to which followers perceive the leaders exhibiting the transformational leadership style is measured through the Multifactor Leadership Questionnaire MLQ (Bass & Avolio, 1995). The transformational leadership style consist of five dimensions:
17 correlation coefficients consist of two ICC’s. ICC1 is the reliability of individual ratings and ICC2 is the reliability of the team’s mean ratings (Klein & Kozlowski, 2000). Positive values of ICC1 and a significant ANOVA F value are conditions to aggregate to the team level. ICC2 values above .50 are accepted (Bliese, 2000; Kenny & LaVoie, 1985). The ICC1 of the transformational
leadership style MLQ variable was .39 (p < .01) and ICC2 was .93 (p < .01). These results
indicated that the agreement among followers within the team was high enough to aggregate the scores at the team level.
Transactional Leadership Style
Transactional leadership style is assessed with the Contingent Reward (4 items, α = 0,84); and the Management by Exception – Active ( 4 items. α = 0,85) dimensions. The answers are given on a 7 point scale, ranging from 1 (strongly disagree) to 7 (strongly agree). Earlier studies indicated that CR and MBE-Active typically reflect the transactional leadership style (Antonakis, Avolio, & Sivasubramaniam, 2003; Avolio et al., 2004; Den Hartog et al., 1997). Appendix 2 included the items measuring the transactional leadership style. The overall Cronbach alpha was
α = 0,89. The ICC1 of the transactional leadership style MLQ variable was .49 (p < .01) and ICC2 was .89 (p < .01). These results indicated also that agreement among followers within the team was high enough to aggregate the scores at the team level.
Leadership Effectiveness
Leader effectiveness perceived by the followers was measured by 4 items of the MLQ. Items of this scale included: “My supervisor leads a group that is effective”, “My supervisor heighten others desire to succeed”, “My supervisor is effective in meeting my job-related needs”, “My supervisor is effective in meeting organizational requirements”. The Cronbach’s alpha for this construct was α = 0,89. The response categories ranged from 1 (strongly disagree) to 7 (strongly agree). The ICC1 of the leader effectiveness follower score was .67 (p < .01) and ICC2 was .89 (p < .01).
Team Effectiveness
18 on a 7 point Likert scale, and ranged from 1 (totally disagree) to 7 (totally agree). The Cronbach’s alpha for this construct was α = 0,89. ICC1 of the team effectiveness score was .68 (p < .01) and ICC2 was .89 (p < .01).
2. Video data
The 79 leaders and their 950 followers were all being filmed during a randomly selected, regular staff meeting. Before the start of the meeting, the video cameras were located in a fixed place in the meeting room. In a relative short time, the cameras blended into the background (Erickson, 1992; Mead, 1995), and normal behavioral patterns return quickly in such a field setting
according to Collier and Collier (1986). We checked the representativeness of the behavior of the leader immediately after each meeting. The attending followers were asked to respond to the following questionnaire item: “How representative did you think the behaviors of the leader were compared to other typical meetings?” The followers scored their leaders’ behavioural representativeness using a 7 point Liker scale, ranging from 1 (not representative) to 7 (highly representative). The average score of all 79 leaders in this study was 5.7, indicating that the leaders’ behavior was fairly representative.
For analysing the video behaviors we made use of a behavioural transcription software program “The Observer” (Noldus, Trienes, Hendriksen, Jansen & Jansen, 2000). This program allowed us to code the video-taped leader- and follower behaviors while watching the video tapes. The behaviors were coded using a detailed observation scheme designed and developed by previous studies (e.g. Van der Weide, 2007; Gupta et al., 2009; Nijhuis, Wilderom & Van der Weide, 2009). On the basis of this observation scheme two independent observers per video minutely coded the behaviors. The observers are being trained and used a codebook which included detailed operational definitions of the various behaviors (Van der Weide, 2007; Gupta et al., 2009). The two observers discussed their results with the confusion error matrix and inter-rater reliability output generated by “The Observer”. An average inter-rater reliability of 96% or more was required to accept the data. The behaviors are coded in frequencies (how often a specific behavior occurred) and time (duration of the behavior). In this study we make use of the frequencies, which corresponds to prior leadership and managerial work studies (Yukl, Wall & Lepsinger, 1990). The frequencies of the video behaviors are standardized in percentages of the total amount of video coded behaviors.
19 team member makes a joke to another team member (on a friendly/kind way!) a score in this category follows. Also laughing about jokes and stories by team members is coded as “humor”. Examples of behaviors that occurs in the filmed staff meetings and which are coded as “humor” are: “Hahaha let’s do that next time…!”, “Hihi, that night was…”
Because of the absence of direct correlations between humor and leader- and team effectiveness, we made a ‘Lag Sequential analysis’, where humor-behaviors are linked to a subsequent other behavior. A distinction was made between Leader Humor (Lag 0) – Follower Reaction (Lag 1) and Follower Humor (Lag 0) - Leader Reaction (Lag 1). We designed 3 types of (Lag 1) reactions: humor, transformational style, transactional style. The transformational style contains six components of the codebook: agreeing, positive feedback, intellectual stimulation, individualized consideration, humor, personally informing. The transactional style contains three components of the codebook: provide negative feedback, directing/ correcting, verifying. Additional examples of statements are incorporated in Appendix 3.
Control variables
Past research has identified several demographic variables as influential on leadership effectiveness. Some studies have demonstrated that job tenure of the leader (Virany, Tushman & Romanelli, 1992; Cannella & Rowe, 1995) and gender of the leader (e.g. Dobbins & Platz, 1986, Eagly & Johnson, 1990) may affect perceptions of leader- and team effectiveness.
Data analysis
The hypotheses are tested with linear multiple regression analyses that generate estimates of the standardized regression coefficients for the model paths (Cohen, Cohen, West, & Aiken, 2002). Leadership effectiveness and team effectiveness are both dependent variables. For the sample of 79 leaders, the control variables, the variables Leader Humor – Follower reactions and Follower Humor - Leader reactions were entered in a primary- and alternative orderings.
20 RESULTS
Preliminary Analyses
Before the Lag Sequential Analysis we did a prior analyses with the variables humor-frequency and humor-duration, and as expected no direct correlations were found between humor and team- or leader effectiveness.
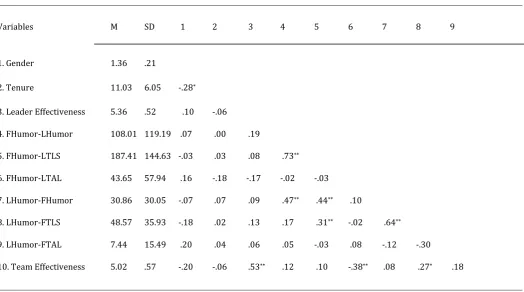
Table 1 presents the means, standard deviations, and bivariate correlations of the key variables of this study. The combination FHumor-LTAL is significantly related to team effectiveness (r = -.38, p < .01), therefore, preliminary support is found for hypotheses 3b. Hypothesis 5b presumed that the combination LHumor-FTLS is significant related to team effectiveness for which we also find preliminary support (r = .27, p < .05). Leader effectiveness is significantly related to team effectiveness (r = .53, p < .01).
Furthermore, no variable seems to correlate with leader effectiveness, so there’s no preliminary support for hypotheses 1a, 2a, 3a, 4a, 5a, 6a.
Hypothesis Testing
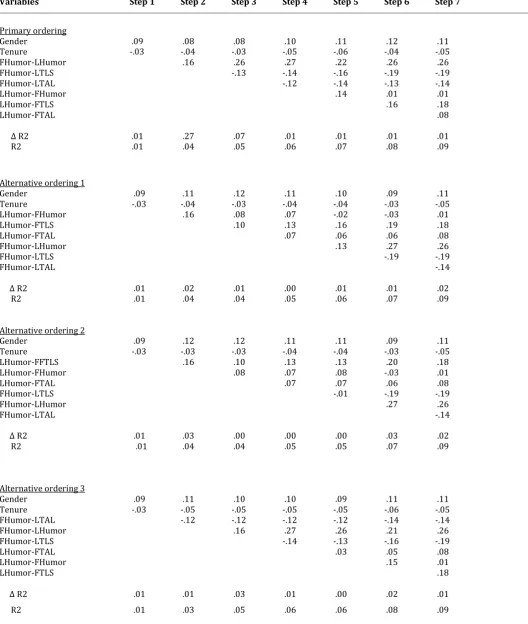
The results of the multiple linear regression analyses with the dependent variable leader effectiveness (with sample size n=79) are presented in Table 2. The control variables gender and tenure are entered in the first step of the model. In the regression model none of those control variables are significant. In the primary ordering, Follower Humor-Leader Humor was entered as second, Follower Leader TLS (3), Follower Leader TAL (4), Leader Humor-Follower Humor (5), Leader Humor-Humor-Follower TLS (6), Leader Humor-Humor-Follower TAL (7), but there is no significance, neither in the alternative orderings. These results indicate that hypotheses 1a, 2a, 3a, 4a, 5a and 6a cannot be supported.
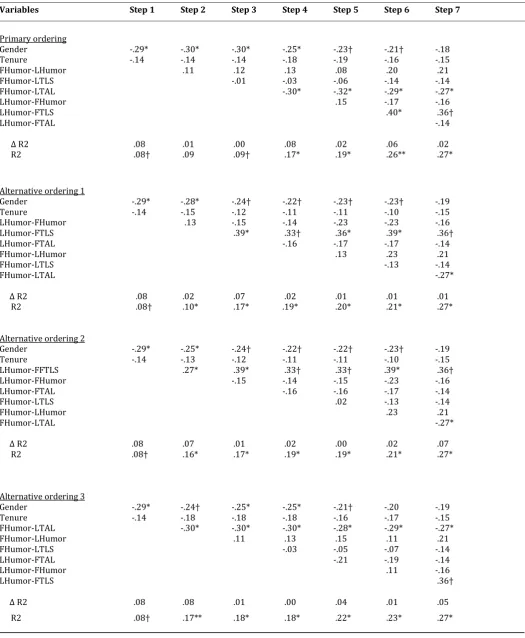
Table 3 shows the multiple regression results with team effectiveness as the dependent variable. We tested hypotheses 3b and 5b in a regression analysis. The control variables gender and tenure are entered in the first step. In the model of team effectiveness, tenure is not
significant. Gender is significant in the first steps, but decreases and disappears in the
21 The combination LHumor-FTLS was entered in the primary ordering in the sixth step and the variable was positively significant in the sixth (β = .40, p < .05) and seventh (β = .36†, p< .05) step. The model was highly significant in step 6 (F = 2,98, p < .01) and also significant in step 7 (F = 2,79, p < .05). These results indicate that hypotheses 5b was also supported.
Figure 2. The model of beta’s in relation to leader effectiveness and team effectiveness.
Residual Analyses
22 DISCUSSION
The purpose of this study is to examine the role of humor and interactions following humor on team and leader effectiveness. According to the literature, humor – in combination with a reaction i.e. humor patterns, and not humor statements alone, are relevant to performance outcomes (Lehman-Willenbrock, 2014). According to Romero and Cruthirds (2006), humor is a “basic element of interaction”, and interaction is essentially reciprocal. Logically, humor is considered as part of a process, instead of humor behavior alone. We checked this assumption with our data, and as expected, we found no direct correlation between humor behavior and team or leader effectiveness.
Through video-based data, the frequencies of humor behaviors were obtained, as well as other relevant transformational- and transactional behaviors of both, leaders and followers. We transformed these data into interaction sequence tables (Lag Sequential Analysis), to determine how often specific behavior (humor) was followed by another behavior, and we calculated the so-called transition probabilities. The following combinations are designed, given the available coded behaviors:
Follower Humor – Leader Humor Leader Humor – Follower Humor
Follower Humor – Leader Transformational Leader Humor – Follower Transformational * Follower Humor – Leader Transactional * Leader Humor – Follower Transactional
We linked the video to the survey-based data about the effectiveness scores, and executed linear multiple regression analyses. A strongly negative correlation between F Humor - L TAL and team effectiveness is found, which indicates the importance and power of a leader’s reaction on performance. These results support earlier findings about the importance of leadership within interaction processes (Kahai, Sosik, & Avolio, 1997; Tarricone & Luca, 2002, McIntyre et al. 1995, Oser et al. 1989). Stout et al. (1999) distinguished team processes into “taskwork” and “teamwork”, whereby taskwork focuses on the accomplishment of tasks, and teamwork
describes the interaction processes. Apparently, the adverse reaction of the leader on follower Humor, which is an important element of teamwork, affects also the taskwork processes and influences the team effectiveness negatively.
23 our findings, were the combination L Humor – F TLS, significantly correlates with team
effectiveness.
However, our finding that specific interaction patterns (F Humor – L TAL) can also decreases the level of team effectiveness, has not yet been reported before in the literature. A contrary reaction of a follower (L Humor – F TAL) seems to have less impact on interaction processes; and has therefore no effect on effectiveness. Remarkably, the combination ‘Humor – Humor’
displayed by either the leader or the follower, has no correlation with effectiveness. An
explanation for this could be that humor is transformational-related, and work teams, dependent of their functions, always have to be task oriented (transactional) to some degree. Several
scholars have tested a positive effect of transformational- in combination with the transactional style on team effectiveness (Bass, 1985; Lowe et al., 1996). According to Hackman (1986), team effectiveness comprises three aspects: productivity, learning and viability. At the same time, humor is related to individual and team performance (Avolio et al., 1999), because humor produces an increase in psychical and psychological energy (Dienstbier, 1995). Consequently, it seems to be that humor is only effective as long as it serves productivity and learning through communication, leadership, and collective cognitions. If the function of humor disappears, which happens in a ‘humor-reaction’ pattern, the contribution to team effectiveness is ignorable.
Practical Implications
Followers and leaders have not understood yet when the use of humor is helpful and when it can be harmful. The results of this study imply that a task-oriented reaction of the leader on a joke of a follower is not effective for the team effectiveness. This study also shows how humor displayed by the leader can enhance the leader-follower interaction process, but this works only if the followers are seem to behave in a transformational fashion. It can be useful that both, team members an followers are aware of the functions of humor. If the leader understands the group dynamics and interaction processes within his/her team, humor might be a ‘valuable
24 Strengths, limitations and future research directions
The strength of this study is that different sources and methods are used to reduce common method bias. In addition, the adoption of a video-observation method enables us to examine behavior sequences. Leader- and team effectiveness is measured by the perceptions of the followers, and the behavioral combinations are measured with naturalistic observations. The video-observations helped in reducing the common method bias, but also enable us to filter and analyse more specific behaviors and their exact frequencies. With a detailed observation scheme based on various academic sources, and a double-check by another observer, this information gives an reliable insight in leader- and follower behaviors.
In this study we were interested in analysing behavior ‘patterns’, but with the behavioral transcription software “The Observer”, we were only able to code frequencies and durations of behaviors. With special designed tables in Excel we obtained all possible behavioural
combinations and their probabilities (lag 1). In the future, Transcription Software that recognized patterns of interaction could provide many new insights in more complex interactions.
79 leaders and their 950 followers were filmed, during randomly selected regular staff
meeting. The size of this sample is large enough, but a limitation is that only first-line and middle managers were studied. According to Pavet & Lau (1983), different hierarchical positions may require different managerial behaviors, and therefore external generalizability is threatened. The results of this study still provide insights in the role of humor within interaction processes and show the impact of a leader’s negative reaction on humor. The effects are presumably comparable within al hierarchical layers, because within al sections and divisions of
organizations approximately the same interrelations between followers and leaders subsist. Because we were interested in behavioral combinations with Humor on effectiveness, parts of the Lag Sequential Analysis are used. Sequential analysis is not a single unified statistical topic, like the analysis of variance or multiple regression (see Chiu and Khoo, 2005 for detailed critics). It is the application of a number of existing techniques to sequential data. Previous articles stressed the binomial test z score and lag-sequential (e.g., Bakeman, 1978; Bakeman & Dabbs, 1976; Sackett, 1979) and some articles advocate to use the z score formula and suggested log-linear analyses. Because we designed ‘new combination variables’, using the transition
25 In this study, the focus was on positive humor, but we didn’t distinguish between the
different styles of humor (e.g. affiliative, self-enhancing, or self-defeating). Future research should differentiate between these styles and explore also the effects of negative humor. Research about when different humor styles are displayed, and if it depends on personal characteristics, team characteristics and/ or the environmental conditions would give many new insights in groups dynamics and interaction patterns.
Interesting to include within this research area is the ‘work climate’. Interaction processes play a crucial role within work climate, and vice versa team member’s reactions are influenced by the work climate. Work climate can be measured through ‘The Positive and Negative Affect Schedule (PANAS)’, a 20-item self-report measure of positive and negative affect developed by Watson, Clark, and Tellegen (1988). Within our questionnaire 8 items were included:
Enthusiastic, Interested, Inspired, Proud (PA), and Afraid, Angry, Nervous, Irritated (NA). Within the model of this study, we tested both PA and NA as moderator and mediator, but unfortunately no relevant results were obtained. An explanation could be that the 8 tested items not comprises all aspects of the work climate. For future research, it is interesting to investigate the role of humor, different humor styles and their subsequent reactions within both positive- and negative work climates.
26 CONCLUSION
This study addressed some gaps in the literature on positive humor in organizations. First, we noted that humor is a ‘basic element’ of interaction processes, and interaction is a reciprocal action or influence. This implies that ‘humor patterns’ or ‘humor – reactions’ , and not humor attempts by themselves, can be related to team- or leader effectiveness. Preliminary analyse supported this expectation: humor statements alone were not directly related to performance outcomes.
Video-data were obtained and with a Lag Sequential Analysis, interaction sequence matrices were generated, in order to determine how often one behavior (lag 0) was followed by another (lag 1), and probabilities were calculated. We were interested in testing hypotheses containing various humor-reaction patterns: Follower Humor – Leader Reaction and Leader Humor – Follower Reaction. The effectiveness scores were measured by different sets of items of the Multilevel Leadership Questionnaire (MLQ).
In the next step, the six ‘new designed variables’ were tested through the multiple linear regression method. This study shows that the combination Follower Humor – Leader TAL is negatively related to team effectiveness. Thus when the leader reacts in a transactional way (very task-oriented) on humor expressed by a follower, team effectiveness decreases. This could be explained as follows: the leader ‘blocks’ the humor reaction by reacting task oriented (he/she ignores the joke), so the exchange process on this point of humor stopped. This reaction
generates a negative signal toward the initiator, but also toward the other followers in the meeting. Instead of facilitating interaction processes, by reacting positively to the follower display of humor, which is essential for team performance, the leader focuses on tasks.
The combination Leader Humor – Follower TLS is positively related to team effectiveness. This implies that humor displayed by the Leader has only positive impact when the followers react in a transformational way (more relation-oriented).
This study focuses on both; leader- and team effectiveness, but the results are only significant for team effectiveness. This could be explained as follows: Interaction processes (humor) occurs in a social setting, and these processes are more relevant for the team as a whole than for the individual leader. Our results show that the reaction of the leader on humor expressed by a follower has far-reaching consequences for team effectiveness. Apparently, the leader is
28 REFERENCES
Antonakis, J., Avolio, B. J., & Sivasubramaniam, N.(2003). Context and leadership: An examination of the nine-factor full-range leadership theory using the multifactor leadership questionnaire. The Leadership Quarterly, 14, 261-295.
Aries, E. J. (1976). Interaction patterns and themes of male, female and mixed groups. Small Group Interaction, 7(1): 7-18.
Avolio, B.J., Howell, J.M., & Sosik, J.J. (1999). A Funny Thing Happened on the Way to the Bottom Line: Humor as Moderator of Leadership Style Effects. The Academy of Management Journal,
42(2), 219-227.
Avolio, B. J., & Bass, B. M. (2004). Multifactor leadership questionnaire: Third edition manual and sampler set. Redwood City, CA: Mind Garden.
Bakeman, R., & Dabbs, J.M. Jr (1976). Social interaction observed: Some approaches to the analysis of behavior streams. Personality and Social Psychology Bulletin, 2, 335-345
Bakeman, R. (1978). Untangling streams of bahavior: Sequential analysis of observation data. In G.P. Sackett (Ed.), Observing behavior (2), Data collection and analyses methods, 63-78. Baltimore: University Park Press
Barbour, G. (1998). Want to be a successful manager? Now that’s laughing matter! P.M. Public Management, 80 (7), 6-9
Barsoux, J.L. (1993) Funny Business. Humours. Management and Business Culture. London: Cassell.
Bass, B.M. (1985). Leadership and performance beyond expectations. New York, N.Y: Free Press.
29 Bass, B.M. (1990). From transactional to transformational leadership: Learning to share the vision. Organizational Dynamics, 18, 19-36.
Bass, B. M., & Avolio, B. J. (1995). MLQ Multifactor Leadership Questionnaire for research: permission set. Redwood City, CA: Mindgarden.
Bass, B.M. (1999). Two decades of research and development in transformational leadership.
European Journal of Work and Organizational Psychology, 8, 9-32.
Bass, B.M., Avolio, B.J., Jung, D.I., & Berson, Y. (2003). Predicting unit performance by assessing transformational and transactional leadership. Journal of Applied Psychology, 88, 207-218.
Benes, K.M., Gutkin, T.B., & Kramer, J.J. (1995). Lag sequential analysis: Taking consultation communication research methodology to the movies. School psychology review, 24, 694-708
Blau, G. (1993). Operationalizing direction and level of effort and testing the relationships to individual job performance. Organizational Behavior and Human Decision Processes, 55, 152-170.
Bliese, P. D. (2000). Within-group agreement, non-independence, and reliability: Implications for data aggregation and analyses. In S. W. J. Kozlowski (Ed.), Multilevel theory, research, and methods in organizations: Foundations, extensions, and new directions, 349–381. San Francisco: Jossey-Bass.
Brown, P., & Levinson, S. (1987). Politeness: Some Universals in Language Usage. Cambridge University Press.
Cameron, E., & Green, M. (2012). Making sense of change management. A complete guide to models, tools and techniques of organizational change (3rd ed.). London, United Kingdom: Kogan p.9.
30 Chemers, M. M. (2001). Leadership effectiveness: An integrative review. In M. A. Hogg &
R. S. Tindale (Eds.), Blackwell handbook of social psychology: Group processes 376-399. Oxford, England: Blackwell.
Cheng, D., Wang, L. (2014) Examining the Energizing Effects of Humor: The Influence of Humor on Persistence Behavior. Journal of Business Psychology. doi: 10.1007/s10869-014-9396
Chiu, M.M., & Khoo, L. (2005). A new method for analyzing sequential processes: Dynamic multilevel analysis. Small Group Research, 36, 600-631.
Coates, J. (1986). Women, men and language: A sociolinguistic account of sex differences in language. London: Longman.
Cohen, S. G., & Bailey, D. E. (1997). What Makes Teams Work: Group Effectiveness Research from the Shop Floor to the Executive Suite. Journal of Management, 23(3), 239-290.
Cohen, J., Cohen, P. West, S.G., & Aiken, L.S. (2002). Applied multiple regression/correlation analysis for the behavioral sciences (3th ed.). Londen: Routlegde.
Collier, J., & Collier, M. (1986). Visual anthropology: Photography as a research method.
Albuquerque: University of New Mexico Press.
Collinsen, D.L. (1988). Engineering humor: Masculinity, joking and conflict in shop-floor relations.
Organization Studies 9(2), 181-199.
Consalvo, C. (1989). Humor in management: No laughing matter. Humor: International Journal of Humor Research 2, 285-297.
31 Cox, J A., Read ,R.L., & Auken, P. (1990). Male-female differences in communicating job related
humor: An exploratory study. Humor: International Journal of Humor Research 3 (3), 287-295.
Clouse, R. Wilburn, & Karel L. Spurgeon. (1995). Corporate analysis of humor. Psychology: A Journal of Human Behaviour 32 (3/4), 1-24
Crawford, C.B. (1994) Theory and implications regarding the utilization of strategic humor by leaders. The Journal of Leadership Studies, 1, 53-68.
Decker, W.H., & Rotondo, D.M. (2001) Relationships among gender, type of humor, and perceived leader effectiveness. Journal of Managerial Issues, 13, 450-66.
Den Hartog, D. N., Van Muijen, J. J., & Koopman, P. L. (1997). Transactional versus transformational leadership: An analysis of the MLQ. Journal of Occupational and Organizational Psychology, 70(1), 19-34.
Dienstbier, R.A. (1995) The Impact of Humor on Energy, Tension, Task Choices, and Attributions: Exploring Hypotheses from Toughness Theory. Faculty Publications, Department of Psychology. University of Nebraska
Dobbins, G. H., & Platz, S. J. (1986). Sex differences in leadership: How real are they?
Academy of Management Review, 11, 118-127.
Duncan, W.J. (1982). Humor in Management: Prospects for Administrative Practice and Research. Acadamy
of Management Review, 7, 136-142.
Duncan, W.J. (1990). Humor in Management: Prospects for Administrative Practice and Research.
Acadamy of Management Review, 7, 136-142.
32 Eagley, A. H., & Johnson, B. T. (1990). Gender and leadership style: A meta-analysis.
Psychological Bulletin, 108, 233-256.
Edelsky,C. (1981). Who's got the floor? Language in Society 10, 383-421.
Ehrenberg, T. (1995). Female differences in creation of humor relating to work. Humor: International Journal of Humor Research 8 (4), 349-362.
Erickson, F. (1992). The interface between ethnography and microanalysis. In M. D. LeCompte, W. L. Millroy, & J. Preissle (Eds.). The handbook of qualitative research in education (201-225). San Diego: Academic Press.
Fishman, P. (1983). Interaction: The work women do. In: B. Thorne, C. Kramarae and N. Henley, eds., Language gender and society, 89-101. Rowley, MA: Newbury.
Fleishman, E.A., Mumford, M.D., Zaccaro, S.J., Levin, K.Y., Korotin, A.L., & Hein, M.B. (1991).Taxonomic efforts in the description of leader behavior: A synthesis and functional interpretation. Leadership Quarterly, 2: 245-287.
Foot, H.C. (1986). Humor and laughter. In O. Hargie (Ed.). A handbook of communication skills, 35-381. Londin: Croom Helm.
Gibson, C. B., Cooper, C. D., & Conger, J. A. (2009). Do you see what we see? The complex effects of perceptual distance between leaders and teams. Journal of Applied Psychology, 94(1), 62-76.
Gist, M. E., Locke, E. A., & Taylor, M. S. (1987). Organizational behavior: Group structure, process, and effectiveness. Journal of Management, 13, 237-257.
33 Gupta, K., Wilderom, C., & Van Hillegersberg, J. (2009). Exploring the behaviors of highly
effective CIO's using video analysis. AMCIS 2009 Proceedings. Paper 463. Retrieved from http://aisel.aisnet.org/amcis2009/463.
Guzzo, R. A., & Shea, G. P. (1992). Group performance and intergroup relations in organizations. In M. D. Dunnette & L. M. Hough (Eds.), Handbook of industrial and organizational psychology, 3, 269-313. Palo Alto, CA: Consulting Psychologists Press
Hackman, J. R. (1983). A normative model of work team effectiveness (Technical Report No. 2). New Haven, CT: Yale School of Organization and Management
Hackman, J.R. (1986). The psychology of self-management in organizations. In M.S. Pallack & R.O. Perloff (Eds), Psychology and work: Productivity, change, and employment. Washington, DC: American Psychological Association, 89–136.
Hackman, J. R. (1987). The design of work teams. In J. W. Lorsch (Ed.), Handbook of organizational behavior, 315–342. Upper Saddle River, NJ: Prentice Hall.
Hallam, G.L., & Campbell, D.P. (1992). Selecting team members? Start with a theory of team effectiveness. Paper presented at the 7th Annual Meeting of the Society of Industrial and
Organizational Psychology, Montreal, Quebec, Canada.
Hay, J. (1995). Gender and Humour: Beyond a Joke. Unpublished Master’s Thesis, Victoria University of Wellington, Wellington, New Zealand.
Hogan, R., Curphy, G.J., Hogan, H. (1994). What we know about leadership: effectiveness and personality. American Psychologist, 6, 1-33.
Holmes, J. (2000). Politeness, power and provocation: how humor functions in the workplace.
Discourse Studies 2(2), 1-17.
34 Howell, J. M., & Avolio, B. J. (1993). Transformational leadership, transactional leadership, locus of control, and support for innovation: Key predictors of consolidated business-unit performance. Journal of Applied Psychology, 78, 891–902.
Janes, L.M. & Olsen, J.M. (2000). Jeer pressure: The behavioral effects of observing ridicule of others. Personality and Social Psychology Bulletin, 26, 4, 474-485.
Jennifer, H. 1995. Jocular abuse patterns in mixed-group interaction. Wellington Working Papers in Linguistics 6, 26-55.
Judge, T.A., & Piccolo, R.F. (2004). Transformational and transactional leadership: A meta-analytic test of their relative validity. Journal of Applied Psychology, 89, 5, 755-768.
Kahai, S. S., Sosik, J. J., & Avolio, B. J. (1997). Effects of leadership style and problem structure on work group process and outcomes in an electronic meeting system environment. Personnel Psychology, 50, 121-146. 26.
Kauffeld, S., & Lehmann-Willenbrock, N. (2012). Meetings matter. Effects of team meeting communication on team and organizational success. Small Group Research, 43, 130-158.
Kenny, D. A., & LaVoie, L. (1985). Separating individual and group level effects. Journal of Personality and Social Psychology, 48, 339–348.
Klein, K. J., & Kozlowski, S. W. J. (2000). Multilevel theory, research and methods in organizations. San Francisco, CA: Jossey-Bass.
Kozlowski, S. W. J., & Bell, B. S. (2003). Work groups and teams in organizations. In W. C. Borman, D. R. Ilgen, & R. J. Klimoski (Eds.), Handbook of psychology: Industrial and organizational psychology, 12, 333-375. London: Wiley.
Kozlowski, S. W., & Ilgen, D. R. (2006). Enhancing the effectiveness of work groups and teams.
35 Lehmann-Willenbrock, N., Meyers, R.A., Kauffeld, S., Neininger, A., & Henschel, A. (2011). Verbal
interaction sequences and group mood: Exploring the role of planning communication.
Small Group Research, 42, 639-668.
Lehman-Willenbrock, N. & Allen, J.A. (2014). How Fun Are Your Meetings? Investigating the Relationship Between Humor Patterns in Team Interactions and Team Performance. Journal of Applied Psychology, 99(6), 1278-1287.
Lowe, K.B., Kroeck, K.G., & Sivasubramaniam, N. (1996). Effectiveness correlates of transformation and transactional leadership: A meta-analytic review of the MLQ literature. Leadership Quarterly, 7,385-425.
Maltz, Daniel N. and Ruth A. Borker, (1983). A cultural approach to male-female miscommunication. In: J.J. Gumperz, ed., Language and social identity, 196-216. Cambridge: Cambridge University Press.
Marks, M. A., Mathieu, J. E., & Zaccaro, S. J. (2001). A temporally based framework and taxonomy of team processes. Academy of Management Review, 26, 3, 356-376.
Martin, R.A., Puhlik-Doris, P., Larsen, G., Gray, J., & Weir, K. (2003). Individual differences in uses of humor and their relation to psychological well-being: Development of the humor styles questionnaire. Journal of Research in Personality, 37, 1, 48-75
Martineau, W.H. (1972). A model of the social functions of humour. In Goldstein, J.H. and McGhee, P.E. The Psychology of Humor. New York/London: Academic Press, 101-125.
McGrath, J. E. (1964). Social psychology: A brief introduction. New York: Holt, Rinehart & Winston.
McIntyre, R. M., & Salas, E. (1995). Measuring and managing for team performance: Emerging principles from complex environments. In R. A. Guzzo & E. Salas (Eds.), Team effectiveness and decision making in organizations. San Francisco: Jossey-Bass.
36 Moore, D.S. & McCabe, G.P. (2009). Statistiek in de praktijk. Den Haag: Sdu Uitgevers bv.
Moreall, J. (1987). The philosophy of laughter and humor. Albany: State University of New York Press, 1987
Morreall, J. (1991). Humor and work. Humor, 4 (3/4), 359-373.
Nijhuis, J.H.E., Wilderom, C.P.M., & van den Berg, P.T. (2009) Transformational leadership and leader behaviors in staff meetings. triangulated evidence of effective school leadership. Paper presented at the Annual meetings of the Academy of Management.
Noldus, L.P.J.J., Trienes, R.J.H., Hendriksen, A.H.M., Jansen, H., & Jansen, R.G. (2000). The observer video-pro: new software for the collection, management, and
presentation of time-structured data from videotapes and digital media files. Behavior Research Methods, Instruments, and Computers, 32, 197-206.
O’Quin, K. & Derks, P. (1997). Humor and creativity: A review of the empirical literature. In M.A. Runco (Ed.), The creativity research handbook. Vol. 1, Cresskill, NJ: Hampton Press.
Oser, R., McCallum, G. A., Salas, E., & Morgan, B. B. (1989). Toward a definition of teamwork: An analysis of critical team behavior (Technical Report: TR-89-004). Orlando, FL: Naval Training Systems Center.
Pavett, C. M., & Lau, A. W. (1983.) Managerial work: The influence of hierarchical level and functional specialty. Academy of Management Journal, 26, 1, 170-177.
Podsakoff, P. M., MacKenzie, S. B., Lee, J. Y., & Podsakoff, N. P. (2003). Common method biases in behavioral research: A critical review on the literature and recommended remedies. Journal of Applied Psychology, 88, 879-903.
37 Pressman, S.D., Cohen, S. (2005)Does Positive Affect Influence Health? Psychological Bulletin, 131,
6, 925-971.
Robinson, D.T., & Smith-Lovin, L. (2001). Getting a laugh: Gender, status, and humor in task discussions. Social Forces, 80, 123-158.
Romero, E.J. & Cruthirds, K. (2006). The use of humor in the workplace. Academy of Management Perspectives, 20, 58-69.
Romero, E. J., & Pescosolido, A. (2008). Humor and group effectiveness. Human Relations, 6, 395-418.
Ross, B. (1992). That’s a good one! Corporate Leadership with Humor. San Marcos, CA: Avant Books.
Sackett, G.P. (1979). The lag sequential analysis of contingency and cyclicity in behavioral interaction research. In J. Osofsky (Ed.), Handbook of infant development , 623-649. New York, NY: Wiley.
Sackett, G.P. (1987). Analysis of sequential social interaction data: Some issues, recent developments, and a causal inference model. In J.D. Osofsky (Ed.), Handbook of infant development (2nd ed., 855-878). New York, NY: Wiley.
Shamir, B. (1995). Social Distance and Charisma: Theoretical Notes and an Exploratory Study.
Leadership Quarterly 6, 19-48.
Spencer, K. L. (1993). The Wisdom of Teams: Creating The High-Performance Organization.
Academic Management. Executive, 7(3), 100-102.
38 Tarricone, P., & Luca, J. (2002). Employees, teamwork and social interdependence - a formula for
successful business? Team Performance Management, 8(3/4), 54-59. 38.
Van der Weide, J.G. (2007). An explorative video-study to the behavior of effective middle leaders. Unpublished doctoral dissertation. University of Tilburg, the Netherlands.
Vaillant, G.E. (1977). Adaptation to life. Toronto: Little, Brown, & Co.
Vinton, K.L. (1989) Humor in the workplace: It is more than telling jokes. Small Group Behavior, 20 (2), 151-166.
Virany, B., Tushman, M. L., & Romanelli, E. (1992). Executive succession and organization outcomes in turbulent environments: An organization learning approach. Organization Science, 3, 72-91.
Waller, M. J., Gupta, N., & Giambatista, R. C. (2004). Effects of Adaptive Behaviors and Shared Mental Models on Control Crew Performance. Management Science, 50(11), 1534-1544. 42
Wilderom, C., Klaster, E., Ehrenhard, M., & Hicks, J. (2010). Filmed behavior intelligence: an explorative study of highly effective middle managers in staff meetings. Paper presented at the 2008 Academy of Management meeting.
Yukl, G., Wall, S., & Lepsinger, R. 1990. Preliminary report on validation of the managerial practices survey. In K. E. Clark & M. B. Clark (Eds.), Measures of leadership: 223238. West Orange, NJ: Leadership Library of America.
Yukl, G. (2010). Leadership in organizations (7th ed.) Upper Saddle River: NJ: Prentice Hall.
Yukl, G. (2012). Effective leadership behavior: what we know and what questions need more attention. Academy of Management Perspective, 11, 66-85.
39 Zillmann, D., & Stocking, S. H. (1976). Putdown humor. Journal of Communication, 26, 154-163.
40 APPENDIX
Appendix 1: Survey items which are used to measure Transformational Leadership
Idealized Influence Behavior (4 items, α = 0,83):
My leader talks about his/ her most important values and beliefs
My leader specifies the importance of having a strong sense of purpose
My leader considers the moral and ethical consequences of decisions
My leader emphasizes the importance of having a collective sense of mission
Idealize Influence Attributed (4 items, α = 0,82):
My leader instils pride in me for being associated with him/her
My leader goes beyond the self-interest for the good of the group
My leader displays a sense of power and confidence
My leader provides complete trust
Inspirational Motivation (4 items, α = 0,87)
My leader talks optimistically about the future
My leader talks enthusiastically about what needs to be accomplished
My leader articulates a compelling vision of the future
My leader expresses confidence that goals will be achieved
Individualized Consideration (4 items, α = 0,84)
My leader spends time to teaching and coaching
My leader treats me as an individual rather than just a member of the group
My leader considers me as having different needs, abilities, and aspirations that others
41
Intellectual Stimulation (4 items, α = 0,65)
My leader re-examines critical assumptions to question whether they are appropriate
My leader seeks differing perspectives when solving problems
My leader gets me to look at problems from many different angles
42
Appendix 2: Survey items which are used to measure Transactional Leadership
Contingent Reward (4 items, α = 0,84)
My leader provides me with assistance in exchange for my efforts
My leader discusses in specific terms who is responsible for achieving performance targets
My leader expresses confidence when I meet expectations
My leader makes clear what one can expect to receive when performance goals are achieved
Management by Exception - Active (4 items, α = 0,85)
My leader concentrates his/her full attention on mistakes, complaints and failures
My leader concentrates his/her full attention on dealing with complaints
My leader keeps track of all mistakes
43
Appendix 3: Behavioral Coding Scheme (Verbal)
Category Behavior Definition Examples
Self
-Defending 1 Showing disinterest Not showing any interest, not taking problems seriously,
wanted to get rid problems and conflicts
Not actively listening, talking to others while somebody has the speaking term, looking away
2 Defending one’s
own position
Protecting the own opinion or ideas, emphasizing the own importance
“We are going to do it my way.” Blaming other people
3 Providing negative
feedback
Criticizing “I don’t like that…”
“But we came to the agreement that…, and now…”
Steering 4 Disagreeing Contradicting ideas, opposing
team members “That is not correct” “I do not agree with you”
5 Agreeing Saying that someone is right,
liking an idea “That is a good idea” “You are right”
6a Directing/
Correcting Telling others what (not) to do “I want that…” “In this school are the rules…”
6b Directing/
Delegating Delegating / dividing tasks “Kees, I want you to…” “Marrie , you take for your account…”
6c Directing/
Interrupting Interrupt someone Interrupting a team member
7 Verifying Getting back to previously made
agreements/vision/norms
“We came to the agreement that…”
8 Structuring the
conversation Giving structure by telling the agenda, start/ end time etc. “The meeting will end at…” “We are going to have a break now”
9 Informing Giving factual information “The final result is…”
10a Visioning/
Short Term
Giving a short term direction, own opinion
“I think that…” “In my opinion…”
10b Visioning/
Long Term Giving a long term direction, vision, mission, long term strategy
“Our vision is…”
“What do we want to achieve in the upcoming years?”
Supporting 11 Positive feedback Rewarding, complimenting “Well done”
12 Intellectual
stimulation Asking for ideas, inviting people to think along or come up with own ideas, brainstorming
“What do you think is the best way to…?”
“What is your opinion about…?”
13 Individualized
consideration Rewarding, complimenting, encouraging, being friendly, showing empathy
“Good idea, thank you” “You did a great job” “Welcome”
“How are you?”
14 Humor Making people laugh, saying
something with a funny meaning Laughing, making jokes
15 Personally
informing Giving non-factual, but private information “Last week, my wife…”
16 Listening
Independent 17 Null-Behavior Working on own tasks without
communicating with other team members
44
TABLE 1
Means, Standard Deviations and Correlations of Leader Effectiveness, Team Effectiveness and the independent variables of the study (n=79)
Variables M SD 1 2 3 4 5 6 7 8 9
1. Gender 1.36 .21 2. Tenure 11.03 6.05 -.28*
3. Leader Effectiveness 5.36 .52 .10 -.06
4. FHumor-LHumor 108.01 119.19 .07 .00 .19 5. FHumor-LTLS 187.41 144.63 -.03 .03 .08 .73**
6. FHumor-LTAL 43.65 57.94 .16 -.18 -.17 -.02 -.03 7. LHumor-FHumor 30.86 30.05 -.07 .07 .09 .47** .44** .10
8. LHumor-FTLS 48.57 35.93 -.18 .02 .13 .17 .31** -.02 .64**
9. LHumor-FTAL 7.44 15.49 .20 .04 .06 .05 -.03 .08 -.12 -.30 10. Team Effectiveness 5.02 .57 -.20 -.06 .53** .12 .10 -.38** .08 .27* .18