MASTER THESIS
LIEKE B. VAN BUUREN
S1503359FACULTY
BEHAVIOURAL,
MANAGEMENT AND
SOCIAL SCIENCE,
UNIVERSITY OF
TWENTE, ENSCHEDE,
THE NETHERLANDS
EXAMINATION
COMMITTEE
DR. O.A KULYKMSC. N. BEERLAGE-DE JONG
Preface
This paper is written for a master thesis in the context of the master Health Sciences on the University of Twente. For my master thesis, I needed an interesting subject where I could work on for more than half a year. I am very happy that I was offered this master assignment. Even that it was in Utrecht was no barrier to me. In the beginning of the assignment, I lived in Enschede. During the assignment, I moved to Holten. The migration, next to my profession as a podiatrist and this master thesis demanded a lot from me. GGD GHOR Kennisnet 2.0 is the online community platform for all community health services (GGD), the regional medical emergency preparedness and planning departments (GHOR) and their umbrella organisation GGD GHOR Nederland. Me as a master student Health Sciences was given the task to do a user experience research to increase the usability of this online community platform. For completing this paper, I would like to thank Olga Kulyk and Nienke Beerlage-de Jong for supervising my process. I would like to thank Thea Aartsma and Saskia Boeker for the support and trust from GGD GHOR Nederland. Special thanks I would like to give to Nicol Nijland from Yard Internet B.V. Yard Internet B.V. is producing the technology of the online platform. Nicol supported me during the research process and has sent me in the right direction. And despite that she was not my official supervisor, she has taken the time to give me feedback which I could use to improve my thesis. I hope that I have delivered a positive contribution for improving GGD GHOR Kennisnet 2.0.
Abstract
Background: Design of online community platforms often shows a mismatch between the developed information technology and the user characteristics, the physical environment and the context of use. Lack of attention to usability does demotivate users and may have a negative impact on the sustainability of the online community. The mismatch can be solved by methods of co-creation with the end users. This means that the designed technology is realized with the end users and not only on designers’ intuition. Poor adherence is a common issue and co-creation helps to understand which requirements are needed for a tailored design in order that an online community platform is successful and flourishing. GGD GHOR Kennisnet 2.0 is an online community platform mainly for professional purposes in public health and safety. The current situation is that it is not optimally used in view of several stakeholders. It needs recommendations in the form of functional requirements and persuasive features. What should be kept in mind is that design is a iterative process which can be repeated as often as necessary but time and (financial) resources are usually limited. Therefore choices have to be made which improvements are achievable and when they can be implemented.
Objective: The study aims to find out how to improve the current design and use of GGD GHOR Kennisnet 2.0 to achieve it’ optimal user experiences.
Methods: The CeHRes roadmap combines infrastructural factors with human-centered design principles. Mixed methods are applied namely a literature review, an online statistic tool, expert evaluations, usability tests and an online survey. A cognitive walkthrough is done by three experts, usability tests were performed by 11 end users and the online survey is filled in by 46 end users. The information is coded based on users requirements and facilitating conditions.
Results: GGD GHOR Kennisnet 2.0 has more than 8353 community members. The study population is most female, has a scientific background and are community members between the 5-15 years. GGD
GHOR Kennisnet 2.0 received an overall grade of a 6.9 (in scale of 10 as maximum) but the ease of use of is 59.4% which is slightly below the average of 68%. The motor efficiency of the subgroup professionals is 0,47 and professionals are 1,53 times confused per task. It was notifiable that GGD GHOR Kennisnet 2.0 used no SSL certificate for data transport encryption and lacks optimizations for devices with a small screen.
Conclusion: Behind a thriving online community are adherence end users and an active community manager. Members of GGD GHOR Kennisnet 2.0 have a sense of community and are quite satisfied with the platform but also experience usability problems. Most important usability problems are the poor search functionality and the unclear navigation structures. The adherence can be explained by the fact that all information and knowledge about public health and safety is in one central place online and that it can be
Abstract (in Dutch)
Achtergrond: Het ontwerp van een online community platform wordt vaak gedaan op basis van intuïtie en wordt er te weinig aandacht besteed aan gebruikerskarakteristieken en context factoren. Hierdoor is de kans groot dat het niet aan de verwachtingen voldoet en matig wordt gebruikt door eindgebruikers. Dit heeft een negatieve impact op de toegevoegde waarde en de duurzaamheid van een online community platform. Een succesvollere aansluiting kan worden bereikt door methoden toe te passen waarbij informatie technologie wordt ontwikkeld samen met eindgebruikers. Er kan dan beter in kaart worden gebracht welke gebruikers vereisten en faciliterende voorwaarden er nodig zijn. GGD GHOR Kennisnet 2.0 is een online community platform voor professionele doeleinden in de Nederlandse publieke gezondheid en -veiligheid welke momenteel niet optimaal wordt gebruikt. Aanbevelingen zijn nodig in de vorm van functionele vereisten waardoor de overtuigingskracht van het platform toeneemt. In het algemeen kan er worden opgemerkt dat het ontwerp van een online community platform een continue proces is door nieuwe eisen, -inzichten en -technologie. Echter zijn er beperkende factoren zoals tijd en (financiële) middelen. Hierdoor dienen keuzes gemaakt te worden welke verbeteringen haalbaar zijn en wanneer ze worden geïmplementeerd.
Doel: Het doel van dit onderzoek is om uit te zoeken hoe het huidige ontwerp en gebruik van GGD GHOR Kennisnet 2.0 moet worden verbeterd om gebruikerservaringen te optimaliseren.
Methoden: De CeHres roadmap combineert infrastructurele factoren met ontwerp principes die gericht zijn op de eindgebruiker. Uit de roadmap zijn meerdere methoden zijn toegepast: Een literatuur studie, een statische analyse, drie expert evaluaties, elf gebruikerstesten en 46 online enquêtes. De informatie is gecodeerd op basis van gebruikers eisen en faciliterende voorwaarden.
Resultaten: GGD GHOR Kennisnet 2.0 heeft meer dan 8353 leden. De studie populatie is grotendeels vrouwelijk, heeft een wetenschappelijke achtergrond en zijn tussen de 5-15 jaar lid. GGD GHOR Kennisnet 2.0. krijgt gemiddeld een 6.9 als eindcijfer. Het gebruikersgemak scoort net onder het gemiddelde van 68%, namelijk 59,4 %. De efficiency om taken te volbrengen was bij de subgroep professionals 0,47 en per taak zijn ze gemiddeld 1,53 keer verward door onduidelijkheden. GGD GHOR Kennisnet 2.0 gebruikt geen SSL certificaat voor versleuteling van data tijdens transport en er is geen optimale weergave op apparaten met kleinere schermen.
Tabel of content
Preface ... 4
Abstract ... 5
Abstract (in Dutch) ... 6
1. Introduction ... 9
2. GGD GHOR Nederland ... 12
2.1 Background and history ... 12
2.2 Development of GGK ... 13
2.3 Operationalization of GGK ... 13
2.3.1 Professionals ... 14
2.3.2 Themes ... 14
2.3.3 Working groups ... 15
3. Theoretical framework ... 16
3.1 Center for eHealth research roadmap (CeHRes) ... 16
3.2 Theory acceptance model (TAM) ... 17
3.3 Information system success model ... 18
3.4 Persuasive system design model (PSD) ... 18
4. Methods ... 20
4.1 Literature study ... 20
4.2 Online statistic tool of Yard internet B.V. ... 20
4.3 Usability inspections ... 21
4.3.1 Usability scan - Cognitive walkthrough ... 21
4.3.2 Usability testing- User testing combined with depth-interviews ... 22
4.3.3 Online survey ... 28
5. Results... 30
5.1 Online statistic tool of Yard internet B.V. ... 30
5.1 Usability tests ... 30
5.1.1 Usability scan - Cognitive walkthrough ... 30
5.1.2 Usability testing- User testing combined with depth-interviews ... 31
5.2 Online survey ... 36
5.2.1 Online Survey part 1 ... 37
5.2.2 Online Survey part 2 ... 43
6.1 Currently use ... 44
6.2 Satisfaction of current users ... 45
6.3 Positive and negative experiences of current users ... 45
6.4 Practical recommendations for the improvement of the persuasiveness and usability in order that end users can be more persuaded to make more intensive use of GGK ... 46
6.4.1Practical recommendations for the redesign of GGK ... 46
6.5 Limitations of this study ... 50
7. Conclusion ... 52
8. References ... 53
9. Appendix ... 56
9.1 Acronyms ... 56
9.1 Glossary ... 56
9.2 Time frame research... 58
9.3 Start-up sheet for the cognitive walkthrough method ... 59
9.4 Overview of the used scenarios in usability testing (in Dutch) ... 64
9.5 Informed consent form (In Dutch) ... 65
9.6 Example of a test script for the researcher (In Dutch) ... 66
9.7 Usability task examples for the participant (In Dutch) ... 70
9.8 Online survey questionnaire (In Dutch) ... 70
9.9 (Quantitative) results usability testing (In Dutch) ... 74
1. Introduction
Information and communication technology (ICT) makes it possible to create online meeting platforms for people to satisfy one of the human needs for communication. One of these communication paradigms can be online communities (Stanoevska-Slabeva & Schmid, 2001). An online community consists out a group of people who are interacting with each other in a virtual environment on the internet. This is supported by ICT and guided through policies and norms (Preece & Maloney-Krichmar, 2001). Online communities are increasingly growing and peer-to-peer (p2p) information systems are becoming more popular in the recent years (R. C. R. Cheng & Vassileva, 2005; Koch, 2002; Young, 2013). An online community has members with the same common interest to interact active online and to form stable relationships together (Preece & Maloney-Krichmar, 2001; Young, 2013). The type of community depends how people can contribute to it. People can contribute to an online community by sharing information, opinions, music- and video files, photos, blogs ect, Examples of online communities are Flickr, Facebook or BitTorrent (R. Cheng & Vassileva, 2006). While some online community platforms flourish for many years do others fade away in a ‘ghost town’(Young, 2013). If users in the p2p system are not willing to participate or do not contribute to the online community it will never be successful no matter how good the ICT is in performance and policies (R. C. R. Cheng & Vassileva, 2005)
An online community platform can only be successful when is has varied and distinguished features (Stanoevska-Slabeva & Schmid, 2001). Organizations need to have enough organizational, human and financial resources. Not only at the start but also for maintenance and expansion. There also has to be a specific organizational structure and involvement. Dedicated community management is necessary and requires more than conservative monitoring and observing the online activity (Young, 2013). Members should have feeling of belonging to and identify with the community. If members do satisfy their own needs, they will also contribute to the community needs. Members need to feel that they matter when they can influence or being influenced by each other. On top of that, community members should have the feeling they have an emotional connection with each other (Koch, 2002; Young, 2013).
Computers cannot communicate in the same way as humans. Computer-human persuasion or computer-mediated persuasion has to include some patterns of interaction which are related to social communication. How to persuade and motivate the end user to participate actively within the community is social psychology (Cheng & Vassileva, 2005). The current lack of design theory may have a negative impact on the sustainability of the online community ( Wijnhoven Kraaijenbrink.; Spagnoletti, Resca, & Lee, 2015; Van Velsen, Wentzel, & Van Gemert-Pijnen, 2013). Most ICT systems like online communities are designed by engineers without enough input from the real end user. Gould and Lewis (1983) introduced a problem solving method which has a holistic and human-centred design approach. It requires information technology developers to analyse how real end users are likely use their service or product (Gould & Lewis, 1983). The analysis is of the whole avoids separate analysis of its parts. (van Gemert-Pijnen et al., 2011). A holistic approach is needed to guarantee that an information system will be applicable, accessible, feasible, manageable and enjoyable (van Gemert-Pijnen, Peters, & Ossebaard, 2013). The Center for eHealth Research (CeHRes) from Twente University has created a roadmap for a holistic design approach to emphasize the importance of the whole and the interdependence of its parts (van Gemert-Pijnen et al., 2011; Van Velsen et al., 2013).
To redesign GGK involves more than designing a new product with new services (Boddy et al., 2008). Nielsen and Molich (1990) have found ten heuristic principles for interaction design based on analysis of usability problems. These are; visibility of the system, the match between the real world and the system, the freedom and the control of the user, standards and consistency, the prevention of errors, recognition rather than recall, the efficiency and flexibility of use, a minimalistic and aesthetic design, documentation and help and that the system helps to recognize, diagnose and recover errors (Nielsen & Molich., 1990). A term that is frequently used in combination with health care, internet and computers is eHealth. It is used in the same line as e-business and e-commerce. The “e” does not only stand for “electronic” but should stand for more characteristic elements like efficiency, enhancing quality, evidence based, empowerment, encouragement, education, enabling, extending, ethics, equity, easy-to-use, entertaining and exiting. It seems to be clear that eHealth is not about a technical development but can be used in a much wider sense (Eysenbach, 2001).
An insight in how different types of end users do make use of the platform is important to find out. GGK needs to match all end users’ personal and professional goals in daily practice. The human and the organisational culture demands a lot of attention because of work units and jobs that will change in daily practise when the end user uses the new redesigned platform. If the new platform mismatches the community culture, employees and relevant stakeholders will resist using it. How people react also depends on how it will affect their individual power (Boddy et al., 2008). This study presents a qualitative explorative research and is about the reason where usability problems occur and what the consequences of the problems are. This is done via phases out of the CeHRes roadmap. The ethical commission has accepted this research proposal. As a result, a list of recommendations and design decisions will be reported to solve the research problem of insufficient and inefficient utilisation of GGK. Here stops this research study. A continuation of this research can take the form of prototyping. For this study the following research question was adopted:
What can be improved to GGD GHOR Kennisnet 2.0. to optimize and expand it’ use among the real end user/professionals?
To answer the research question there were five sub questions drafted:
1. How do users of GGD GHOR Kennisnet 2.0 currently use the online system? 2. How satisfied are current users of GGD GHOR Kennisnet 2.0?
3. What are the positive and negative experiences of the users of GGD GHOR Kennisnet 2.0?
4. What are practical recommendations for the improvement of the persuasiveness and usability of the GGD GHOR Kennisnet 2.0?
2. GGD GHOR Nederland
2.1 Background and history
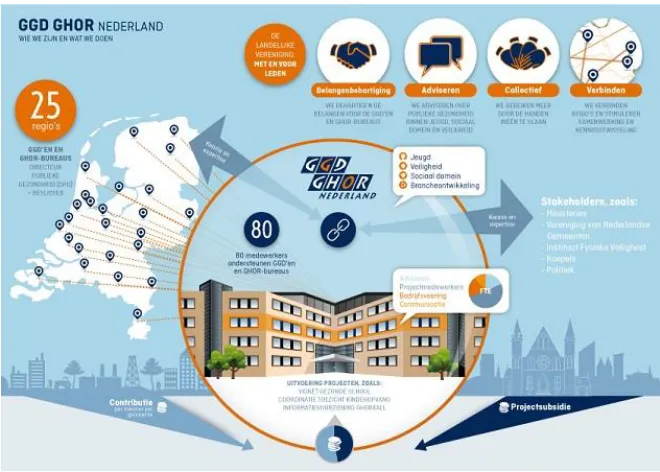
Since January 2014, there is in the Netherlands an enhanced collaboration between the Community Health Services (GGD) and the Regional Medical Emergency Preparedness and Planning (GHOR). This association for public health and safety in the Netherlands is called GGD GHOR. GGD GHOR Nederland is an umbrella organisation from the 25 GGD and GHOR departments spread out over the Netherlands. All activities of the GGD and GHOR agencies make a contribution to maintain, restore and improve the health of all the 17 million Dutch citizens. The main tasks of the GGD GHOR Nederland are:
Representing all 25 local GGD and GHOR agencies and their interest at regional politics, government and national social organisation.
Acquiring and run projects that offer support of the implementation of new policy areas where the GGD’s and GHOR’s agencies contribute and operate.
Offering a professional online community platform for sharing information and knowledge.
[image:10.595.79.409.489.725.2]The GGD is financed by respective municipals per head inhabitant. GHOR is hybrid financed by the state in combination with a financial contribution of the municipal. Variation exists in the amount of money for financing the GHOR regions. This variation is based on demographical factors in combination with local risk factors. GGD GHOR Nederland is financed by all the departments of GGD and GHOR together. What GGD GHOR is and what this umbrella organisation does is shown in the infographic in Figure 1 (In Dutch).
2.2 Development of GGK
The online community platform of GGD Kennisnet is launched and implemented since 2001. The online platform has already been redesigned once in 2011 to get it more up to date. Since 2011, Yard Internet B.V. is providing the services for the online community. The system is built on a Content Management System (CMS) with a selection of standard- and choice selected modules to make it a customized online platform for, in those days, the GGD. In February 2015, the name of GHOR is added after the intensified collaboration with the GGD. Nowadays, the online platform is called GGD GHOR Kennisnet 2.0 (GGK).
[image:11.595.81.428.374.629.2]All GGD and GHOR agencies do finance together the online platform GGK through a membership fee. It is an open network community to share and develop knowledge on. Also, it is a connecting factor between the GGD’s and the GHOR’s to see what is going on in the community and to cooperate online with other relevant stakeholders. The administrator of GGK (Thea Aartsma) and Yard Internet B.V. are responsible for the functional information system management and the further development of GGK. GGKgets twice a year a system update. This updates are executed without input from the community members. As a result, information service design has led to usability problem among the end users (Wijnhoven & Kraaijenbrink, 2008; Wells, 2006). Figure 2 shows the homepage of GGK (in Dutch).
Figure 2 The homepage of GGK (in Dutch)
2.3 Operationalization of GGK
and non-registries. There are also differences between registries too. What the dependencies are will be explained in the next paragraphs of this section.
2.3.1 Professionals
Everyone can create a profile on GGK because of the easy access. Every community member calls a ‘professional’, even if you are not a professional. Stakeholders and other individuals can create a profile too. Mainly, individuals create a new profile to get updates and notifications of (new) vacancies. For GGD and GHOR registries there is an extra secured layer of information accessible. The Information System (IS) recognizes this type of member by the end of the used email address. All employees of the GGD’s and GHOR’s have a @ggd.nl, @ghor.nl or @ggdghor.nl email address. Community members with another email address can only access the general public information or can participate more actively in segments of GGK on invitation of employees of the GGD and GHOR. As a professional you can:
add or remove items on your profile link with other professional
send or receive personal messages make a personal calendar
put items in a favourite list
make use of the suggestion box- and strategic benchmark tool (only for @ggd.nl, @ghor.nl or @ggdghor.nl members)
An end user of GGK can be an individual who does not have a profile. They therefor cannot make use of the above mentioned functions and can only access general information. As a member, it is also possible to place information in themes and working groups (where you are a member of), to start a working group and/or become a member of an already existing (or new) working group.
2.3.2 Themes
The information that is placed in themes is controlled by theme editors. Most theme editors are employees of GGD GHOR Nederland. Theme editors are able to add or remove information within their theme. An example of a theme is ‘antibiotic resistance’ (antibioticaresistentie). All themes contain subjects in public health and safety. All information that is placed in themes has public accessibility for end users with or without a profile. A GGK community member can make use of all functions of all themes. Within a theme, community members can:
Read or place news items, publications, photos and videos Follow or join a blog or forum
Access the calendar
Read about (Dutch) laws and policies
See which working groups belong to this theme and, in necessary, apply for a membership
2.3.3 Working groups
With a membership it is also possible to start a working group and/or become a member of an already existing working group. To access the information that is placed within a working group it is necessary to be a member of a certain group. There are three kinds of working groups that exist: open, semi-open and closed groups. Every group has a group manager. The type of group can be determined by applying for a new one or can be changed by the group manager. Every registered member can enrol to an open group. A member has to apply for a semi-open group and the group manager can accept or reject the request. To become a member of a closed working group, a member has to receive an invitation of the group manager which they can accept or reject. Information in a closed working group is more secured than information in an open group. A specific working group can collaborate online together. Within a specific group, members can find or share multiple kinds of information:
Read or place news items and documents
Participate within the forum and the bulletin board
Access the calendar, the logbook and other members (including those that have recently joined the group).
3. Theoretical framework
Given the need for an increasing importance of a matching online community with the members, there are persuasive needs for such design theories. To fill this gap, a theoretical framework for guiding this research is presented in this section.
3.1 Center for eHealth research roadmap (CeHRes)
A practical process model for eHealth technology called the CeHRes Roadmap (see Figure 3). The roadmap is a holistic and dynamic framework for the development, improvement and implementation of a new or existing (eHealth) ICT system. An analysis of the context is essential to understand how the technology can be improved to get a high quality of the system. The CeHRes roadmap mixes centered design, persuasive technology and business modelling as theoretical background. The human-centered design shows that end users are consulted during the process of design. To involve real end users in the requirements development approach is very helpful to detect and solve usability problems. Business modelling is in the roadmap to set up an optimal fit between the technology and the organizational resources and – procedures. The online community needs to have persuasive features in the redesign of GGK to set up a prospective successful new GGK. The CeHRes roadmap consists out of five phases and each phase has a formative evaluation.
1. Contextual inquiry. Information of the context of use is collected together with the selected end users and professionals
2. Value specification. The collected data from the contextual inquiry is translated into requirements for the information technology and stakeholder values.
3. Design. Based on the requirements out of the value specification, prototyping and design assumptions of the eHealth information technology are created and tested
4. Operationalization. The final and last version of the new information technology is launched and resources are mobilized (for example (e.g.) service and user support)
5. Summative evaluation. The effect of the maintenance is evaluated.
Figure 3 CeHRes roadmap
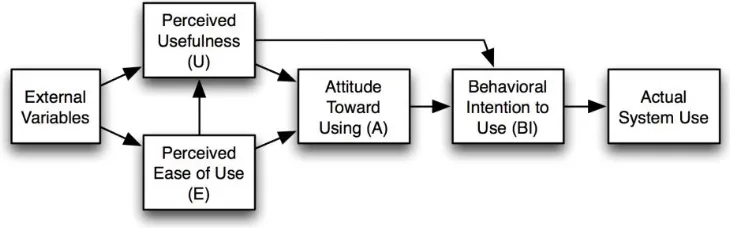
3.2 Theory acceptance model (TAM)
Early research has provided insights into ‘why’ and ‘how’ end users decide about the rejection, adoption and usage of a new information system (IS) (Venkatesh, 2008). A prediction can be made for future user behaviour for the new redesigned GGK. This can be done by taking measurements after usability testing with members of GGK. After the usability, a prospection can be made of the determinants of the user acceptance of the new redesigned GGK (Davis, Bagozzi, & Warshaw, 1989).
[image:15.595.98.463.591.705.2]Figure 4 TAM model. It has two beliefs for people’s acceptance behaviour of a new IS. Perceived usefulness (U) is a major determinant and can be explained as the future end user's subjective probability that using the new information system will increase their job performance within an organizational context. Perceived ease of use (E) is a second determinant of individual’s intention to make use of a new IS. This can be explained as the degree of the future end users can work with the new IS that is free of effort (Davis et al., 1989; Venkatesh, 2000). The proposition of TAM is that computer usage is determined by behaviour intention to us (BI), as being determined by the end user attitude toward using the system (A) and the perceived usefulness (U). (Davis et al., 1989)
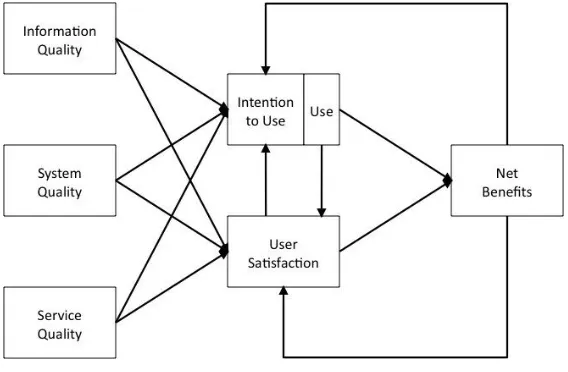
3.3 Information system success model
[image:16.595.78.362.305.491.2]Figure 5 shows the IS success model. This model is a result from the theory that the success of an IS depends on a relationship between six critical dimensions (see Figure 5 IS success model). Information quality refers to the quality of the information that the system is able to deliver or store. This directly impacts the user’s satisfaction and the usage intention of the IS. The overall quality of a system directly impacts the degree of usage intentions and user satisfaction. Information systems are also evaluated according to the service quality. The degree of service directly impacts usage intentions and user satisfaction. Intentions to use or actually system use are influenced by the information-, system- and service quality. Together with user satisfaction, the net benefits are direct influenced by what the system is able to provide. The net benefits are an important dimension of the overall value of the information system to the end user. Net benefits can be e.g. effectiveness and efficiency (DeLone & McLean, 1992).
Figure 5 IS success model
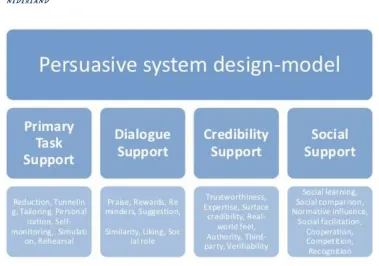
3.4 Persuasive system design model (PSD)
4. Methods
This study presents a qualitative explorative research in combination with a quantitative questionnaire. Multiple and mixed methods are used to collect the data for improving usability of an eHealth system. A structured analyses plan to answer the research questions can be found in this section.
4.1 Literature study
A literature study is to select scientific information for the introduction, theoretical framework, methods and others sections of this research. The aim of this scientific information is to set up a decent research proposal to get the main research question of “What can be improved to GGD GHOR Kennisnet 2.0. to optimize and expand it’ use among the real end user/professionals?” answered. The main sources of data for this research are collected through a systematic search through international and Dutch literature and websites. Scientific articles from Bedrijfskunde (business administration), Behaviour & Information Technology, Communications of the association for IS, Elsevier, International Journal of Medical Informatics, Information system research, Journal of information technology, Journal of medical internet research, Information & Management, Management Science and The international journal on media management. Literature books are used like A practical guide to usability testing, Handboek website usability (manual website usability), Interaction design, Managing information systems, Practical Statistics for Medical Research, Thinking Aloud : Reconciling Theory and Practice, Usability inspection methods and Website usability. Evidence based information can be about acceptation of ICT, Cohen’s Kappa, community supporting platforms, digital platforms, IS Success, online communities, persuasive technology and design, sociability and usability in online communities, system usability scale (SUS), think aloud method, usability, technology acceptance model (TAM), user experience and/or website design.
4.2 Online statistic tool of Yard internet B.V.
Web analytics is a measurement method of observing tracking, monitoring and analysing the data. The online statistic tool of Yard Internet B.V is used to get sub question two “How do professionals of GGD GHOR and other relevant stakeholders currently use GGD GHOR Kennisnet 2.0 in then way of site statistics?” answered. The tool gives an insight and a clear picture about the use of GGK. The measure of current use of GGK is defined in:
1. Amount of members of the community 2. Daily average login over three months 3. Average number of days between logins 4. Placed items on the platform
5. Amount of working groups
8. Percentage of recurrence of members within three months
9. Percentage of members who are transmitting information on the platform, like documents or vacancies
4.3 Usability inspections
A couple of methods from Nielsen (1994) are used for the usability inspection. The main goal is to find usability problems in design of the information system. A heuristic evaluation and a cognitive walkthrough are procedures were experts scrutinize the information in the system and judge every step of it whether it is the correct action or not. A usability test is especially useful for understanding actual user behaviour. The feature inspection also provides options to observe what drives the community members to make use of GGK. The redesigned online platform can only be successful in co-creation with the real end user that was tested (Nielsen, Blatt, Bradford, & Brooks, 1994). Every user test is translated in a transcript which was used to get the results. These results will help to answer multiple sub research questions, namely: “What are the positive and negative experiences of the users of GGD GHOR Kennisnet 2.0?”, “What are practical recommendations for the improvement of the persuasiveness and usability of the GGD GHOR Kennisnet 2.0?” and “How can end users be persuaded to make more intensive use of GGD GHOR Kennisnet 2.0”.
4.3.1 Usability scan - Cognitive walkthrough
A cognitive walkthrough is an expert based usability inspection. It means that it has to be performed by usability experts (Nielsen et al., 1994; Wharton, Rieman, Lewis, & Polson, 1994). The purpose is to explore the usability of a system and to determine usability issues by focusing on the easiness of use and ease of learning for a new user by execute tasks with the technology without given any formal coaching or instructions. As a result of this traditional explorative research, qualitative data is obtained. The cognitive walkthrough procedure exists out of two phases. The first phase is the preparation and the second phase is the evaluation. In the preparation phase, a couple of representative tasks are selected and summarised in actions. In the second phase, the evaluation phase, the interaction among the interface and the user is analysed in depth and based on:
1. Is the effect of using the system desired?
2. Does the user see the menu, label, button where they can make the action with? 3. If they find this, does it have the desired effect?
4. Do they understand the received feedback after this action which gives them self-confidence to go to the next action (Wharton et al., 1994)?
performed the cognitive walkthrough. Two tasks are selected namely a registration on GGKand to link to another professional at the GGD GHOR. Inclusion criteria for the cognitive walkthrough are:
1. Be familiar with the Dutch language 2. Be a new user of the community platform
4.3.2 Usability testing- User testing combined with depth-interviews
Usability testing is an empirical method which gives an indication how the usability of an interface can be improved (Gould & Lewis, 1985). The main goal to improve the information system which is being tested at that time. Other goals are: To improve the process by which product are developed and designed and how easy it is for the end user to navigate through the online platform. The enrolees represent real end user of the online platform. Other inclusions criteria are:
1. The enrolees need to have a registration on GGK
2. The enrolees must be a professional, a member of a group or theme working at the GGD, GHOR or GGD GHOR Nederland
3. The enrolees must be familiar with the Dutch language.
If the enrolees in the usability tests are not a real user, the results out of the usability tests are not valid. If only experienced users should enrol the usability tests, problems can be missed that will cause usability problems. If only less experienced users should enrol the usability tests, a problem can arrive which is not a real usability problem. It is not guaranteed that all usability problems can be uncovered. Multiple enrolees are participating in the usability testing. One enrolee at a time can perform a user test. It is proven that it is not guaranteed that the more enrolees, the more usability problems can be discovered. A ceiling effect is reached and no extra information will be obtained. This is the same with the amount of tasks in one usability test (van der Put, 2006).
4.3.2.1 Subgroups
Table 1 Chosen subgroups for usability testing Subgroups n Voluntary
user
Intensive user group manager 3 no yes
theme editor 3 yes no
professionals 5 yes no
Total 11
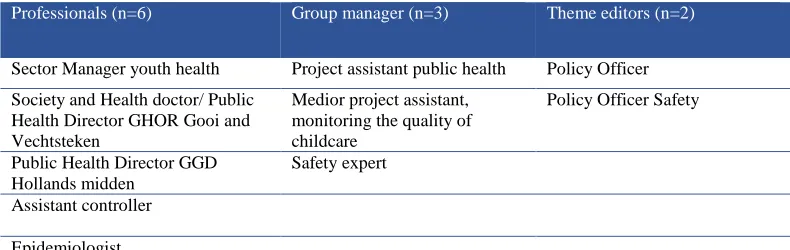
Table 2 Professions of the enrollees
Professionals (n=6) Group manager (n=3) Theme editors (n=2)
Sector Manager youth health Project assistant public health Policy Officer
Society and Health doctor/ Public Health Director GHOR Gooi and Vechtsteken
Medior project assistant, monitoring the quality of childcare
Policy Officer Safety
Public Health Director GGD Hollands midden
Safety expert
Assistant controller
Epidemiologist
Pediatrician
4.3.2.2 Development of the user tests
The scenarios for the usability testing are retrieved from the cognitive walkthrough and in consideration with the administrator of GGK. 21 most common tasks were selected which have a high probability of uncovering usability problems. This test takes about 60 minutes. Within these time limits, the participant:
get a pre-briefing get a pre-interview
executes the selected tasks get a post-test interview; get a de-briefing.
An elimination of the 21 tasks is necessary because the participant cannot fulfil all 21 tasks because of time duration and concentration. Before a decision can be made how many tasks will be selected out of the 21 tasks, a time set for each task has to be secure. Two factors are taken into consideration:
1. The time it will take to do a single task during a test
2. The time the real end user will feel that is acceptable to fulfil a task.
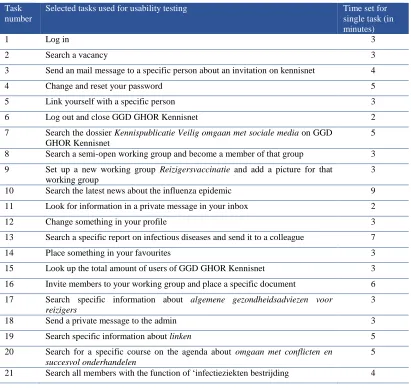
[image:21.595.74.469.228.353.2]Table 3 Selected tasks for usability testing of GGK and estimated single task times in minutes (In Dutch) Task
number
Selected tasks used for usability testing Time set for single task (in minutes)
1 Log in 3
2 Search a vacancy 3
3 Send an mail message to a specific person about an invitation on kennisnet 4
4 Change and reset your password 5
5 Link yourself with a specific person 3
6 Log out and close GGD GHOR Kennisnet 2
7 Search the dossier Kennispublicatie Veilig omgaan met sociale media on GGD GHOR Kennisnet
5
8 Search a semi-open working group and become a member of that group 3
9 Set up a new working group Reizigersvaccinatie and add a picture for that working group
3
10 Search the latest news about the influenza epidemic 9
11 Look for information in a private message in your inbox 2
12 Change something in your profile 3
13 Search a specific report on infectious diseases and send it to a colleague 7
14 Place something in your favourites 3
15 Look up the total amount of users of GGD GHOR Kennisnet 3
16 Invite members to your working group and place a specific document 6
17 Search specific information about algemene gezondheidsadviezen voor reizigers
3
18 Send a private message to the admin 3
19 Search specific information about linken 5
20 Search for a specific course on the agenda about omgaan met conflicten en succesvol onderhandelen
5
21 Search all members with the function of ‘infectieziekten bestrijding 4
[image:22.595.75.486.118.506.2]6 out of the 21 tasks are used for one usability test. This amount is based on research, pilot testing and in cooperation with the supervisors. The six tasks are selected with and online random integer generator . Figure 7 shows 11 different usability tests. To develop 11 different tests scripts for the enrolees are three factors applied:
(1) The tasks have to low in logical and natural order in which the end user will do them.
(2) The tasks that are important to be evaluated have to appear early in the test (rather than near the end). Not all enrolees will complete all the tests within the time limits.
Figure 7 Sampling selections for the enrollees
4.3.2.3 Resources and process during the usability tests
Table 4 shows a list of resources what are needed in total for the usability tests. An individual informed consent form is signed to protect the rights and duties of the researcher and the enrolees. The informed consent form can be found in appendix 9.5 (in Dutch). An informal setting is created during the tests to. After the pre- briefing and the pre- interview, the enrolee has to apply the six tasks. Instead of tasks are scenarios used to tell the enrolee what to do. A scenario is a short description of a task. Every enrolee will have it’ own test script because of the sampling selection. To get a precise task time measurement the sentence “please let the researcher know if you have finished the task and wait for her sign to go further with the next task” is placed after every scenario (Dumas & Redish, 1999.). After the usability test there is a post- test interview, some additional open interview questions and a de-briefing. An overview of the used scenarios in the usability tests can be seen in the appendix 9.4 (in Dutch). Even as one example of a test script for the enrolee and one test script for the researcher (in Dutch).
Table 4 List of used resources for the usability tests Resources needed for usability testing
Time 2-9 minutes for every single task
Hardware Researcher’ laptop connected to power-point
Mobile which is charged
Software GGK (internet connection is necessary)
Hypercam that is running
Mousotron that is running
A pdf. file Not finished yet on the desktop
A JPEG picture Reizigersafbeelding
The mobile app Mini recorder for audio back up Procedures and
instructions
Send media message in electronic mail box to all staff members with a general message
Appointment planning for selected participants with the help of the secretary of GGD GHOR
Send personal electronic mail with invitation text and information about the research to selected participants
If necessary: Send email the same morning to Gea Stegen, Thea Aarstma, Nicol Nijland and/or Vincent Pot when the occur in the usability tests
Paper print the test script for the participant and the researcher
[image:23.595.73.547.508.757.2]4.3.2.3.1 ‘Think aloud’
During the usability test is the ’think aloud’ protocol used to record all comments. A ’think aloud’ protocol means that the enrolee talks about what they think on that moment. In case of silence, the researcher only can stimulate the enrolee to keep talking about their thoughts. This stimulation can only be done by asking general open questions like “What goes through your mind on this moment?". To talk to another person is more natural than thinking out loud alone. This will give the researcher more information about what the participant is thinking and what strategies they are using to solve usability problems (Boren, 2000; Jaspers, Steen, Bos, & Geenen, 2004). Software program Hypercam is used as a screen capture program to record voices and to see what is happening on screen.
4.3.2.3.2 Observation
This method involves a systematic, detailed observation of nonverbal behaviour. It is not possible to record every nonverbal action. Selective, notes were written on a paper during the usability tests. This is done to avoid the ‘Hawthorne effect’ as much as possible. Together with the records from Hypercam, the notes were afterwards analysed to measure satisfaction, frustration and confusion. (Mays & Pope, 1995). 4.3.2.3.3 Interviews
During the usability tests structured interviews were held with the enrolees. Every individual enrolee is exactly asked the same questions. An overview of the used questions can be found in appendix 9.6 (in Dutch). Interviews during usability tests obtain a better understanding about usage of GGK and user experiences. The individual interviews are qualitative measurements. During the usability test there are three moments to interview the enrolee (Dumas & Redish, 1999):
(1) A pre-test interview to get background information about the enrolee to verify the test qualifications of the enrolee what helps to interpret the data from the test. Examples of questions are “What is your job title?” and “How long are you using GGK and why?”;
(2) A post-task interview to get valuations and judgments about the executed tasks. During the test is the enrollee working alone with GGK. After the test, the enrollee can give an immediately reaction about system quality, -content and –service. Examples of questions are “How easy was this task and why was this easy?” and “Where do you use this feature for and why?”;
(3) A post-test interview to get general and specific judgments about the system and the test in general. Examples of questions are “What is the overall rating of GGK and why?” and “What do you like the least of GGK?” (Dumas & Redish, 1999).
4.3.2.4 Measurements at the usability tests
measure the usability include the time to fulfil a task, the number of errors, productively and, user satisfaction and others (Carlson, 2002; Preece & Maloney-Krichmar, 2001). Table 5 provides the usability determinants of success.
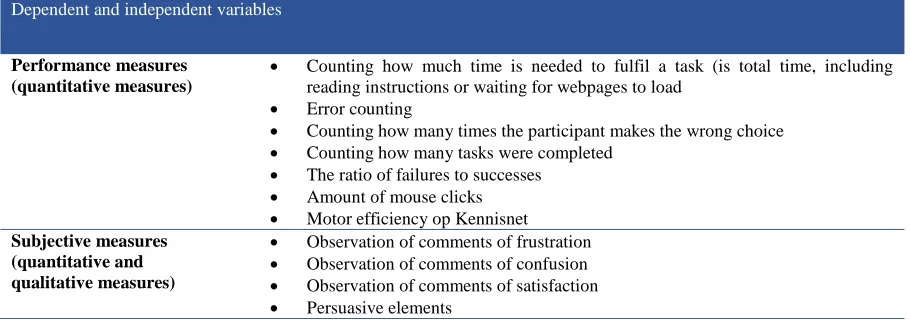
Table 5 the quantitative and qualitative measurements within the task performance
4.3.2.4.1 Inter-rater agreement of the user tests (Cohen’s Kappa)
Research of Landis and Koch (1977) has shown that the assessor is often an important error source during the research. It is important to check the results to a second assessor to examine reliability. The Cohen’s Kappa value is the value that both assessors have given the same answer while checking the results out of the usability testing (Landis & Koch,1977). According to Altman (1990) there is a six level of classification in the forces of the values:
K <0 Bad K 0-0,20 Low K 0.21-0.40 Moderate K 0.41-0.60 Reasonable K 0.61-0.80 Sufficient to good
K 0.80-1.00 Almost perfect (Altman, 1990)
To calculate the Cohen’s Kappa, the user tests first are encoded by the first assessor (the researcher). A transcript is made and all information is taken out and coded by a coding scheme. A second peer assessor from the University of Twente, faculty behavioural management and social science has double-blinds assessed the same information based on the same coding scheme. This is done by two out of the eleven user tests. When the results out of the Cohen’s Kappa are low or bad, a discussion will follow to overcome differences in interpretation (Van Velsen, Van Gemert-Pijnen, Beaujean, Wentzel, & Van Steenbergen, 2012).
Dependent and independent variables
Performance measures (quantitative measures)
Counting how much time is needed to fulfil a task (is total time, including reading instructions or waiting for webpages to load
Error counting
Counting how many times the participant makes the wrong choice
Counting how many tasks were completed
The ratio of failures to successes
Amount of mouse clicks
Motor efficiency op Kennisnet Subjective measures
(quantitative and qualitative measures)
Observation of comments of frustration
Observation of comments of confusion
Observation of comments of satisfaction
4.3.3 Online survey
A survey can help to collect information and suggestions to create more added values for the platform to redesign a system, content and service which is user friendly and applicable in daily practice. Open questions (qualitative data) combined with closed question (quantitative data) are analysed for the first part of the online survey. Examples of open questions are “What features do you use on GGK?” and “Do you have suggestions for improvement of GGK?” Examples of closed questions are “What grade gets GGK?” and “What role do you fulfil on GGK?” A simplified design of the online survey can be found in appendix 9.8 (in Dutch).
GGK has more than 8353 members. Daily practice turns out that a big part of this population is inactive. In an agreement with the supervisors of this research is decided to collect at least 60 questionnaires. This gives a good reflection from the whole online community population. Inclusion criteria for enrolees of the survey are:
1. The enrolees need to have a registration on GGK
2. The enrolees must be a professional, a member of a group or theme working at the GGD, GHOR or GGD GHOR Nederland
3. The enrolees must be familiar with the Dutch language.
Multiple actions are taken to trigger individuals to fill in the online questionnaire, such as a news message on the homepage of GGK and on the homepage of intranet. Within these messages multiple hyperlinks are placed to go straight to the online survey. The whole questionnaire is anonymous to avoid bias like social desired answers.
4.3.3.1 System usability scale (SUS)
5. Results
5.1 Online statistic tool of Yard internet B.V.
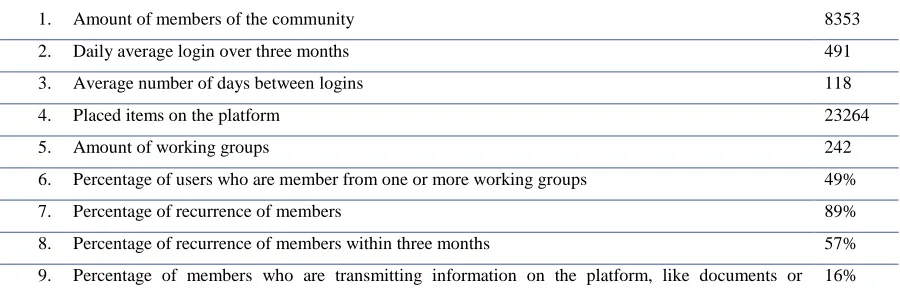
[image:28.595.84.534.297.447.2]On February the 26th 2016, the online communityhad 8353 members with a daily average login over three months of 491. The average number of days between logins is 118 days. In total, 23264 items are placed on GGK. There are online 242 working groups and 49% of the end users is a member of one or more working groups but not every working group is very active in daily practice. The percentage of users that come back on GGK after registration is 89% which is high. The percentage of users who come back within three months is 57% which is quite low. 16% of the end users had placed a document, vacancy or something else on the online platform which is low (see Table 6).
Table 6 Overview of the results out of the online statistic tool
1. Amount of members of the community 8353
2. Daily average login over three months 491
3. Average number of days between logins 118
4. Placed items on the platform 23264
5. Amount of working groups 242
6. Percentage of users who are member from one or more working groups 49%
7. Percentage of recurrence of members 89%
8. Percentage of recurrence of members within three months 57%
9. Percentage of members who are transmitting information on the platform, like documents or
vacancies
16%
5.1 Usability tests
5.1.1 Usability scan - Cognitive walkthrough
A complete overview of the cognitive walkthrough can be found in appendix 9.3. These are the highlights of the results out of the cognitive walkthrough.
Via Google was the link to GGK on top. The clickable link goes direct to the homepage of GGK. It was notifiable that GGK had no secure sockets layer (SSL) certificate. The homepage was restless, uncertain and confusing due to:
(1) A lot of text and the text had a very small font.
(2) A lot of menu bars and sections which were not relevant for every end user like vacancies, last notified professionals and most active professionals.
(3) Some functions were double like the button “register” (4) The home button had a low contrast
vagueness. Not in the manual, not in the form of a little pop-up or in automatic feedback of the system. It was unclear what email address to use for GGK and what effect it had in the usage of GGK. An extra secured layer should become visible when somebody registers with @ggd.nl, @ghor.nl or @ggdghor.nl. This information was not available at GGK. The log in procedure gives personalized content to me as a user. It was clear how to create a new password because of the instructions of GGK. To read all the terms and conditions took too much time but was mandatory to achieve the desired effect to register myself. The procedure to request for a new password was not secured. I immediately received a new password by email which I could use directly. There were unclear navigation structures when I wanted to link with another professional. It was not easy to find where the feature was on GGK. Some menu bars, where the possibility was expected, were not clickable e.g. the requests to link with other professionals (Verzoeken om te linken met professional). To find a professional in the section “professionals” was easy. Although, to click the mandatory three labels “GGD”, “GHOR” and “Overig” (remaining) was unclear. When they were off, they were on. And when there were on, they were off. Via a professional, I found the button to link with another professional. GGK seems to be the place to find and share information on. The information founded on GGK gave satisfaction to me. The possibility to cooperate in a virtual group could motivate the end user.
5.1.2 Usability testing- User testing combined with depth-interviews
The user tests were conducted in combination with a pre- and a post interview. For the result section, the
interviews and tasks are separately analyzed. The tasks were mainly used to obtain the quantitative results
and the depth interviews were mainly used in order to arrive at qualitative data. All quantitative results can
be found in appendix 9.9 and all qualitative results can be found in appendix 9.10. Eleven participants
(n=11) had enrolled the usability tests. Table 7 shows the characteristics of the study sample. It shows that 64 % of enrollees were female. 82% of the enrollees had a university background and had a longer
registration duration, namely between the five and fifteen years. A registration was made because GGK is
a part of their work. Social influence in the form of promotion of GGK from colleagues was also seen as a
motivation to create an account. Other enrollees used the registration initially to track jobs and to find
information. A registration on GGK seemed to offer a possibility for a new job. 73% of the enrollees had
received no training in the form of an introductory movie on GGK. Those who had seen this movie
thought it was informative but not quite in-dept. Every enrollee used the internet every day for several
hours which gave them a lot of online computer experience. GGK was used varied among the enrollees
Table 7 User characteristics of the usability tests User characteristics
Professionals divided in subgroups
gender education registration duration
training in the form of introduction movie internet usage GGK usage
Subgroup professionals (n=6)
Sector Manager youth health Female university 2001 no daily weekly
Society and Health doctor/ Public Health Director GHOR Gooi and Vechtsteken
Male university 2001 yes daily weekly
Public Health Director GGD Hollands midden
Male university 2002 no daily monthly
Assistant controller Female university 2008 no daily daily
Epidemiologist Female university 2001 no daily weekly
Pediatrician Female university 2015 no daily monthly
Subgroup group manager (n=3)
Project assistant public health Female university 2011 yes daily weekly
Medior project assistant,
monitoring the quality of childcare
Male higher vocational
2008 no daily daily
Safety expert Male higher vocational
2014 yes daily daily
Subgroup theme editor (n=2)
Policy Officer Female university 2007 no daily daily
Policy Officer Safety Female university 2007 no daily weekly
In total, 88 quotes were assigned to the inter-rate agreement to examine reliability. The calculated Cohen’s Kappa was -0.07 which is bad. This can be a result due to the extensive and unclear coding scheme. Another possibility could be that the used quotes out of the user testing were not clear for the second assessor because they were not placed in context. To find the cause of the bad Cohen’s Kappa, a meeting with the second assessor was organized. The quotes were listed again and by a discussion the differences in coding were aligned.
5.1.2.1 Task performance
Tasks could be accomplished in the shortest duration of time with a minimum amount of mouse clicks. The results showed that there were differences in performance between enrollees (see
ratios were calculated by dividing the unaccomplished tasks by the total amount of executed tasks. The most ideal outcome for the failure to success ratio should be zero.
Table 8 Achieved target goals and failure ratio of the user tested
Subgroup individual
failure to success ratio
individual mean motor efficiency Theme editor
1 0,67 0,10
2 1,00 0,00
Group manager
4 0,83 0,19
6 0,33 1,00
7 0,33 0,54
Professionals
3 0,67 0,73
5 0,50 0,47
8 0,17 0,55
9 0,67 0,23
10 0,50 0,38
11 0,17 0,42
Table 9 shows the averages in performance measurements of all three subgroups. The subgroup group managers had the lowest failure ratio of 37,50% but needed on average the longest time per task (04:22,7 minutes). Their ideal average per task would be 01:25,8 minutes which makes 04:22,7 minutes a bit more than three times slower. They also had on average the most number of mouse clicks (24,12) and made the most use of the mouse wheel per task (144, 71). Their ideal average amount of mouse clicks per task would be 6,17 which made 24,12 almost four times higher. The group managers made on average fewer errors (4,12) and wrong choices per task (2,53) which resulted in a higher motor efficiency (0,71). The group managers were the most expressive in their emotions. On average, they were the most frustrated during the task performance (0,88) and the most satisfied (0,94). Satisfaction could be a result when targets are achieved.
confusion (0,83) and satisfaction (0,33). This could be a result that they probably were not aware of errors and/or wrong choices.
[image:32.595.78.502.295.559.2]The subgroup professionals had a failure ratio of 44,44% and needed on average 04:04,7 minutes per task. Their ideal task times average would be 01:42,9 minutes which makes 04:04,7 minutes a bit more than two times slower. They needed on average 21,53 amounts of mouse clicks and used 94,47 times the mouse wheel per task. Their ideal average amount of mouse clicks would be 7,69 which made 21,53 almost three times higher. The professionals made per task on average 5,42 errors and 3,42 wrong choices. Their average motor efficiency was 0,47 and were the most confused per task (1,53). A complete overview of all performed task results can be found in the appendix.
Table 9 Task performance results of the subgroups Overall mean task time in
minutes error counting wrong choices false ratio amount of mouse clicks mouse wheel motor efficiency Subgroup theme editors
02:23,4 4,60 3,00 83,30% 21,30 114,00 0,21
Subgroup group manager
04:22,7 4,12 2,53 37,50% 24,12 144,71 0,71
Subgroup professionals
04:04,7 5,42 3,42 44,44% 21,53 94,47 0,47
Overall mean observation of comments of frustration observation of comments of confusion observation of comments of satisfaction Subgroup theme editors
0,25 0,83 0,33
Subgroup group manager
0,88 1,29 0,94
Subgroup professionals
0,72 1,53 0,81
5.1.2.1.1 Persuasive features
profile (n=3). Another persuasive feature was how to find vacancies. None of the enrollees who had to perform this task (n=5) had problems to navigate to find an interesting vacancy. Some tunneling principles were good to guide users along the way to work on their target goals. This was counting for the icon of the magnifying glass (search functionality) and the icon of an envelope (message box).
5.1.2.1.2 Usability problems
An analysis of the usability tests gave more insight in the usability problems of GGK. These problems could contribute to the question why GGK is not used and not optimal utilized. At the same time are these the most important system requirements of GGK. In total, 132 (n=132) problems were identified by the enrollees during the task performances. Most problems (n=68) with GGK were caused by unclear navigation structures. It was not clear where to find the needed information on GGK to reach their goals. Presented information on GGK was unclear to the user, e.g. menu bars and headings. The existing search function was not effective (no results at all or no relevant results), not efficient (to many results) and was distrust (n=30). Within the existing search function one technical problem occurred. When enrollees wanted to search the ‘enter’ button did not work. Only a mouse click on the search heading (zoeken) worked. Navigation problems and/or problems with the search functions resulted in too much time and effort to the user (n=14). It also took too much time and effort to set up a new working group. Group activation had to be more quickly to keep enrollees motivated for their tasks (lack of visible delight). Usability problems occurred because when there was no automatic feedback of GGK (n=6). Users needed to get feedback of the system to get informed. Especially at the search function. It was not visible if the search function was running or not. Automatic feedback was also needed by applying for a new working group. For users it was unclear when a requested working group was activated or already in place. Five out of the eleven enrollees had problems (n=5) with logging in to GGK. The problem was that they did not know what their user name and password combination was.
5.1.2.2 Depth-interviews
User characteristics for the pre- and post-interviews are in this section the same as the user characteristics from the user testing. In total, 163 positive and 165 negative aspects of GGK were pointed out in the interviews. In general, all enrollees were quite satisfied about the design of GGK.
plays a part in the voluntary use of GGK (n=22). This is mainly considered whether others were using the similar functions or not. By themselves was the news reading, search for documents and to stay connected with other community members the most important reasons for voluntariness of use (n=8).
All eleven enrollees also had negative aspects (n=165) about the design of GGK. There were complaints
about poor user friendliness (n=80) or they were not persuaded to make use of certain features (n=16).
Some features and icons were unclear related to the user requirements, -values and -needs. This was
concerning the feature and icon of the personal dashboard, the message box, the discussion board and to
link with another professional (Linken). The homepage was mismatching because it was not tailored and
personal to the end user. Within themes, groups and documents was difficult to find information due to
poor navigation structures (n=22). Dragging documents within a group or between groups was a lacked
feature on GGK. Even as to attach a file to a message. The search function was inefficient, not effective
and not available in multiple features (n=18). The existed search function was unclear because the user did
not know how to use the offered menu bars. Users were avoiding this feature and results were not trusted.
Nowadays, it takes too much time and effort to find the necessary information (n=11). Suggestions were
made to offer more possibilities to search for information, like in themes and the agenda. Due to this, less
hedonism was spotted (n=9). The enrollees had also some negative aspects about the operationalization of
GGK (n=63). Not GGK but Google and email were used as alternative communication channels to search
for – and to share information more easy. Another negative point was that the interface of GGK is not
responding on smaller interfaces, like on a smartphone or tablet.
5.2 Online survey
End user enrolment in the online survey was lower than expected. Only 46 out of the 8676 community members who were approached responded to the invitation to fill in the online survey. No insights were gained which barriers inhibited the enrolment for participation. Table 10 shows the study sample of the online survey (n=46) in part one and part two. They were all Dutch native speakers. Most of them were female (n=38) and almost everybody had a high level of education (n=45). There was a high variety of professions which gave a good picture of the real end user. Most common occupations were (senior) communication advisor (senior communicatie adviseur), consultant (adviseur), policy advisor (beleidsadviseur) and policy assistant (beleidsmedewerker). Internet usage was, as expected, very high (87%). The enrolees made different quantity use of GGK. This quantity variated from daily usage (37,0 %), weekly usage (34.8) and multiple times daily usage (26.1%). 56.5% of the enrolees had a shorter registration between the zero and five years. 23.9% had a longer registration between 10 and 15 years. The implementation is since 15 years. Most enrollees were only registered as a professional (80.4 %) and were not been trained by the instruction movie on the homepage (76.1%). The instruction movie was seen by 11
enrollees and was clear but not really rememberable (n=2). GGK received an overall mean grade of a 6.9
Table 10 User characteristics of GGK (online survey)
Characteristics n %
Gender (n=46) Male
Female
8 38
17.4 82.6
Education (n=46) MBO
HBO WO
Else: HBO+, PhD
1 19 24 2 2,2 41.3 52.2 4.3
Internet usage (n=46) Multiple times daily
Daily Weekly Monthly Yearly 40 4 2 0 0 87.0 8.7 4.3 0.0 0.0
GGK usage(n=46) Multiple times daily
Daily Weekly Monthly Yearly 12 17 16 0 1 26.1 37.0 34.8 0.0 2.2
Registration duration (n=46) 0-5 years
5-10 years 10-15 years 26 9 11 56.5 19.6 23.9
Roles on GGK (n=46) Professional
Group manager Theme editor Admin 37 23 13 5 80.4 50.0 28.3 10.9 Training by instruction movie
(n=46) Yes No 11 35 23.9 76.1
GGK Grades (n=46) 1
6 7 8 1 10 21 14 2.2 21.7 45.7 30.4
Function (most common) communication advisor
consultant policy advisor policy assistant project officer researcher P&O employee Project assistant 4 4 4 4 2 2 2 2 0.087 0.087 0.087 0.087 0.043 0.043 0.043 0.043
5.2.1 Online Survey part 1
Table 11 Overview of most used features on GGK Most used features of GGK
n %
news-reading 17 37
professionals 12 26
working groups- general 9 20
searching for information 8 17
placing documents 7 15
working group- content specific 7 15
themes- general 6 13
intranet 5 11
posting a message 5 11
bulletin board 5 11
placing information 5 11
[image:36.595.73.352.545.699.2]Table 12 shows all mentioned features which were not used on GGK. Most enrollees (41%) reported that they were not using features which they do not know they existed. The search feature was not used (7%) because it was inefficient and ineffective. Link requests (7%) were not used because the enrollees use Linked in as an alternative communication channel. The blog feature (7%) was hardly used among the enrollees because social influence plays evidently an important role. The dashboard was not used (7%) because of the design was not convincing enough. As a result, the added value of the dashboard was missing. The personal agenda was not used (4%) because the enrollees used Outlook as an alternative communication channel. The bulletin board (4%) was not used because this was not compatible in daily practice.
Table 12 Overview of not used features of GGK Non used features on GGK
n %
not known features 19 41
search functionality 3 7
link requests 3 7
blog 3 7
dashboard 3 7
agenda 2 4