Original Article
The association of renal function with arterial stiffness
Jin-Yao Zhang, Ping Ye, Xiao-Na Wang, Yong-Yi Bai, Qi-Wei Zhu, Hong-Mei Wu Department of Geriatric Cardiology, General Hospital of Chinese PLA, Beijing 100853, China Received February 21, 2016; Accepted May 15, 2016; Epub July 15, 2016; Published July 30, 2016
Abstract: Objective: This study aimed to investigate the relationship between renal function and arterial stiffness.
Methods: A longitudinal study was conducted which included 1447 people who with on severe disease and finished median 4.8 years follow-up, then the estimated glomerular filtration rate (eGFR) was calculated by Chronic Kidney Disease Epidemiology Collaboration equations (CKD-EPI) and aortic arterial stiffness was representative with pulse wave velocity (PWV) (carotid-femoral PWV and carotid-radial PWV) at first visit (from 2007 to 2009) and second visit (2013). The baseline data were calculated according to eGFR by quartile. A Pearson regression analysis and a step -wise multiple linear regression analysis were performed to evaluate the association between baseline parameters
and PWV. Results: There were 361 cases in Quartile 1 (eGFR ≥ 104.34 ml/min), 362 cases in Quartile 2 (96.09 ml/min ≤ eGFR < 104.34 ml/min), 365 cases in Quartile 3 (86.29 ml/min ≤ eGFR < 96.09 ml/min), 360 cases in Quartile 4 (eGFR < 86.29 ml/min). The regression analysis showed that besides age and blood pressure, eGFR also related with PWV (cf-PWV: r = -0.39, P < 0.001; cr-PWV: r = -0.068, P = 0.013), and the change of PWV during the follow-up was based on the baseline of PWV as well as eGFR change; when adjusted for age and blood pressure, cf-PWV was different in Quartile 4 and Quartile 1 with significance. Conclusion: Age, blood pressure and eGFR were all related with PWV and the changes of eGFR were associated with the change of PWV by adjusting for gender, age
and multiple risk factors.
Keywords: eGFR, CKD-EPI, cf-PWV, cr-PWV
Introduction
Cardiovascular disease is a leading cause of morbidity and mortality in patients with chronic
kidney disease (CKD) [1], and the increase of arterial stiffness has been to have a significant
impact on predicting mortality in end-stage
renal disease patients [2]. Previous studies
have shown that impaired renal function may predispose to increased arterial stiffness and most of them indicated negative relationship between arterial stiffness index (pulse wave velocity (PWV), blood pressure (BP),
augmenta-tion index (AI)) and CKD) [3-5] via multiple
pathogenic mechanisms, and associated with increased cardiovascular morbidity and
mortal-ity [6]. In fact, impaired renal function is always
regarded as a risk factor for vascular disease,
and is associated with an increasing PWV [7].
In addition, the treatment targeting blood ves-sel stiffness could also protect the kidney
func-tion [8].
Previous studies have shown that increased arterial stiffness is associated with higher
pro-teinuria [9] but not with CKD [10]. Some longitu -dinal study results are controversial. The study from Framingham indicated that PWV in base-line had no association with incident renal
dis-ease [11]. Arterial stiffness using PWV was not correlated with decline in renal function [12].
But in ABC study, PWV was associated with
CKD among older adults [13]. Decline in renal
function is related to higher levels of PWV in a
community sample [14]. Although previous
studies have reported relationship between renal function and arterial stiffness, but most
of them was cross-section study, involved CKD
patients only, or arterial stiffness affected renal function. So we performed a large longitudinal study which measured arterial stiffness
chang-es of renal function and changchang-es of PWV with follow-up. (4) Observe different part of the mea-surement of PWV.
Materials and methods
Study population
A total of 1859 communal people living in Pingguoyuan area in Beijing in China joined this cross-sectional study as described previously
[15]. When we finished the first follow-up in
September 2007 and January 2009, 1680 people were involved, people who suffered severe disease such as collagenases, endo-crine and metabolic diseases (except diabetes
mellitus), inflammation, neoplastic disease, or
severe liver or renal disease was excluded. 233 people were lost and exclude from analysis dur-ing 4.8 years follow-up. There are totally, 1447 persons were included in the statistics.
This study has been approved by the ethics
committee of People’s Liberation Army General
Hospital, and written informed consent was obtained from all participants.
Follow-up and outcome assessment
People were second interviewed during Fe- bruary 1 to September 30, 2013 with a stan-dardized questionnaire and visited by physician investigators. We gathered demographic infor-mation, medical history, blood pressure, anth- ropometric measurements and biochemical measurements. 1680 people were followed during a median 4.8 years, 233 people were lost or excluded. 1447 people were absorbed in analysis (follow-up rate 86.1%).
Clinical data collection
We collected age, sex, height, weight, prevalent diseases, family history of CVD, lifestyle factors through a standardized questionnaire and measured systolic blood pressure (SBP) and diastolic blood pressure (DBP) by trained doc-tors. Height and weight were acquired in erect position and no shoes. Body mass index (BMI) was calculated as weight in kilograms divided by the square of height in meters. Blood pres-sure was taken two times in the right brachial artery within 5 minutes, and calculated the average. Lifestyle included smoking status and drinking status that subdivided into current, for-mer, or never.
Biomarker variable determination
We achieved lipid profile, liver and kidney func -tion indices with an automated analyzer (Roche Cobas e601). Blood samples were collected between 8 am and 10 am at least fasting 12 h. Blood sample were measured include total
cho-lesterol (TC), triglyceride (TG), low-density lipo -protein cholesterol (LDL-C), high-density lipo-protein cholesterol (HDL-C), fasting blood
glu-cose (FBG), creatinine (Cr). The estimated glo
-merular filtration rate (eGFR) was calculated using the following Chronic Kidney Disease Epidemiology Collaboration equations (CKD-EPI): GFR = 141 × min (Scr/κ,l)α × max (Scr/ κ,l)-1.209 × 0.993Age × 1.018 [if female] × 1.159 [if black]. Scr is plasma creatinine (mg/dL), κ is 0.7 for females and 0.9 for males, α is -0.329
for females and -0.411 for males, min is the
minimum of Scr/κ or 1, max is the maximum of Scr/κ or 1. All biochemical variables were
acquired in the same laboratory, obeyed the criteria of the World Health Organization Lipid Reference Laboratories.
Measurements of arterial properties
Aortic arterial stiffness was representative with pulse wave velocity (PWV), which was assessed in the morning, quiet environment and stable temperature by using the Complior SP device (Artech Medical, PANTIN, France). The
strain-gauge transducers were placed at the fixed
right side of carotid-femoral or femoral-radial arteries. PWV was automatic calculated ac- cording the pulse transit time and distance between two sites. PWV (m/s) = distance (m)/
transit time (s) [16]. The carotid-femoral PWV
(cf-PWV), carotid-radial PWV (cr-PWV) was acquired. Measurements were repeated over 10 cardiac cycles repeat, the mean value of PWV was used in the further analysis.
Definition of variables
Essential hypertension was defined as systolic BP ≥ 140 mmHg or diastolic BP ≥ 90 mmHg or
someone was taking antihypertensive therapy.
Diabites mellitus (DM) was defined as (i) fasting blood-glucose ≥ 7.0 mmol/l or blood-glucose ≥ 11.1 mmol/l with OGTT (ii) symptom of hyper
-glycemia and random blood-glucose ≥ 11.1
mmol/l (iii) someone was taking hypoglycemic
Drunk was defined as someone drunk once a
week. Body mass index (BMI) equal weight (kilograms) divided by the square of height (meters).
There are total 1447 subjects in the study, summarized in Table 1. Mean age in baseline was 61.4 years, 59.98% was women. The
[image:3.612.95.521.84.307.2]base-line data were calculated according to eGFR by Table 1. Characteristics of the subjects categorized by eGFR (CKD-EPI, ml/min) levels at baseline
Variable Overall (≥ 104.34)Quartile 1 (96.09-104.33)Quartile 2 (86.29-96.08)Quartile 3 Quartile 4(≤ 86.29) P
No. of subjects 1447 361 362 365 360
Age (y) 61.40±11.4 50.89±8.73 55.44±7.91* 62.60±9.25* 67.70±9.79* < 0.001
Current smoking [n (%)] 380 (26.26) 75 (20.77) 98 (27.07)* 94 (25.75)* 112 (31.11)* < 0.001
Hypertension (n) 755 (52.17) 125 (34.62) 157 (43.37)* 237 (64.93)* 235 (65.28)* < 0.001
Diabetes (n) 302 (20.8) 71 (19.66) 76 (20.99) 78 (21.36)※ 77 (21.38)※ 0.135
BMI 25.41±3.32 25.31±3.30 25.51±3.36 25.45±3.53 25.53±3.25 0.819
TG (mmol/l) 1.90±1.24 1.73±1.12 1.88±1.32 1.83±1.36 1.76±1.13 0.319
TC (mmol/l) 5.03±0.93 4.91±0.96 5.03±0.86 5.17±0.95※ 4.98±0.89 0.001
HDL-C (mmol/l) 1.38±0.36 1.41±0.36 1.38±0.36 1.41±0.37 1.33±0.35※ 0.003 LDL-C (mmol/l) 2.91±0.71 2.85±0.75 2.87±0.69 3.01±0.72※ 2.91±0.71 0.012 SBP (mmHg) 128.74±17.71 123.13±15.99 126.57±16.28 131.57±18.03* 133.25±18.62* < 0.001
DBP (mmHg) 76.92±10.23 77.60±9.66 77.73±10.17 76.53±9.97 76.41±10.89 0.168 FBG (mmol/L) 5.39±1.65 5.48±1.94 5.43±1.59 5.33±1.58 5.28±1.30 0.306 eGFR (ml/min/1.73 m2) 94.2±14.3 11.40±5.09 100.14±2.35* 91.56±2.65* 74.53±9.76* < 0.001
cf-PWV 11.20±2.79 9.76±1.84 10.52±1.89* 11.84±2.98* 12.37±3.43* < 0.001
cr-PWV 9.085±2.47 8.53±1.37 8.86±1.69 9.49±1.87 9.45±3.94 < 0.001
* < 0.01, ※ < 0.05. Notes: Continuous variables (Age, BMI, TG, TC, HDL-C, LDL-C, SBP, DBP, FBG, eGFR, cf-PWV, cr-PWV) were expressed as mean (± SD) or median (interquartile range), and categorical variables (Current smoking, hypertension, diabetes) were expressed as counts and
percentages. Abbreviations: BMI, body mass index; TC, total cholesterol; TG, triglyceride; LDL-C, low density lipoprotein cholesterol; HDL-C, high density lipoprotein cholesterol; FBG, fasting blood glucose; SBP, systolic blood pressure; DBP, diastolic blood pressure; eGFR, estimated glomeru
-lar filtration rate; cf-PWV, carotid- femoral PWV; cr-PWV, carotid-radial PWV.
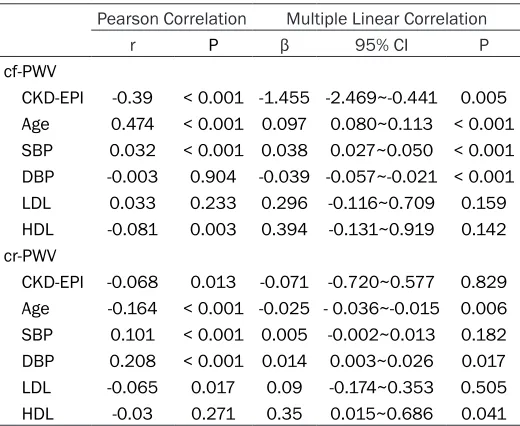
Table 2. Univariate and Multiple linear regression analysis of baseline parameters and follow-up arterial stiffness
Pearson Correlation Multiple Linear Correlation
r P β 95% CI P
cf-PWV
CKD-EPI -0.39 < 0.001 -1.455 -2.469~-0.441 0.005 Age 0.474 < 0.001 0.097 0.080~0.113 < 0.001 SBP 0.032 < 0.001 0.038 0.027~0.050 < 0.001 DBP -0.003 0.904 -0.039 -0.057~-0.021 < 0.001
LDL 0.033 0.233 0.296 -0.116~0.709 0.159
HDL -0.081 0.003 0.394 -0.131~0.919 0.142
cr-PWV
CKD-EPI -0.068 0.013 -0.071 -0.720~0.577 0.829
Age -0.164 < 0.001 -0.025 - 0.036~-0.015 0.006 SBP 0.101 < 0.001 0.005 -0.002~0.013 0.182 DBP 0.208 < 0.001 0.014 0.003~0.026 0.017
LDL -0.065 0.017 0.09 -0.174~0.353 0.505
HDL -0.03 0.271 0.35 0.015~0.686 0.041
Notes: Adjust for age, BMI, TC, TG, HDL, LDL, SBP, DBP, hypertension, diabetes. Abbreviations: BMI, body mass index; TC, total cholesterol; TG, triglyceride; LDL-C, low density lipoprotein cholesterol; HDL-C, high density lipoprotein cholesterol; SBP, systolic blood pressure; DBP, diastolic blood pressure; cf-PWV, carotid-femoral PWV; cr-PWV, carotid-radial PWV.
Statistical analysis
Continuous variables are expressed as the mean ± standard deviation (SD) and analyzed with Student’s t-tests. Dichotomous variables are presented as numbers and
percent-ages and analyzed with χ2 test. A
Pearson regression analysis and a stepwise multiple linear regression analysis was performed to evaluate the association between baseline parameters and follow-up arterial stiffness.
All analyses were conducted using SPSS software for Windows, version
13.0 (SPSS, Chicago, IL, USA). P <
0.05 were considered statistically
significant.
Result
[image:3.612.91.351.401.614.2]quartile, There were 361 cases in Quartile 1
(eGFR ≥ 104.34 ml/min), 362 cases in Quartile
2 (96.09 ml/min ≤ eGFR < 104.34 ml/min), 365 cases in Quartile 3 (86.29 ml/min ≤ eGFR < 96.09 ml/min), 360 cases in Quartile 4 (eGFR < 86.29 ml/min). The average age increased with eGFR increasing, smoking rate and hyper -tension rate was much higher in Quartile 3 and 4 than Quartile 1 and 2, so as the PWV baseline.
Correlation between baseline parameters and follow-up arterial stiffness
We analyzed baseline parameters with
follow-up PWV. Adjusted for age, BMI, TC, TG, HDL, LDL, SBP, DBP, hypertension, diabetes, eGFR
in baseline was related with cf-PWV over 4.8 years follow-up in Pearson and Multiple linear correlation. Age, SBP was related with follow-up cf-PWV (Table 2).
Correlation between baseline CKD-EPI, change CKD-EPI and PWV
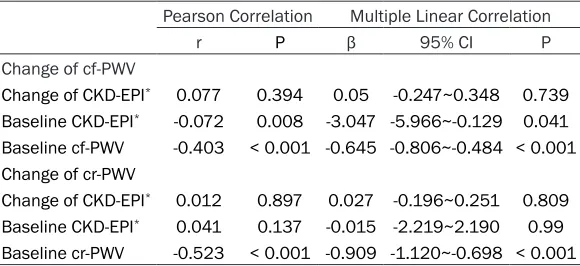
With Pearson and Multiple linear correlation
analysis, baseline CKD-EPI has relationship
with change of cf-PWV follow-up 4.8 years. Baseline PWV has relationship with change of
PWV. Change of CKD-EPI has no relationship
with change of PWV (Table 3).
Correlation between change of eGFR and change of PWV
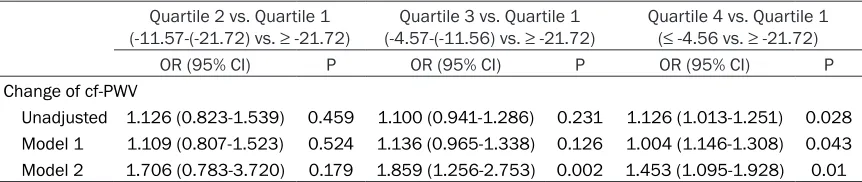
Comparison quartile data between change
of eGFR and change of PWV over follow-up, quartile 4 was significant association with
quartile 1 (OR, 1.126; 95% CI, 1.013-1.251; P =
predicting cardiovascular mortality in this
patient population [17]. On renal function and
PWV, there are some contradictory results. Some studies have indicated that relationship
between PWV and the renal function [11-13].
The study from Framingham indicated that PWV in baseline had no association with
inci-dent renal disease [11]. But in ABC study, PWV was associated with CKD among older adults [18]. These longitudinal data were examined
PWV in baseline and compared with change of renal function in follow-up. A cross-sectional
study showed that Mild and moderate CKD was
related with the arterial stiffness in elderly
adult [19]. A significant association between
PWV and renal function was suggested in type
2 diabetes patients [18]. These study indicated
relationship between PWV and diseases. The pathological mechanisms underlying the inter-action between arterial stiffness and renal function have been reported. It’s hypothesized that decline in renal functioning is associated with atherosclerosis due to endothelial dys-function and to arteriosclerosis related to
thick-ening of the media, calcification, and fibrosis. It has also related that oxidative stress, inflam -mation, uremic toxins, and dyslipidemia play a role in endothelial dysfunction and vascular
cal-cification, vascular smooth muscle hypertro -phy, and collagen deposition and that
cross-linking influences medial thickening, calcifica
-tion, and fibrosis [20, 21].
[image:4.612.92.382.96.229.2]Most research is committed to the clear PWV affect kidney function. That means increased arterial stiffness can be adverse effects on the renal function. But instead, can the changes of renal function affect arterial stiffness? We
Table 3. Effect of Baseline CKD-EPI and Change of CKD-EPI on
Change of arterial stiffness
Pearson Correlation Multiple Linear Correlation
r P β 95% CI P
Change of cf-PWV
Change of CKD-EPI* 0.077 0.394 0.05 -0.247~0.348 0.739
Baseline CKD-EPI* -0.072 0.008 -3.047 -5.966~-0.129 0.041
Baseline cf-PWV -0.403 < 0.001 -0.645 -0.806~-0.484 < 0.001 Change of cr-PWV
Change of CKD-EPI* 0.012 0.897 0.027 -0.196~0.251 0.809
Baseline CKD-EPI* 0.041 0.137 -0.015 -2.219~2.190 0.99
Baseline cr-PWV -0.523 < 0.001 -0.909 -1.120~-0.698 < 0.001 Notes: *natural logarithm transformed. Covariates in the multiple-adjusted models
included age, gender, baseline CKD, change in CKD, baseline PWV. Time between visits.
0.028). There was same results adjusted gender and age (OR, 1.004; 95% CI, 1.146-1.308; P = 0.043), or adjusted gender, age,
BMI, TC, TG, HDL, LDL, SBP,
DBP, hypertension, diabetes (OR, 1.453; 95% CI, 1.095-1.928; P = 0.010) (Table 4).
Discussion
need a community-based longitudinal study to uncover the relationship between renal func-tion and arterial stiffness in general popula-tion. One longitudinal study which was commu-nity-based showed that decline in renal
func-tion was associated with higher cf-PWV [14].
This study involved 482 subjects and follow-up 4-5 year and only adopted cf-PWV. We have completed larger research based on the com-munity people.
The first finding of this study is that through the large sample, longitudinal study definite
about the relationship between kidney function
and PWV in Chinese. Kawamoto had found that decreased eGFR is associated with an
increased risk of arterial stiffness in
communi-ty residents [22]. We had found renal function
of women in communist was associated with arterial stiffness in cross-section study before
[23]. In this study, eGFR has been found rela -tionship with PWV at baseline. During the fol-low-up period of 4.8 years, we still found base-line renal function was associated with arterial stiffness.
The second important finding of this study is
relationship between changes of PWV and changes of renal function. During the follow-up 4.8 years, baseline renal function does not rep-resent the future changes of PWV, but renal function changes is associated with future PWV changes. That means a person whose kid-ney function is poor, not necessarily PWV is poor in the future; if the deterioration of renal function, so his PWV is deteriorating.
eGFR has been found relationship with cf-PWV and cr-PWV at baseline. eGFR is also related to
follow-up cf-PWV and cr-PWV. But the baseline
eGFR did not correlate with variations in PWV.
The changes of renal function associated with the change of PWV.
Disclosure of conflict of interest
None.
Address correspondence to: Ping Ye, Department of
Geriatric Cardiology, General Hospital of Chinese
PLA, Beijing 100853, China. Tel: +86 10 88611022; Fax: +86 10 66876349; E-mail: [email protected]
References
[1] Kuo TH, Yang DC, Lin WH, Tseng CC, Chen JY,
Ho CS, Cheng MF, Tsai WC and Wang MC. Compliance index, a marker of peripheral arte-rial stiffness, may predict renal function de-cline in patients with chronic kidney disease. Int J Med Sci 2015; 12: 530-537.
[2] London GM, Pannier B and Marchais SJ. Vascular calcifications, arterial aging and arte -rial remodeling in ESRD. Blood Purif 2013; 35: 16-21.
[3] Mourad JJ, Pannier B, Blacher J, Rudnichi A,
Benetos A, London GM and Safar ME.
Creatinine clearance, pulse wave velocity, ca-rotid compliance and essential hypertension.
Kidney Int 2001; 59: 1834-1841.
[4] Wang MC, Tsai WC, Chen JY and Huang JJ. Stepwise increase in arterial stiffness corre-sponding with the stages of chronic kidney
dis-ease. Am J Kidney Dis 2005; 45: 494-501. [5] Townsend RR, Wimmer NJ, Chirinos JA, Parsa
A, Weir M, Perumal K, Lash JP, Chen J, Steigerwalt SP, Flack J, Go AS, Rafey M, Rahman M, Sheridan A, Gadegbeku CA,
Robinson NA and Joffe M. Aortic PWV in chron-ic kidney disease: a CRIC ancillary study. Am J Hypertens 2010; 23: 282-289.
[6] Yoon HE, Shin DI, Kim SJ, Koh ES, Hwang HS,
Chung S and Shin SJ. Brachial-ankle pulse wave velocity predicts decline in renal function and cardiovascular events in early stages of chronic kidney disease. Int J Med Sci 2013; 10: 1430-1436.
[7] Oh YS, Kim JS, Park JW, An JY, Park SK, Shim YS, Yang DW and Lee KS. Arterial stiffness
[image:5.612.91.522.84.175.2]and impaired renal function in patients with Table 4. Logistic with change of PWV and change of CKD-EPI
Quartile 2 vs. Quartile 1
(-11.57-(-21.72) vs. ≥ -21.72) (-4.57-(-11.56) vs. ≥ -21.72)Quartile 3 vs. Quartile 1 Quartile 4 vs. Quartile 1 (≤ -4.56 vs. ≥ -21.72)
OR (95% CI) P OR (95% CI) P OR (95% CI) P
Change of cf-PWV
Unadjusted 1.126 (0.823-1.539) 0.459 1.100 (0.941-1.286) 0.231 1.126 (1.013-1.251) 0.028 Model 1 1.109 (0.807-1.523) 0.524 1.136 (0.965-1.338) 0.126 1.004 (1.146-1.308) 0.043 Model 2 1.706 (0.783-3.720) 0.179 1.859 (1.256-2.753) 0.002 1.453 (1.095-1.928) 0.01
Alzheimer’s disease. Neurol Sci 2016; 37: 451-7.
[8] Dhaun N and Webb DJ. Targeting Blood Vessel
Stiffness to Protect Kidney Function. Clin J Am
Soc Nephrol 2015; 10: 2107-2109.
[9] Ohya Y, Iseki K, Iseki C, Miyagi T, Kinjo K and
Takishita S. Increased pulse wave velocity is associated with low creatinine clearance and
proteinuria in a screened cohort. Am J Kidney
Dis 2006; 47: 790-797.
[10] Iannuzzi M, D’Angelillo A, Tortori A, Pazzano D,
De Serio L, Covetti G, Bresciani A and Iannuzzi
A. Carotid artery diameter and wall stiffness in proteinuric renal disease without severely re-duced kidney function. J Clin Ultrasound 2016; 44: 175-81.
[11] Upadhyay A, Hwang SJ, Mitchell GF, Vasan RS, Vita JA, Stantchev PI, Meigs JB, Larson MG,
Levy D, Benjamin EJ and Fox CS. Arterial
stiff-ness in mild-to-moderate CKD. J Am Soc
Nephrol 2009; 20: 2044-2053.
[12] Kim CS, Kim HY, Kang YU, Choi JS, Bae EH, Ma SK and Kim SW. Association of pulse wave ve -locity and pulse pressure with decline in
kid-ney function. J Clin Hypertens (Greenwich)
2014; 16: 372-377.
[13] Madero M, Peralta C, Katz R, Canada R, Fried
L, Najjar S, Shlipak M, Simonsick E, Lakatta E,
Patel K, Rifkin D, Hawkins M, Newman A,
Sarnak M; Health ABC Study. Health ABC Study. Association of arterial rigidity with inci-dent kidney disease and kidney function de-cline: the Health ABC study. Clin J Am Soc Nephrol 2013; 8: 424-433.
[14] Elias MF, Davey A, Dore GA, Gillespie A,
Abhayaratna WP and Robbins MA. Deterioration in renal function is associated with increased arterial stiffness. Am J Hypertens 2014; 27: 207-214.
[15] Bai Y, Ye P, Luo L, Xiao W, Xu R, Wu H and Bai J. Arterial stiffness is associated with minimally elevated high-sensitivity cardiac, troponin T levels in a community-dwelling population. Atherosclerosis 2011; 218: 493-498.
[16] O’Rourke MF, Staessen JA, Vlachopoulos C,
Duprez D and Plante GE. Clinical applications of arterial stiffness; definitions and reference
values. Am J Hypertens 2002; 15: 426-444.
[17] Fischer EC, Zócalo Y, Galli C, Wray S and Bia D.
Arterial Stiffness and Renal Replacement Therapy: A Controversial Topic. Int J Nephrol 2015; 2015: 729609.
[18] Bouchi R, Babazono T, Mugishima M, Yoshida
N, Nyumura I, Toya K, Hanai K, Tanaka N, Ishii
A, Uchigata Y and Iwamoto Y. Arterial stiffness is associated with incident albuminuria and
decreased glomerular filtration rate in type 2
diabetic patients. Diabetes Care 2011; 34: 2570-2575.
[19] Liu IT, Wu JS, Yang YC, Huang YH, Lu FH and Chang CJ. Mild chronic kidney disease associ-ated with greater risk of arterial stiffness in
el-derly adults. J Am Geriatr Soc 2013; 61:
1758-1762.
[20] Moody WE, Edwards NC, Chue CD, Ferro CJ and Townend JN. Arterial disease in chronic kidney disease. Heart 2013; 99: 365-372.
[21] Kerr PG and Guerin AP. Arterial calcification
and stiffness in chronic kidney disease. Clin Exp Pharmacol Physiol 2007; 34: 683-687.
[22] Kawamoto R, Kohara K, Tabara Y, Miki T, Ohtsuka N, Kusunoki T and Yorimitsu N. An as -sociation between decreased estimated
glo-merular filtration rate and arterial stiffness.
Intern Med 2008; 47: 593-598.
[23] Bian SY, Guo HY, Ye P, Luo LM, Wu HM, Xiao WK, Qi LP, Yu HP and Duan LF. Association of glomerular filtration rate with arterial stiffness
in Chinese women with normal to mildly
im-paired renal function. J Geriatr Cardiol 2012;