warwick.ac.uk/lib-publications
Manuscript version: Author’s Accepted Manuscript
The version presented in WRAP is the author’s accepted manuscript and may differ from the
published version or Version of Record.
Persistent WRAP URL:
http://wrap.warwick.ac.uk/129171
How to cite:
Please refer to published version for the most recent bibliographic citation information.
If a published version is known of, the repository item page linked to above, will contain
details on accessing it.
Copyright and reuse:
The Warwick Research Archive Portal (WRAP) makes this work by researchers of the
University of Warwick available open access under the following conditions.
Copyright © and all moral rights to the version of the paper presented here belong to the
individual author(s) and/or other copyright owners. To the extent reasonable and
practicable the material made available in WRAP has been checked for eligibility before
being made available.
Copies of full items can be used for personal research or study, educational, or not-for-profit
purposes without prior permission or charge. Provided that the authors, title and full
bibliographic details are credited, a hyperlink and/or URL is given for the original metadata
page and the content is not changed in any way.
Publisher’s statement:
Please refer to the repository item page, publisher’s statement section, for further
information.
Imperial College Press
† Corresponding author.
ISSUES IN PERFORMANCE EVALUATION FOR HOST-PATHOGEN PROTEIN INTERACTION PREDICTION
WAJID ARSHAD ABBASI AND FAYYAZ UL AMIR AFSAR MINHAS†
Department of Computer and Information Sciences Pakistan Institute of Engineering and Applied Sciences (PIEAS)
Nilore, Islamabad, Pakistan
[email protected]; †[email protected]
Received (Day Month Year) Revised (Day Month Year) Accepted (Day Month Year)
The study of protein-protein interactions (PPIs) between host and pathogen proteins is important for understanding the underlying mechanism of infectious diseases and for developing novel therapeutic solutions. Wet-lab techniques cannot be used for large scale studies of PPIs as such methods are expensive and time consuming. Machine learning is one of the computational approaches that can be used to assist biologists by predicting promising PPIs. A number of machine learning based methods for predicting host-pathogen interactions (HPIs) have been proposed in the literature. The techniques used for assessing the accuracy of such predictors are of critical importance in this domain. Most methods use K-fold cross validation for this purpose. In this paper, we question the effectiveness of
K-fold cross validation for estimating the generalization performance of a HPIs predictor. K-fold cross validation does not prevent redundancy in training and test data especially in case of host-pathogen PPIs where a pair is involved as training example. We hypothesized that this redundancy in training and test data overestimates the generalization power of the predictors. We have successfully tested this hypothesis through simulation over a case study of HIV and Human proteins. We also propose an alternative evaluation scheme called Leave One Pathogen Protein out (LOPO) cross-validation which is more effective in modeling the real world use of such predictors, specifically for cases in which no information about the interacting partners of a pathogen protein is available during training. We also point out that currently used metrics such as areas under the precision-recall or receiver operating characteristic curves are not intuitive to a biologist in experimental design and propose simpler and more directly interpretable metrics for this purpose.
Keywords: performance evaluation; host-pathogen interactions; protein-protein interactions; machine learning; cross validation.
1. Introduction
Invasion of a host organism by pathogens like viruses or bacteria, their duplication, and the reactions of host and toxins produced is known as infection.1 According to the World
Health Organization (WHO), infectious diseases, such as Tuberculosis, Hepatitis, AIDS, and Typhoid etc., are among the major causes of deaths in the world. It is estimated that infections are involved in approximately 20% of all deaths across the globe.2 Infections
occur through interactions between proteins of the host and the pathogens.3 Therefore, to
understand the underlying mechanism of infectious diseases, it is crucial to gain an insight in host-pathogen protein-protein interactions (PPIs).4
Experimental methods for studying PPIs are often time-consuming and expensive, making it difficult to investigate all possible host-pathogen interactions (HPIs). For instance, the bacterium B. anthracis has 2,321 proteins,5 which when paired with the 80,000
or so human proteins6 gives more than a billion protein pairs to test experimentally. It is
not practically feasible to test all possible interactions experimentally. Therefore, there is an utmost need for computational approaches to support wet-lab methods by predicting promising PPIs. Such computational approaches can assist biologists to focus on fewer interactions and ruling out the vast majority of improbable ones.7
Among computational approaches, application of machine learning techniques to bioinformatics for PPI predictions is a well-accepted idea.5,7–10 In such methods, a pair of
proteins, one each from the host and the pathogen, is considered as a learning example. In machine learning based HPI predictors, experimentally discovered interactions are used as positive examples in training.7 Negative or non-interacting examples are usually generated
by pairing host-pathogen proteins randomly11 or using one-class SVM.1 To produce good
classifiers, a considerable number of interacting and non-interacting pairs are typically needed.
Predictive features are derived for each example using various attributes of the two proteins such as k-mer counts of protein sequences,13,14 protein domain information,3 gene
expression,5 gene ontology (GO),5, 10 network characteristics,5, 9 etc. A general framework of
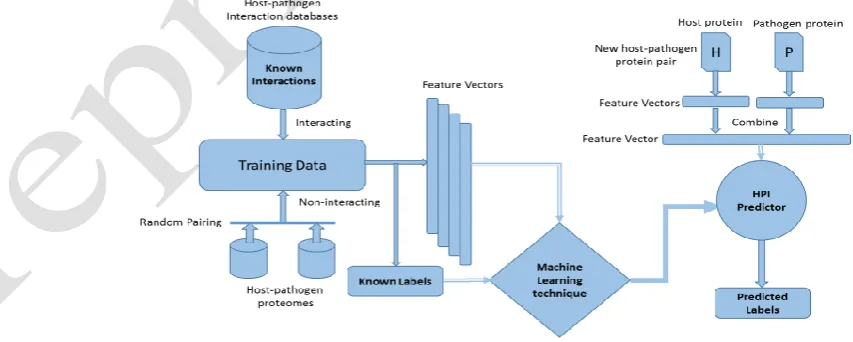
machine learning techniques in host-pathogen PPIs prediction is shown in Fig. 1. This framework shows how the classifier is trained on training data and consequently used to predict the label of a novel example.
[image:3.595.51.478.491.662.2]With the growth in proteome data of different organisms, there is a pressing need for accurate HPI predictors. A number of such predictors exist in the literature.5,9,10,15–18
However, our primary focus in this paper is the evaluation of accuracy of these predictors. In every machine learning setting, it is important to consider the nature of the problem, available data and intended use of the system while designing the classifier, its evaluation protocols and performance metrics.19–21 However, in comparison to other application areas,
this requirement is very stringent in bioinformatics because of its role as a tool for biological discovery and is implications on advancement of science. Specifically, in the domain of host pathogen interaction prediction, it is important to be cognizant of the underlying biological implications in designing the machine learning system and its evaluation protocol to assess the generalization performance of the predictor in practical use.
Most existing HPIs predictors use a very simple K-fold cross-validation (CV) scheme for performance evaluation.22 In K-fold cross-validation, the original dataset is randomly
partitioned into K equal sized subsets. Of the K subsets, K-1 sets are used as training and the remaining data is used for testing. This process is repeated K times to compute K performance measures which are then combined to produce a single accuracy metric.22 This
approach works very well in a general machine learning setting. However, for HPI prediction a more elaborate analysis is required. This is because simple K-fold cross validation does not take the biological nature of the problem into account. It does not prevent similarity or redundancy between training and testing examples and can lead to inflated accuracy values. Typically, a biologist is interested in finding interactions between proteins which may be very dissimilar in their sequence from the proteins used in training. However, in simple K-fold cross validation, close sequence homologs of a test protein pair can appear in training. This issue is further complicated by the fact that in HPI prediction, the classification example is a pair of proteins and in simple K-fold cross validation a protein in a test pair can also occur as part of some training examples. We hypothesize that this produces a disparity between the evaluated accuracy of the classifier and its true generalization performance.
This study is designed to test this hypothesis rigorously by carefully performing an experiment related to training and evaluation of HPIs predictors. We have also proposed a protein specific cross validation scheme specifically tuned for HPI predictors.
In this paper, we also point out another issue in the evaluation of HPI predictors. Accuracy measures, such as area under the precision-recall curve (AUC-PR),23 area under
receiver operating characteristic curve (AUC-ROC),23 accuracy and F1 score,5 are typically
used in the area of machine learning and for presenting the results for an HPI predictor. However, these measures, though important in machine learning analysis, are not intuitive to a biologist.24 Therefore, we proposed three new domain specific metrics in this paper
called true hit ratio (THR), false hit ratio (FHR) and median rank of the first positive prediction (MRFPP).
2. Methods
2.1. Dataset and preprocessing
We collected a representative dataset of 632 unique PPIs of human–HIV (isolate HXB2 group M subtype B) from NCBI.25 These interactions are considered as positive examples
in the evaluation process. This interaction set includes 513 human and 17 HIV proteins. The proteins in the interaction set are non-redundant with less than 80% sequence identity between them. We generated negative examples by randomly pairing these 513 human and 17 HIV proteins in such a way that no randomly generated protein pair was already in our positive set.11 The total number of negative examples thus obtained is 8, 089. It must be
noted here that we purposefully did not take the whole human proteome in consideration as it would have complicated our evaluation without affecting the outcome.
2.2. Support Vector Machines for HPIs prediction
In this work we have used a support vector machine classifier to illustrate the impact of different cross-validation schemes on generalization performance. This choice is motivated by the use of SVMs in a variety of HPI predictors as well as in other applications of machine learning in bioinformatics.9,18,24,26,27 We expect that our observations can be
replicated in principle using any other classification scheme.
In HPIs prediction, our dataset 𝑆 consists of examples (𝒙𝑖, 𝑦𝑖) ∈ 𝑆. Here, 𝒙𝑖 is a feature
vector for the 𝑖th example involving human protein ℎ
𝑖 and pathogen protein 𝑝𝑖 to form the
pair (ℎ𝑖, 𝑝𝑖). 𝑦𝑖∈ {+1, −1} is the corresponding label for this example. Based on this
notation, we can describe a HPI predictor as the SVM optimization problem given below:
𝑚𝑖𝑛𝒘,𝑏,𝝃
1
2𝒘
𝑇𝒘 + 𝐶 ∑ ξ
𝑖 |𝑆|
𝑖=1
(1)
Subject to 𝑦𝑖(𝒘𝑇𝒙𝑖+ 𝑏) ≥ 1 − 𝜉𝑖, 𝜉𝑖≥ 0, ∀𝑖
Here, 1
2𝒘
𝑇𝒘 is the margin maximization term, 𝜉
𝑖 is the extent of margin violation for
a given example and 𝐶 is the penalty of such violations.28 The discriminant function
𝑓(𝒙𝒊) = 𝒘𝑇𝒙𝒊+ 𝑏 discriminates interacting and non-interacting pairs by assigning a score
to the given feature vector.
2.3. Feature extraction
We used protein sequence k-mer composition as features in this study. In line with the method of Dyer et al.,9 these features are extracted by grouping the twenty naturally
occurring amino acids into seven groups on the basis of their hydrophobic and electrostatic properties.22 We used the counts of occurrences of k-mer of these groups in the protein
sequence as features with value of k ranging from 2 to 4. In this way, each protein is represented in the form of feature vector of length 7𝑘, i.e., 49, 343, and 2401 for 𝑘 = 2, 3, 4,
2.4. Model evaluation
To test the proposed hypothesis, we used 17-fold cross validation as our baseline. Here the reason to use 17-fold cross validation is to keep performance results comparable with our proposed evaluation protocol which involves hold out cross validation of 17 pathogen proteins. We compare the results of 17-fold cross validation with our proposed cross-validation strategy which prevents redundancy or overlap between training and testing data. Details of both techniques are given below.
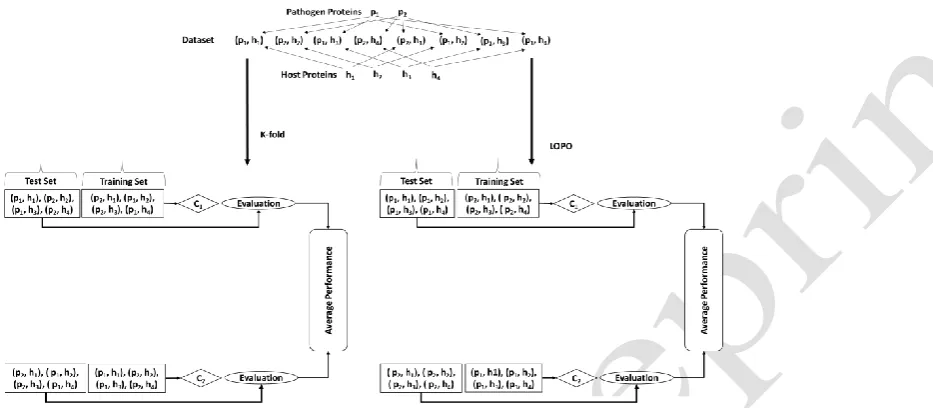
In 17-fold cross validation, we divided the whole dataset into 17 folds. Then we used repeatedly one fold for testing and other sixteen for training the model as shown in Fig. 2. Redundancy in training and test data can be seen in Fig. 2 with respect to both host and pathogen proteins.
We have also proposed another evaluation methodology for HPIs predictors called leave one pathogen protein out (LOPO) cross validation. In LOPO cross validation, we used protein pairs of one pathogen protein in testing while all the remaining pairs for training as depicted in Fig. 2. In this case where we have 17 virus proteins, we get 17 measures of each metric to average. As all the protein pairs belonging to a specific pathogen protein were taken out for testing, therefore this pathogen protein does not participate in
Fig. 2. Evaluation methodologies for host-pathogen protein interactions (HPIs) predictors. In K-fold cross
validation, we have separated our data into as many folds as the number of pathogen proteins. Then, one fold is
taken for testing and all other folds are used for training. Redundancy with respect to both host and pathogen
proteins can be seen. For example, proteins 𝒑𝟏and 𝒉𝟏 occur in both training and test sets in each fold. In leave
one pathogen protein out (LOPO) cross validation, protein pairs with respect to one pathogen protein involved
in interactions are taken out for testing and remaining pairs are used for training. Number of folds in this case
will be equal to the number of pathogen proteins involved in interactions. Redundancy with respect to pathogen
[image:6.595.115.582.387.591.2]training. In this way, any overlap of the same pathogen protein pairs in training and testing is avoided.
2.5. Performance metrics
We used the following metrics to evaluate and compare the performance of the trained models based on their usage in most of the studies involving host-pathogen PPIs prediction. These metrics are widely used in the evaluation of numerous HPI predictors.
2.5.1. Area under the ROC curve (AUC-ROC)
The area under Receiver Operating Characteristic (AUC-ROC) curve was obtained by plotting the false and true positive rates.23 An ideal predictor will score an
AUC-ROC of 1, while random guessing will score around 0.5.
2.5.2. Area under the precision-recall curve (AUC-PR)
The scores produced by the predictor and the known labels for each example were used to plot precision-recall curve.23 The area, expressed as a percentage, under the
precision-recall curve (AUC-PR), has been used as the performance metric. Unlike AUC-ROC, this metric is sensitive to false positives.
In this work, we propose the use of the following metrics for host-pathogen PPIs predictors. We are of the opinion that these metrics provide the biologist with a more intuitive understanding in the interpretation of results of HPI predictors in comparison to AUC-ROC and AUC-PR for use in designing lab experiments to screen or test potential interactions. These metrics have previously been used in our work on identifying interfaces and binding sites in proteins.23, 25
2.5.3. True Hit Ratio (THR)
When testing the examples involving a held out pathogen protein in LOPO cross validation, we define a true hit to occur when the highest scoring example, amongst all the given examples, is a true positive. The percentage of true hits across all interacting pathogen proteins is called true hit ratio. For an ideal classifier, 𝑇𝐻 = 100%. Intuitively, the THR tells a biologist how often the top scoring example involving a pathogen protein can be expected to be a true positive.
2.5.4. False Hit Ratio (FHR)
2.5.5. Median Rank of the first positive prediction (MRFPP)
This metric gives an intuitive idea of the distribution of false negatives in comparison to the top scoring true positive in evaluation. This metric can be defined as 𝑀𝑅𝐹𝑃𝑃 = 𝑞, if at least 50% of pathogen proteins in LOPO cross validation have at least one true positive among their𝑞 top scoring examples. An ideal predictor should have
𝑀𝑅𝐹𝑃𝑃 = 1, i.e., for at least 50% pathogen proteins, the top scoring prediction by the
predictor is a true positive.26 In comparison to AUC-PR, this measure is more intuitive
to biologist as it reveals directly how often the top scoring predictions can be expected to be a an interacting pair.
2.6. Model selection
Value of 𝐶 parameter in SVM has been varied from 2−5 to 217. Scores are computed at a
coarsely optimized value of 𝐶.
3. Results
3.1. Analysis of evaluation methodologies
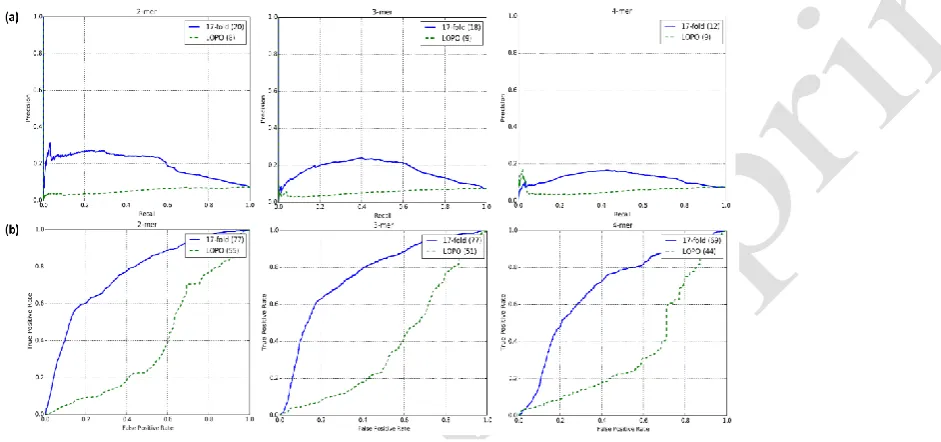
[image:8.595.107.578.437.658.2]The average values of area under the precision-recall (AUC-PR) and ROC (AUC-ROC) curves for 2-mer, 3-mer and 4-mer feature vectors for 17-fold and LOPO cross validation are shown in Fig. 3. With 17 fold cross validation, we obtained AUC-PR scores of 20%,
Fig. 3. Precision-recall (top, a) and receiver operating characteristic (ROC) (bottom, b) graphs of 17-fold
18% and 12% with 2,3 and 4-mer feature vectors, respectively. The corresponding values for AUC-ROC are 77%, 77% and 69%.
With LOPO cross validation, we noticed a consistent decrease in AUC-PR scores in comparison to those from 17-fold cross validation as shown in Fig. 3(a). We can see a similar drastic decrease in the evaluated AUC-ROC scores as well. We discuss the conclusions from these results in the section 4.
3.2. Metrics for HPIs predictors
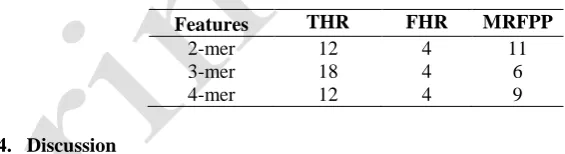
We have also computed true hit ratio (THR), false hit ratio (FHR) and median rank of the first positive prediction (MRFPP) against each pathogen protein using LOPO cross validation as shown in Table 1. THR of ~18% indicates that the top scoring example involving a held out pathogen protein is a true positive for ~18% of pathogen proteins. A FHR of ~4% means that, on average, ~4% false positives rank higher than the top scoring true positive for any pathogen protein. Similarly, MRFPP of 6 reveals that for 50% of the test proteins, a true positive occurs within the top 6 predictions.
[image:9.595.119.402.430.507.2]Here, in this study these metrics are not used as performance measures to compare predictive power of the classifiers but to give an idea that how these measures can be computed and further used instinctively. We have not attempted to optimize these performance metrics.
Table 1. Proposed metrics computed using LOPO cross validation
Features THR FHR MRFPP
2-mer 12 4 11
3-mer 18 4 6
4-mer 12 4 9
4. Discussion
The results presented in previous section lend support to our hypothesis that redundancy between training and testing data of the predictor as consequence of K-fold cross validation can lead to inflated accuracy values. The predictor which was behaving quite well in 17-fold cross validation setting is behaving no better than a random classifier in LOPO cross validation setting. This is just because of controlling ~50% redundancy at pathogen protein level during training and testing.
K-fold cross validation is completely ineffective to control redundancy in training and test data for host-pathogen PPIs predictor. In K-fold cross validation, there is an underlying assumption that interactions of both host and pathogen proteins involved in test pair are known during training as pointed out by Hamp and Rost.29 This assumption is not practical
in most interaction studies. The predictor optimized on the basis of this assumption will perform poorly while predicting the interaction of a novel host-pathogen protein pair.
we used it at pathogen protein level because there are less pathogen proteins involved in the interactions compared to host proteins. The results through LOPO cross validation show a significant reduction in the performance of our trained predictors in comparison to K-fold cross validation. Optimized predictors through this evaluation scheme can be expected to have higher generalization compared to K-fold cross validation.
We used linear SVM and a simple feature representation in this study to test our hypothesis. However, this idea can be extended to any model formulated specifically for host-pathogen PPIs prediction and to any complex feature representation. As the problem of redundancy in train and test data will remain there due to involvement of protein pair as learning example.
Most of the existing studies in literature involving host-pathogen PPIs predictions used K-fold cross validation as evaluation scheme. Therefore, results from existing techniques may be misleading and should be considered with a grain of salt.
5. Conclusions
We investigated the effect of evaluation methodologies on the performance of the predictors built for host-pathogen protein-protein interactions (PPIs) prediction. Through a carefully designed experiment, we showed that the results of K-fold cross validation, which is typically employed for performance evaluation of such predictors, are overestimates of the generalization performance. We strongly advocate the use of leave one protein out evaluation for this purpose.
Acknowledgments
Authors are thankful to Mr. Naveed Akhtar, PhD Scholar, for his technical support. Wajid A. Abbasi is supported by a grant from Higher Education Commission (HEC) of Pakistan.
References
1. Health NI, Study BSC, Understanding Emerging and Re-emerging Infectious Diseases, 2007. 2. Organization WH, The Global Burden of Disease: 2004 Update, (World Health Organization),
2008.
3. Dyer MD, Murali TM, Sobral BW, Computational prediction of host-pathogen protein–protein interactions, Bioinformatics23:i159–i166, 2007.
4. Dyer MD, Murali TM, Sobral BW, The Landscape of Human Proteins Interacting with Viruses and Other Pathogens, PLoS Pathog4:e32, 2008.
5. Kshirsagar M, Carbonell J, Klein-Seetharaman J, Multitask learning for host–pathogen protein interactions, Bioinformatics29:i217–i226, 2013.
6. Chandramouli K, Qian PY, Proteomics: Challenges, Techniques and Possibilities to Overcome Biological Sample Complexity, Hum Genomics Proteomics1: 239204, 2009.
7. Nourani E, Khunjush F, Durmuş S, Computational approaches for prediction of pathogen-host protein-protein interactions, Infect Dis6:94, 2015.
8. Bock JR, Gough DA, Predicting protein--protein interactions from primary structure,
9. Dyer MD, Murali TM Sobral BW, Supervised learning and prediction of physical interactions between human and HIV proteins, Infect Genet Evol11:917–923, 2011.
10. Tastan O, Qi Y, Carbonell JG, Klein-Seetharaman J, Prediction of interactions between HIV-1 and human proteins by information integration, Pac Symp Biocomput ,516–527, 2009. 11. Ben-Hur A, Noble WS, Choosing negative examples for the prediction of protein-protein
interactions, BMC Bioinformatics7:S2, 2006.
12. Mei S, Zhu H, A novel one-class SVM based negative data sampling method for reconstructing proteome-wide HTLV-human protein interaction networks, Sci Rep5:8034, 2015.
13. Shen J, Zhang J, Luo X, Zhu W, Yu K, Chen K, Li Y, Jiang H, Predicting protein-protein interactions based only on sequences information, Proc Natl Acad Sci USA104:4337–4341, 2007.
14. Cui G, Fang C, Han K, Prediction of protein-protein interactions between viruses and human by an SVM model, BMC Bioinformatics13:1–10, 2012.
15. Barman RK, Saha S, Das S, Prediction of Interactions between Viral and Host Proteins Using Supervised Machine Learning Methods, PLoS ONE9:e112034, 2014.
16. Qi Y, Tastan O, Carbonell JG, Klein-Seetharaman J, Weston J, Semi-supervised multi-task learning for predicting interactions between HIV-1 and human proteins, Bioinformatics
26:i645–i652, 2010.
17. Zhou H, Jin J, Wong L, Progress in computational studies of host–pathogen interactions, J Bioinform Comput Biol11:1230001, 2012.
18. Emamjomeh A, Goliaei B, Zahiri J, Ebrahimpour R, Predicting protein–protein interactions between human and hepatitis C virus via an ensemble learning method, Mol Biosyst10:3147– 3154, 2014.
19. Park Y, Critical assessment of sequence-based protein-protein interaction prediction methods that do not require homologous protein sequences, BMC Bioinformatics10:419, 2009. 20. Halevy A, Norvig P, Pereira F, The Unreasonable Effectiveness of Data, IEEE Intelligent
Systems24:8–12, 2009.
21. Wagstaff K, Machine Learning that Matters, In 29th International Conference on Machine
Learning (California Institute of Technology), 2012.
22. McLachlan G, Do KA, Ambroise C, Analyzing Microarray Gene Expression Data. (Wiley), 2004.
23. Davis J, Goadrich M, The Relationship Between Precision-Recall and ROC Curves, In
Proceedings of the 23rd International Conference on Machine Learning, 233–240 (ACM),
2006.
24. Minhas FAA, Ben-Hur A, Multiple instance learning of Calmodulin binding sites.
Bioinformatics28:i416–i422, 2012.
25. Ako-Adjei D, William FU, Craig Wallin C, Katz KS, Song G, Darji D, Brister JR, G R, Pruitt PKD, HIV-1, human interaction database: current status and new features. Nucleic Acids Res
43:D566–D570, 2015.
27. Ben-Hur A, Ong CS, Sonnenburg S, Schölkopf B Rätsch G, Support Vector Machines and Kernels for Computational Biology, PLoS Comput Biol4:e1000173, 2008.
28. Cortes C, Vapnik V, Support-Vector Networks, Mach Learn20:273–297, 1995.
29. Hamp T, Rost B, More challenges for machine-learning protein interactions, Bioinformtics