http://wrap.warwick.ac.uk
Original citation:
Lamley, Jonathan M., Öster, Carl, Stevens, Rebecca A. and Lewandowski, Józef R..
(2015) Intermolecular interactions and protein dynamics by solid-state NMR
spectroscopy. Angewandte Chemie International Edition.
Permanent WRAP url:
http://wrap.warwick.ac.uk/73941
Copyright and reuse:
The Warwick Research Archive Portal (WRAP) makes this work of researchers of the
University of Warwick available open access under the following conditions.
This article is made available under the Creative Commons Attribution 4.0 International
license (CC BY 4.0) and may be reused according to the conditions of the license. For
more details see:
http://creativecommons.org/licenses/by/4.0/
A note on versions:
The version presented in WRAP is the published version, or, version of record, and may
be cited as it appears here.
German Edition: DOI: 10.1002/ange.201509168
Solid-State NMR Spectroscopy
Very Important Paper
International Edition: DOI: 10.1002/anie.201509168Intermolecular Interactions and Protein Dynamics by Solid-State NMR
Spectroscopy
Jonathan M. Lamley, Carl ster, Rebecca A. Stevens, and Jzef R. Lewandowski*
Abstract:Understanding the dynamics of interacting proteins is a crucial step toward describing many biophysical processes. Here we investigate the backbone dynamics for protein GB1 in two different assemblies: crystalline GB1 and the precipitated GB1–antibody complex with a molecular weight of more than 300 kDa. We perform these measurements on samples con-taining as little as eight nanomoles of GB1. From measure-ments of site-specific15N relaxation rates including relaxation
dispersion we obtain snapshots of dynamics spanning nine orders of magnitude in terms of the time scale. A comparison of measurements for GB1 in either environment reveals that while many of the dynamic features of the protein are conserved between them (in particular for the fast picosecond–nano-second motions), much greater differences occur for slow motions with motions in the >500 ns range being more prevalent in the complex. The data suggest that GB1 can potentially undergo a small-amplitude overall anisotropic motion sampling the interaction interface in the complex.
P
rotein dynamics are fundamental to a wide range of biophysical processes, from enzymatic catalysis and ligand binding to molecular recognition and signaling.[1]Often, themechanisms that underlie these processes rely on the interactions of proteins with other molecules. Thus, character-ization of the dynamics of interacting proteins and the manner in which intermolecular interactions influence those dynamics is required to fully understand them. In general, the local molecular environment of a protein potentially has significant effects upon motions relevant to its function.[2]
NMR spectroscopy offers access to atomic-resolution details of the dynamics over a wide range of time scales.[3]
Unfortunately, proteins and protein complexes above a few tens of kDa represent a severe challenge for solution NMR methods, where slow molecular tumbling leads to enhanced transverse relaxation rates and hence broad NMR lines. In solid-state NMR (SSNMR) experiments, however, this size-dependent broadening does not occur and so biomolecules of several hundred kilodaltons and beyond may be studied,
provided intrinsic challenges of sensitivity and resolution can be successfully addressed.[4]
We recently demonstrated that high-quality spectra could be obtained for a protein in a precipitated large protein complex, by using an approach based on a combination of high field, fast (60–100 kHz) magic-angle spinning (MAS), and optional sample deuteration.[4d] Notably, this
method-ology is applicable to a general case of systems with little or no overall symmetry, and samples containing only a few nanomoles of protein can yield spectra with a sensitivity and resolution suitable for performing quantitative measurements of structure and dynamics.[4d,g] We take advantage of the
described approach to, for the first time, use SSNMR spectroscopy to conduct widespread site-specific relaxation measurements that shed light on motions for a protein GB1 in a large (with a molecular weight of more than 300 kDa) protein–antibody complex. We compare these data to anal-ogous data for GB1 in a crystal, where the pattern of intermolecular interactions is different than in the complex. Since the backbone conformation of GB1 is very similar in either form[4d, 5] we expect these to be ideal systems for
investigating the influence of different intermolecular inter-actions and packing on molecular dynamics. In our compar-ison we take advantage of the fact that relaxation rates in the solid state are sensitive to motions spanning nine orders of magnitude in terms of time scale (this enhanced range of sensitivity compared to the solution case is related to the lack of overall tumbling). Relaxation rates relate directly to the time scales and amplitudes of motions, and thus observed changes in relaxation rates measured under identical exper-imental conditions will necessarily reflect changes in the underlying protein dynamics (time scales, amplitudes or both). To ensure a direct comparison, relaxation rates were measured at the same magnetic field (850 MHz 1H Larmor
frequency), spinning frequency (60 kHz), and sample temper-ature (2718C) in the two different assemblies: a GB1 (ca. 6 kDa) crystal and precipitated complex of GB1 and immu-noglobin G (IgG; ca. 150 kDa) where GB1 binds to both the Fab and Fc fragments of the IgG antibody in a complex with a molecular weight of more than 300 kDa.[4d, 7]Note that the
GB1:IgG complex precipitates instantaneously upon mixing of the GB1 and IgG solutions and without application of any centrifugal force (i.e. it is not sedimented). We used 100 % back-exchanged [U-2H,13C,15N]GB1 for the preparation of
both samples with proteins dissolved in pH 5.5 phosphate buffer. All samples were fully hydrated with bulk solvent being present in the rotors. The amount of GB1 was estimated to be about 8 nanomoles and 310 nanomoles in the samples of the complex and crystal, respectively.
[*] J. M. Lamley, C. ster, R. A. Stevens, Dr. J. R. Lewandowski Department of Chemistry, University of Warwick
Gibbet Hill Road, Coventry CV4 7AL (UK) E-mail: [email protected]
Supporting information and ORCID(s) from the author(s) for this article are available on the WWW under http://dx.doi.org/10.1002/ anie.201509168.
2015 The Authors. Published by Wiley-VCH Verlag GmbH&Co.
In contrast to in solution, in the solid state the absence of overall tumbling enables access to motions in the full range from picoseconds to milliseconds through NMR relaxation measurements.[3c]To obtain snapshots of dynamics at
differ-ent time scales we performed three types of site-specific measurements dominated by motions on different time scales: 15N R
1, R11, and R11relaxation dispersion. At 20 T,
15NR
1is dominated by nanosecond-range motions.[6] 15NR11is
sensitive to picoseconds–millisecond motions but is domi-nated by the motions with longer correlation times.[6, 8]When
the time scales of motions approach the range that is associated with spinning (i.e. microsecond–millisecond motions), the incoherent (molecular motion) and coherent (spinning) processes interfere with each other, introducing an R11 spinning frequency dependence.[9] Finally, exchange
contributions to15NR
11can be evaluated from the relaxation
dispersion, which reports on motions in the microsecond range.[10]
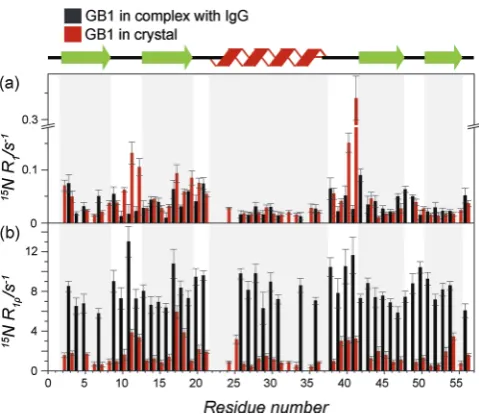
Figure 1 a shows15NR
1rates measured for GB1 in both
environments as a function of the residue number (GB1:IgG
complex in black and GB1 crystal in red). TheR1rates are
similar between crystal and complex with a few notable localized differences, for example, residues K10–K13 and D40–G41, which are elevated in the crystal compared to the complex. These differences could be explained by different intermolecular contacts:[11]the loop residues are involved in
specific interactions with IgG in the complex[4d] but have
a large solvent accessible surface and some of the largest amplitude motions in the crystal.[6]Consequently, overall the
fast picosecond–nanosecond motions seem largely similar in
GB1 in the two different molecular assemblies, which is consistent with the general observation that a crystalline environment does not induce large changes in fast pico-second–nanosecond dynamics compared to a free molecule in solution (unless a strong direct contact is present)[11, 12]or the
interpretation that picosecond–nanosecond dynamics are primarily defined by the fold of a protein.
Figure 1 b shows15NR
11rates measured for GB1 in both
environments as a function of the residue number (complex rates in black, crystal rates in red). Remarkably, the rates for GB1 in the complex are, on average (at the same temper-ature), about 6 times higher than those in the crystal (mean R11values of 8.1 s 1and 1.4 s 1, respectively). The similarity of
the 15NR
1 values in the complex and crystal suggests that
these differences in R11rates must originate primarily from
differences in motions occurring on a high-nanosecond-to-millisecond time scale, which have a minimal effect on R1.
Besides the general offset in the15NR
11rates for GB1 in
the crystal and complex, we observe changes in their relative magnitudes as a function of the residue number.15NR
11rates
are generally elevated in the loops and at the ends ofb-strands both in the crystal and complex. However, in the crystal, the rates for the helix residues are generally similar or smaller compared to the rates in theb-sheet but they are elevated in the complex.
Assuming that the basic interaction interfaces between GB1 and IgG are well represented by the interfaces observed in crystal structures of GB1 analogs in complexes with IgG fragments,[4d]one can compare the local density of packing for
GB1 in the crystal and complex. For the portions of GB1 involved in interactions with IgG, the buried surface area for the solvent accessible surface is larger in the complex compared to that in the crystal (see Figure S7 in the Supporting Information). The increased 15N R
11 rates
observed in the complex are therefore more likely to be due to generally longer correlation times rather than larger amplitudes of motions (i.e. due to denser packing in the complex, the amplitudes of motions are unlikely to be greater than in the crystal). Since in GB1 crystals the average correlation time for the slow motions at this temperature is about 450 ns,[6]the average correlation time for the dominant
slow motions in the complex must be greater than 500 ns. Since the15NR
11rates are elevated for all the residues in
the complex compared to the crystal, this means that either local slow motions are induced in most residues upon binding with IgG (these also might be motions that are present in the crystal but become slower in complex) and/or GB1 undergoes a small-amplitude overall slow motion in the complex. In the first scenario, local conformational changes occurring on a slow time scale are likely to modulate an isotropic chemical shift and thus be observable by chemical exchange-based methods such as 15N R
11 relaxation dispersion.[10, 13] In the
[image:3.595.51.291.303.510.2]second scenario, motion may not modulate isotropic chemical shift if it is not associated with a local conformational change, and thus may not be picked up by the relaxation dispersion measurements. However, such motions in the microsecond– millisecond range should induce a spinning frequency dependence ofR11.[9]
Figure 1. a)15
NR1and b)R11relaxation rate measurements in 100 %
proton back-exchanged [U-2
H,13
C,15
N]GB1 in a complex with IgG (black) and in a GB1 crystal (red). For the severely overlapping peaks values were removed (see Figures S2–3). Experiments were performed at an 850 MHz spectrometer, 60 kHz spinning frequency, and with a 17 kHz spin-lock field for measurements in (b). The sample
temper-ature was 2718C as calculated from the chemical shift of water
protons.
2
www.angewandte.org 2015 The Authors. Published by Wiley-VCH Verlag GmbH & Co. KGaA, Weinheim Angew. Chem. Int. Ed.2015,54, 1 – 6In order to distinguish motion-induced effects from motion-independent dipolar dephasing, currently, 15N R
11
relaxation dispersion and spinning-dependent measurements need to be conducted in heavily deuterated samples pref-erably at spinning frequencies of greater than 40 kHz.[8b, 10]
First, we measured the relaxation dispersion for 100 % back-exchanged deuterated crystalline GB1 (at 50–60 kHz MAS apparently no further dilution of proton network is required, with coherent contributions being smaller than 1 s 1
at lower spin-lock fields). Clear dispersion is observed for only a handful of residues in crystalline GB1 (see Figure S5 ), which must undergo local microsecond-range motions (more precisely motions on a time scale of tens to hundreds of microseconds). In general, residues with microsecond-range motions cluster in two regions: the C-terminal end of b3,
loop 4 and the N-terminal end ofb4(residues 44, 46, 48–53)
and the C-terminal end ofb2and loop 2 (residues 17, 19–20;
see Figure 2). In the complex, the presence of microsecond-range motions (though not the precise rate of exchange) can be evaluated by comparing 15N R
11 measurements at two
different spin-lock values. In the presence of microsecond-range motions, the contribution from chemical exchange should render the measured rate of decay larger at the lower spin-lock frequencies. For many of the GB1 residues, rates measured using a 2.5 kHz spin-lock field are considerably elevated compared to those measured using a 17 kHz spin-lock field, which indicates that local microsecond-range motions are much more common in the complex compared to those in the crystal. Generally, the regions displaying conformational exchange on the microsecond time scale in the crystal show similar behavior in the complex (though with a few differences). Other residues, for example, the C-terminal end of the helix andb1strand (see Figure 2) exhibit
the presence of microsecond-range motions only in the complex. However, many residues that have elevated 15N
R11rates in the complex compared to those in the crystal do
not contain significant contributions from chemical exchange in the microsecond range (at least not above the current experimental errors). Such residues either undergo motions that are outside of the sensitivity range for the 15N R
11
relaxation dispersion (e.g. in millisecond or <10ms range) or undergo motions that do not modulate isotropic chemical shift and thus do not contribute to the rates through chemical exchange. In either case, such motions with correlation times greater than 1ms should display spinning frequency-depen-dent15NR
11rates.[9]
Figure 3 a shows a comparison of15NR
11rates measured
at 60, 52, and 45 kHz spinning frequencies. Overall, the rates at 45 kHz spinning are on average about 8 s 1larger than at
60 kHz spinning, indicating the presence of slow (micro-second–millisecond) motions for essentially all the residues (in contrast, in the crystal most rates are either the same within the experimental error or different by less than 0.5 s 1
under similar conditions, see Figure S8). A pertinent question is whether the omnipresence of slow motions may be a manifestation of an overall small amplitude motion.[14]
Cases in which a protein samples different orientations in a transient complex were reported previously.[15]Depending
on the nature of the overall motion it would contribute
differently to the observed rates: isotropic motion would result in an equal contribution to all the rates; anisotropic motion would induce contributions to the rates that depend on the orientation of the NH bond vector with respect to the axis of motion.[3c, 14, 16] Figure S4 illustrates this idea by
showing the simulated effect on the15NR
11rates in GB1 in
different cases of overall 3D Gaussian axial fluctuations (GAF)[3c, 14, 16] of the molecule. We use the same model (see
the Supporting Information) to fit the experimental15NR 11
values obtained at three spinning frequencies to get an idea of the type of overall motion that would be compatible with them. In such a procedure one can safely neglect any contributions from fast picosecond–nanosecond motions because they contribute only to a small fraction of the observed rates and are spinning-frequency-independent.[6]
[image:4.595.320.526.59.448.2]have been forced to neglect at this stage contributions of slow local motions (e.g. some of the motions picked up by the relaxation dispersion). The model involves six fit parameters: three amplitudes of fluctuations against three orthogonal axes, a single time scale for the overall motion, and the two parameters describing the orientation of the motional refer-ence frame in which the coordinates for all NH vectors are expressed. The overall motion that leads to the best repro-duction of data (see Figure 3 c) is essentially axially
symmet-ric, with the largest fluctuation of about 78against the blue and green axes in Figure 3 b and 48against the red axis and a correlation time of 80ms. Note that for such slow motions, contributions to the rates from non-directly bonded to nitrogen protons (including IgG protons) may be non-negligible. In the Supporting Information we consider how including such contributions would affect the above analysis. Proper quantification of the amplitudes and time scales of motions for GB1 in the complex will require further extensive measurements and a far more involved analysis (our results suggest that motions occurring at even four distinct timescales may need to be considered to model adequately the dynamics for some residues). However, even without this information it is clear that changes to protein dynamics associated with differences in intermolecular interactions are potentially very complex, that studies of protein dynamics in actual assemblies provide additional insights not available from studies on isolated systems and that information about the dynamics of proteins in large complexes may be now accessed directly through approaches similar to the one proposed here.
In summary, we have presented a comparison of site-specific backbone dynamics spanning over nine orders of magnitude in time scale for the protein GB1 in two different environments: a crystalline form and the precipitated GB1:IgG complex with a molecular weight of more than 300 kDa. Comparison of site-specific 15N R
1 measurements
under the same experimental conditions highlighted general similarities of fast picosecond–nanosecond dynamics in both environments only minimally perturbed by strong intermo-lecular contacts. Comparison of site-specific15NR
11
measure-ments including relaxation dispersion and spinning fre-quency-dependent measurements suggested that different intermolecular interactions modify the pattern of slow motions, with slow microsecond–millisecond motions being more prevalent in the complex. The generally elevated15NR
11
rates throughout GB1 in the complex compared to those in the crystal are consistent with an overall small amplitude anisotropic orientation sampling of the interaction interface of the protein. This study paves the way for direct character-ization of dynamics in biologically important but sensitivity-limited samples of proteins within large complexes that will supplement the picture from studies of isolated proteins.
Acknowledgements
[image:5.595.51.289.56.504.2]The research leading to these results has received funding from the European Research Council under the European Union’s Seventh Framework Programme (FP/2007-2013)/ ERC Grant Agreement 639907. J.R.L. also acknowledges funding from Royal Society Grant RG130022, EPSRC Grant EP/L025906/1, BBSRC Grant BB/L022761/1. C.O. acknowl-edges funding from the European Union under a Marie Curie Initial Training Network FP7-PEOPLE-2012-ITN Grant Agreement Number 316630 CAS-IDP. J.M.L. and R.A.S. acknowledge support from EPSRC. We thank Stephan Grzesiek, Hans Juergen Sass, and Marco Rogowski for the generous gift of deuterated GB1. The UK 850 MHz solid-state NMR Facility used in this research was funded by Figure 3. a)15
NR11rates for GB1 in complex with IgG measured at
60 kHz (blue bars;w1N/2p=17 kHz), 52 kHz (red bars;w1N/
2p=13.1 kHz), and 45 kHz (black bars;w1N/2p=13 kHz) spinning
frequency at 850 MHz1
H Larmor frequency and a sample temperature
of 2718C. b) Visualization of the overall 3D GAF motion of GB1 in
the complex with IgG consistent with the data in (a). The amplitudes of fluctuations are listed next to the axes of motion. The approximate
correlation time for the motion is 80ms. c) Comparison of15
NR11
rates back-calculated from the best-fit to the 3D GAF model in (b) to experimental rates.
4
www.angewandte.org 2015 The Authors. Published by Wiley-VCH Verlag GmbH & Co. KGaA, Weinheim Angew. Chem. Int. Ed.2015,54, 1 – 6EPSRC and BBSRC (contract reference PR140003), as well as the University of Warwick including via part funding through Birmingham Science City Advanced Materials Projects 1 and 2 supported by Advantage West Midlands (AWM) and the European Regional Development Fund (ERDF). Figures 2 and 3 b were produced using the UCSF Chimera package, which was developed by the RBVI at the U. of California, San Francisco (supported by NIGMS P41-GM103311). Raw NMR data and Matlab scripts used for the analysis can be obtained from the authors upon request.
Keywords: magic-angle spinning · NMR spectroscopy · protein– antibody complexes · protein dynamics · protein–
protein interactions
[1] a) M. Karplus, J. A. McCammon,Annu. Rev. Biochem.1983,52,
263 – 300; b) K. Henzler-Wildman, D. Kern,Nature2007,450,
964 – 972.
[2] C. S. Goh, D. Milburn, M. Gerstein,Curr. Opin. Struct. Biol.
2004,14, 104 – 109.
[3] a) A. K. Mittermaier, L. E. Kay,Trends Biochem. Sci.2009,34,
601 – 611; b) J. Yang, M. L. Tasayco, T. Polenova,J. Am. Chem.
Soc. 2009, 131, 13690 – 13702; c) J. z. R. Lewandowski, Acc.
Chem. Res.2013,46, 2018 – 2027.
[4] a) A. Mainz, T. L. Religa, R. Sprangers, R. Linser, L. E. Kay, B.
Reif,Angew. Chem. Int. Ed.2013,52, 8746 – 8751;Angew. Chem.
2013,125, 8909 – 8914; b) A. Mainz, S. Jehle, B. J. van Rossum,
H. Oschkinat, B. Reif,J. Am. Chem. Soc.2009,131, 15968 –
15969; c) A. Mainz, B. Bardiaux, F. Kuppler, G. Multhaup, I. C.
Felli, R. Pierattelli, B. Reif,J. Biol. Chem.2012,287, 1128 – 1138;
d) J. M. Lamley, D. Iuga, C. Oster, H. J. Sass, M. Rogowski, A. Oss, J. Past, A. Reinhold, S. Grzesiek, A. Samoson, J. R.
Lewandowski,J. Am. Chem. Soc.2014,136, 16800 – 16806; e) I.
Gelis, V. Vitzthum, N. Dhimole, M. A. Caporini, A. Schedlbauer,
D. Carnevale, S. R. Connell, P. Fucini, G. Bodenhausen, J.
Biomol. NMR2013,56, 85 – 93; f) C. Gardiennet, A. K. Schtz, A. Hunkeler, B. Kunert, L. Terradot, A. Bçckmann, B. H. Meier,
Angew. Chem. Int. Ed.2012, 51, 7855 – 7858; Angew. Chem.
2012, 124, 7977 – 7980; g) E. Barbet-Massin, C.-T. Huang, V.
Daebel, S.-T. D. Hsu, B. Reif,Angew. Chem. Int. Ed.2015,54,
4367 – 4369; Angew. Chem. 2015, 127, 4441 – 4444; h) A. J.
Baldwin, P. Walsh, D. F. Hansen, G. R. Hilton, J. L. Benesch, S.
Sharpe, L. E. Kay,J. Am. Chem. Soc.2012,134, 15343 – 15350.
[5] W. T. Franks, D. H. Zhou, B. J. Wylie, B. G. Money, D. T.
Graesser, H. L. Frericks, G. Sahota, C. M. Rienstra, J. Am.
Chem. Soc.2005,127, 12291 – 12305.
[6] J. M. Lamley, M. J. Lougher, H. J. Sass, S. Grzesiek, J. R.
Lewandowski,Phys. Chem. Chem. Phys.2015, 17, 21997 – 22008.
[7] G. C. Stone, U. Sjçbring, L. Bjçrck, J. Sjçquist, C. Barber, F.
Nardella,J. Immunol.1989,143, 565 – 570.
[8] a) A. Krushelnitsky, T. Zinkevich, D. Reichert, V. Chevelkov, B.
Reif, J. Am. Chem. Soc. 2010, 132, 11850 – 11853; b) J. R.
Lewandowski, H. J. Sass, S. Grzesiek, M. Blackledge, L.
Emsley,J. Am. Chem. Soc.2011,133, 16762 – 16765.
[9] a) M. Yamaguchi, A. Tsutsumi,Polym. J. 1993,25, 131 – 139;
b) R. Kurbanov, T. Zinkevich, A. Krushelnitsky,J. Chem. Phys.
2011,135, 184104; c) A. Krushelnitsky, R. Kurbanov, D.
Rei-chert, G. Hempel, H. Schneider, V. Fedotov,Solid State Nucl.
Magn. Reson.2002,22, 423 – 438; d) C. Fars, J. Qian, J. H. Davis,
J. Chem. Phys.2005,122, 194908.
[10] P. Ma, J. D. Haller, J. Zajakala, P. Macek, A. C. Sivertsen, D.
Willbold, J. Boisbouvier, P. Schanda, Angew. Chem. Int. Ed.
2014,53, 4312 – 4317;Angew. Chem.2014,126, 4400 – 4405.
[11] R. B. Fenwick, H. van den Bedem, J. S. Fraser, P. E. Wright,
Proc. Natl. Acad. Sci. USA2014,111, E445 – E454.
[12] a) H. B. Cole, D. A. Torchia,Chem. Phys.1991,158, 271 – 281;
b) V. Chevelkov, A. V. Zhuravleva, Y. Xue, B. Reif, N. R.
Skrynnikov,J. Am. Chem. Soc.2007,129, 12594 – 12595; c) V.
Agarwal, Y. Xue, B. Reif, N. R. Skrynnikov,J. Am. Chem. Soc.
2008,130, 16611 – 16621.
[13] A. G. Palmer, F. Massi,Chem. Rev.2006,106, 1700 – 1719.
[14] J. R. Lewandowski, J. Sein, M. Blackledge, L. Emsley,J. Am.
Chem. Soc.2010,132, 1246 – 1248.
[15] A. N. Volkov, J. A. Worrall, E. Holtzmann, M. Ubbink,Proc.
Natl. Acad. Sci. USA2006,103, 18945 – 18950.
[16] D. B. Good, S. Wang, M. E. Ward, J. Struppe, L. S. Brown, J. R.
Lewandowski, V. Ladizhansky, J. Am. Chem. Soc. 2014,136,
2833 – 2842.
Received: September 30, 2015
Communications
Solid-State NMR Spectroscopy
J. M. Lamley, C. ster, R. A. Stevens, J. R. Lewandowski* &&&&—&&&&
Intermolecular Interactions and Protein Dynamics by Solid-State NMR
Spectroscopy
Protein dynamics: To investigate the influence of different intermolecular interactions on the protein dynamics extensive widespread site-specific
15N relaxation measurements were
com-pared for a protein GB1 in a crystal and in an antibody complex with a molecular weight of more than 300 kDa (see pic-ture). The proposed approach allows to directly access dynamics of a protein in large protein complexes.