http://wrap.warwick.ac.uk
Original citation:
Leng, Yue, Wainwright, Nick W.J., Cappuccio, Francesco P., Surtees, Paul G., Luben,
Robert, Wareham, Nick, Brayne, Carol and Khaw, Kay-Tee. (2014) Self-reported sleep
patterns in a British population cohort. Sleep Medicine, Volume 15 (Number 3). pp.
295-302. ISSN 1389-9457
Permanent WRAP url:
http://wrap.warwick.ac.uk/60261
Copyright and reuse:
The Warwick Research Archive Portal (WRAP) makes this work of researchers of the
University of Warwick available open access under the following conditions.
This article is made available under the Creative Commons Attribution 3.0 (CC BY 3.0)
license and may be reused according to the conditions of the license. For more details
see:
http://creativecommons.org/licenses/by/3.0/
A note on versions:
The version presented in WRAP is the published version, or, version of record, and may
be cited as it appears here.
Original Article
Self-reported sleep patterns in a British population cohort
q
Yue Leng
a,⇑, Nick W.J. Wainwright
a, Francesco P. Cappuccio
b, Paul G. Surtees
a, Robert Luben
a,
Nick Wareham
c, Carol Brayne
d, Kay-Tee Khaw
aa
Department of Public Health and Primary Care, Strangeways Research Laboratory, University of Cambridge, Cambridge, UK b
Division of Mental Health and Well-being, Warwick Medical School, University of Warwick, Coventry, UK c
Medical Research Council Epidemiology Unit, Institute of Metabolic Science, Cambridge, UK d
Department of Public Health and Primary Care, Institute of Public Health, University of Cambridge, Cambridge, UK
a r t i c l e
i n f o
Article history:
Received 2 July 2013
Received in revised form 9 October 2013 Accepted 11 October 2013
Available online 18 January 2014
Keywords:
Sleep quantity Sleep patterns Sleep research England Population Epidemiology
a b s t r a c t
Objectives:Sleep patterns have been linked to various health outcomes, but sleep patterns in the British population have not been extensively reported. We aimed to describe the sleep characteristics reported by the European Prospective Investigation of Cancer (EPIC)-Norfolk participants, with a particular empha-sis on the comparison of measures of sleep quantity.
Methods:From 2006 to 2007, a total of 8480 participants aged 45–90 years reported sleep timing, night-time sleep duration, and sleep difficulties. Time in bed (TIB) was calculated from the difference between rise time and bedtime, and sleep proportion was defined as the ratio of sleep duration and TIB.
Results: On average, the reported TIB was more than 1.5 h longer than sleep durations. Compared to men, women spent 15 min longer in bed, but they slept for 11 min less and reported more sleep difficulties. In multivariate analysis sleep duration and TIB varied with socioeconomic factors, but sleep proportion was consistently lower among women, nonworkers, and older individuals, as well as those who were wid-owed, separated, or divorced; those who reported sleep difficulties and more frequently used sleep med-ication; and those who had lower education, poorer general health, or a major depressive disorder (MDD).
Conclusions: Self-reported sleep duration and TIB have different meanings and implications for health. Sleep proportion may be a useful indicator of sleep patterns in the general population.
Ó2014 The Authors. Published by Elsevier B.V. All rights reserved.
1. Introduction
There are growing claims that we are now chronically sleep de-prived due to increasing demands and pressures of modern society
[1,2]. At the same time, recent findings from the Multinational Time Use Survey[3]suggested increased prevalence of long sleep dura-tion among representative populadura-tions from 10 counties. Interest-ingly, a large Internet-based sleep survey covering 10,810 British adults suggested that few individuals opted for more sleep when given other alternatives, despite the reported sleep deficit[4]. Exten-sive epidemiologic evidence has associated both short and long self-reported sleep duration with a range of health outcomes including all-cause mortality [5,6], cardiovascular diseases [7], diabetes mellitus[8], hypertension[9], obesity[10], and impaired cognitive function[11]. Most of these studies have relied on a single question
of sleep duration as the exposure, which led to concerns over the true meaning of this measure. For instance weekend sleep, usually known as the catch-up sleep, is longer than weekday sleep[12]. The time individuals spend in bed is influenced by many factors such as presleep lifestyles in addition to the sleep period itself, and time in bed (TIB) and sleep duration might have different impli-cations for health. However, the two terms have been improperly used in many previous epidemiologic studies[13]. Understanding how to most adequately measure and characterize sleep patterns in the population may help clarify the link among sleep, well-being, and ill-health.
Few studies have provided a subjective sleep profile of the British population. One of the earlier studies[14]reported an average sleep duration of 7.6 h per 24 h in sleep diaries from 509 British adults. Another study using electroencephalogram records[15]found sleep durations of 7.3 h and 7.1 h among men and women, respectively. Both studies used objective measures of sleep, with the aim of pre-senting the age and sex distribution of the realistic sleep duration. A national survey [16]on perceived sleep in the British population took place in 2004 and covered a representative sample of 2000 adults. This survey addressed several sleep questions, including sleep duration, general sleep quality, and a range of sleep difficulties. Average sleep duration (7.04 h) was found to be 30 min less than the
1389-9457/$ - see front matterÓ2014 The Authors. Published by Elsevier B.V. All rights reserved.
http://dx.doi.org/10.1016/j.sleep.2013.10.015
q
This is an open-access article distributed under the terms of the Creative Commons Attribution License, which permits unrestricted use, distribution, and reproduction in any medium, provided the original author and source are credited. ⇑ Corresponding author. Address: Department of Public Health and Primary Care, Strangeways Research Laboratory, University of Cambridge, Cambridge CB1 8RN, UK. Tel.: +44 (0) 1223748686.
E-mail address:[email protected](Y. Leng).
Contents lists available atScienceDirect
Sleep Medicine
reported TIB. Descriptive studies from other countries have shown more variations. Most studies examined the sociodemographic dis-tributions of sleep duration[17–19], though only a few studies pre-sented the different aspects of sleep in detail[20–22].
Few studies have distinguished overall sleeping time between TIB and actual sleep durations[23]or weekday and weekend sleep time. Although the difference between TIB and sleep duration is obvious, the two terms have been easily confused with one another in previous studies with subjective sleep measures. More impor-tantly, their potential different health implications indicate that it might be worth investigating the two sleep times separately in epi-demiologic studies. Little is known about how each of these sleeping times vary by sociodemographic factors and how they may be linked to sleep quality. Our study aimed to provide a subjective profile of the sleep patterns in a British population, with a particular emphasis on the following questions. (1) How much do we sleep every night? (2) How is sleep duration different from the time we spend in bed? (3) How is weekend sleep different from weekday sleep? (4) How do these times vary by sociodemographic factors? (5) How does re-ported sleep quantity relate to sleep quality or sleep difficulties?
2. Methods
2.1. Study overview
Data were drawn from the European Prospective Investigation of Cancer (EPIC)-Norfolk prospective cohort study. The design and study methods of EPIC-Norfolk have been previously described[24,25]. Briefly 30,445 men and women aged 40–74 years were recruited into the EPIC-Norfolk study from 1993 to 1997 using general practice age-sex registers. There were 25,639 participants who attended the baseline health check. These participants were then followed up for two further health checks from 1996 to 2000 and 2006 to 2011. In between these health examinations, participants were sent question-naires for completion and were expected to return them by mail (Fig. 1). The Norwich District Ethics Committee approved the study and all participants gave signed informed consent.
2.2. Measures of sleep
From 2006 to 2007, a total of 10,126 participants out of 13,969 eligible individuals completed the sleep questions in the EPIC phys-ical activity questionnaire (EPAQ2-3HC). The questionnaire asked the following questions: ‘‘At what time do you normally get up?’’ ‘‘At what time do you normally go to bed?’’ The responses were sep-arately obtained for an average weekday and weekend day over the previous year. For our study, 85 participants who reported unusual times of going to bed (6:00–18:00 pm) or getting up (12:00– 24:00 pm/0:00–3:00 am) were omitted to make the interpretation more straightforward, leaving 10,041 individuals for analysis.
During the same period, some detailed questions on sleep pat-terns over the previous 4 weeks were asked in the Health and Life-style Questionnaire 2 (HLEQ2), completed by 12,897 participants. ‘‘Have you had difficulty getting to sleep at night?’’ ‘‘Have you wo-ken-up during the night and had trouble getting back to sleep?’’ ‘‘Have you woken-up too early in the morning and had difficulty getting back to sleep?’’ ‘‘Have you taken any prescribed medicine to help with your sleep?’’ ‘‘On average, about how many hours have you slept each night?’’ Response categories for the first four questions included yes, usually/yes, sometimes/never, or rarely. Sleep duration was reported by hours and minutes.
2.3. Sociodemographic variables
2.3.1. Baseline
The baseline questionnaire included the following sociodemo-graphic variables: (1) social class (nonmanual/manual); (2)
educational level (highest qualification attained: no qualifications, educated to the age of 16 years, educated to the age of 18 years, and educated to degree level; further collapsed into lower and higher); (3) presence of major depressive disorder (MDD) (yes/ no)[26]; and (4) report of working night shift (yes/no).
2.3.2. Follow-up three or four health questionnaires
Other sociodemographic variables included on third and fourth follow-up health questionnaires were: (1) working status (not working, working635 h/week, working >35 h/week); (2) marital
status (single, married, other); (3) self-reported general health (excellent, very good, good, fair, poor); (4) self-reported preexisting health problems (yes/no; yes is any of the three: myocardial infarc-tion, stroke, or cancer); and (5) coffee intake (61 cup/day or >1
cup/day).
2.4. Analysis
Comparisons between TIB and sleep duration on their sociode-mographic correlations and interrelationships with sleep quality were performed using data from 8480 participants who completed the sleep questions on both the EPAQ2-3HC and HLEQ2. TIB was derived from the differences between rise time and bedtime, and a weighted mean measure was calculated as 5/7(TIB on a week-day)+2/7(TIB on a weekend day). Sleep proportion was defined by the ratio of nighttime sleep duration and TIB. A sleep duration (or TIB) of longer than 14 h or less than 3 h was considered abnor-mal, and thereby was coded as missing values (n= 27). A sleep pro-portion of more than one also was disregarded (n= 319).
The sociodemographic associations of each sleep variable were examined by both univariate and multivariate analyses. Distribu-tions of TIB, sleep duration, and sleep proportion were specifically picked up to clarify the overall sleep time. Interrelationships be-tween measures of sleep quantity and sleep quality were then ex-plored. The comparisons of normally distributed exposure variables were based onttests for two groups and analysis of var-iance for three or more groups. The Wilcoxon rank sum test or the Kruskal–Wallis test was used for the ordinal variable (sleep pro-portion). Categorical variables were compared by Pearson product moment correlation
v
2tests. All statistical tests were two sided.Analyses were implemented in STATA version 12.0.
3. Results
3.1. Sleep timing: TIB
The average bedtime and rise time on weekdays was 22:41 pm and 7:17 am, respectively. On the weekend, individuals reported going to bed 12 min later (22:53 pm) but getting up 27 min later (7:44 am). This difference led to a TIB of 8 h and 36 min and 8 h and 51 min on weekdays and weekends, respectively. Supplemen-tary Table 1shows the distributions of the weekday and weekend bedtime and rise times. This Table also shows that older individu-als spent longer in bed than younger individuindividu-als on weekdays, though the differences for weekends were smaller. Those who were working or worked for more hours spent much less TIB on weekdays; they also got up earlier but went to bed at similar times. However, these individuals tended to catch up on weekends by getting up more than 1 h later than they did on weekdays.
3.2. Sleep difficulties
Sleep difficulties more often were reported by women than men. There were 63.3% of who men reported never experiencing difficulty falling asleep vs 39.6% for women. Early awakening was
the most common sleep complaint, reported by 652 (11.7%) men and 1076 (14.7%) women. Of the men and women, 9% and 14.7%, respectively, reported usually waking up during the night and hav-ing trouble gohav-ing back to sleep.Supplementary Table 2shows that younger individuals, working individuals, individuals with higher social class or higher education, and individuals with self-reported excellent general health reported fewer sleep problems and were less likely to take sleep medication.
3.3. TIB: sleep duration and sleep proportion
On average, the reported TIB was more than 1.5 h longer than sleep durations.Table 1shows the different sociodemographic dis-tributions of TIB, sleep duration, and sleep proportion. Women spent 15 min longer in bed but slept for 11 min less, and therefore had lower sleep proportion than men (79% vs 84%, respectively). Similarly older rather than younger individuals spent much more TIB (41 min and 26 min more for men and women, respectively), but they slept for less time (4 min and 18 min less for men and wo-men, respectively) and had lower sleep proportion. Those who had lower education, poor general health, or MDD all showed the same patterns and had lower sleep proportion. The same results were re-vealed for those who were not working, who usually used sleep medication, as well as those who were widowed, separated, or divorced.
Multivariate analysis (Table 2) shows that age, sex, education, working status, marital status, general health, preexisting diseases, presence of MDD, and use of sleep medications were all indepen-dently associated with sleep proportion. Notably women or those with fair or poor health had much lower sleep proportion than
the others, even after adjusting for all the covariates for women (b= 0.03 [95% confidence interval {CI} 0.04 to 0.03]) and those with poorer health (b= 0.04 [95% CI, 0.05 to 0.03]). Compared to those who used sleep medication, the nonusers had much higher sleep proportion (b= 0.07 [95% CI, 0.05–0.09]), but there was no significant difference between the frequency in which the medica-tion was used.
3.4. Interrelationships between measures of sleep quantity and sleep quality
Table 3summarizes the interrelationships between sleep quan-tity and sleep quality measures. All three reported sleep difficulties were associated with the reported sleep quantity and sleep propor-tion. Those who reported usually experiencing difficulty falling asleep, waking up during the night or early morning, and having difficulty going back to sleep had the lowest sleep proportion, with the highest being 0.70. Those who reported never experiencing these sleep problems had the highest sleep proportion, at approx-imately 0.87. These associations were unchanged after adjusting for the above sociodemographic factors.
4. Discussion
Our study provides a sleep profile of the EPIC-Norfolk popula-tion, a middle aged and older British population up to 75 years of age at baseline. The time individuals spent in bed every night was calculated from the reported bedtimes and rise times and on average was more than 1.5 h longer than sleep durations reported at a similar period. Compared to men, women had longer TIB, more 30,445 participants recruited
at baseline
1HC
2HC
3HC
25,639 participants seen at the first HC
Follow-up 1: health questionnaire (n=20,514)
Follow-up 2: health questionnaire (n=19,042)
Follow-up 3: health questionnaire (n=17,585)
Follow-up 4: health questionnaire (n=10,871)
EPAQ2-2HC (n=15,676) (1998–2000)
EPAQ2-3HC (n=10,126) (2006–2007)
HLEQ1 (n=20,921) (1996–2000)
HLEQ2 (n=12,897) (2006–2007)
1993
1997
1998
2000
2004
2011 Participants with sleep
data on both EPAQ2-3HC and HLEQ2
(n=8480)
[image:4.595.154.451.69.394.2](Final study sample)
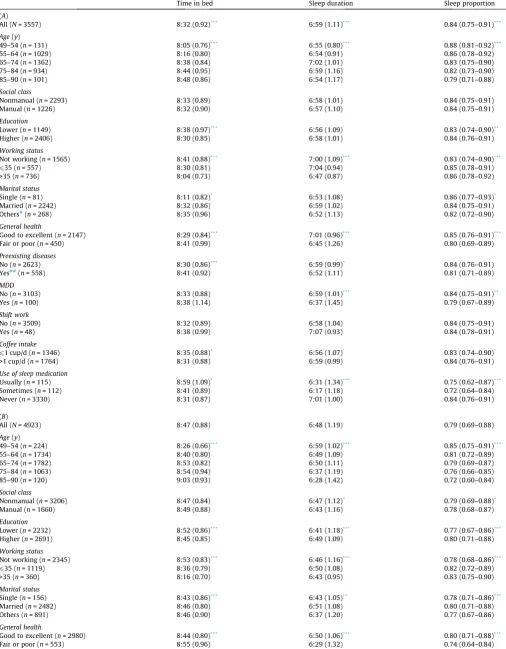
Table 1
Sociodemographic distributions of time in bed, sleep duration, and sleep proportion in Norwich, United Kingdom, from 2006 to 2007 (A, men; B, women).
Time in bed Sleep duration Sleep proportion
(A)
All (N= 3557) 8:32 (0.92)***
6:59 (1.11)***
0.84 (0.75–0.91)***
Age(y)
49–54 (n= 131) 8:05 (0.76)*** 6:55 (0.80)*** 0.88 (0.81–0.92)***
55–64 (n= 1029) 8:16 (0.80) 6:54 (0.91) 0.86 (0.78–0.92)
65–74 (n= 1362) 8:38 (0.84) 7:02 (1.01) 0.83 (0.75–0.90)
75–84 (n= 934) 8:44 (0.95) 6:59 (1.16) 0.82 (0.73–0.90)
85–90 (n= 101) 8:48 (0.86) 6:54 (1.17) 0.79 (0.71–0.88)
Social class
Nonmanual (n= 2293) 8:33 (0.89) 6:58 (1.01) 0.84 (0.75–0.91)
Manual (n= 1226) 8:32 (0.90) 6:57 (1.10) 0.84 (0.75–0.91)
Education
Lower (n= 1149) 8:38 (0.97)*** 6:56 (1.09) 0.83 (0.74–0.90)**
Higher (n= 2406) 8:30 (0.85) 6:58 (1.01) 0.84 (0.76–0.91)
Working status
Not working (n= 1565) 8:41 (0.88)*** 7:00 (1.09)*** 0.83 (0.74–0.90)***
635 (n= 557) 8:30 (0.81) 7:04 (0.94) 0.85 (0.78–0.91)
>35 (n= 736) 8:04 (0.73) 6:47 (0.87) 0.86 (0.78–0.92)
Marital status
Single (n= 81) 8:11 (0.82)* 6:53 (1.08) 0.86 (0.77–0.93)*
Married (n= 2242) 8:32 (0.86) 6:59 (1.02) 0.84 (0.75–0.91)
Others#
(n= 268) 8:35 (0.96) 6:52 (1.13) 0.82 (0.72–0.90)
General health
Good to excellent (n= 2147) 8:29 (0.84)*** 7:01 (0.96)*** 0.85 (0.76–0.91)***
Fair or poor (n= 450) 8:41 (0.99) 6:45 (1.26) 0.80 (0.69–0.89)
Preexisting diseases
No (n= 2623) 8:30 (0.86)*** 6:59 (0.99)* 0.84 (0.76–0.91)
Yes##
(n= 558) 8:41 (0.92) 6:52 (1.11) 0.81 (0.71–0.89)
MDD
No (n= 3103) 8:33 (0.88) 6:59 (1.01)*** 0.84 (0.75–0.91)**
Yes (n= 100) 8:38 (1.14) 6:37 (1.45) 0.79 (0.67–0.89)
Shift work
No (n= 3509) 8:32 (0.89) 6:58 (1.04) 0.84 (0.75–0.91)
Yes (n= 48) 8:38 (0.99) 7:07 (0.93) 0.84 (0.78–0.91)
Coffee intake
61 cup/d (n= 1346) 8:35 (0.88)* 6:56 (1.07) 0.83 (0.74–0.90)*
>1 cup/d (n= 1764) 8:31 (0.88) 6:59 (0.99) 0.84 (0.76–0.91)
Use of sleep medication
Usually (n= 115) 8:59 (1.09)* 6:31 (1.34)*** 0.75 (0.62–0.87)***
Sometimes (n= 112) 8:41 (0.89) 6:17 (1.18) 0.72 (0.64–0.84)
Never (n= 3330) 8:31 (0.87) 7:01 (1.00) 0.84 (0.76–0.91)
(B)
All (N= 4923) 8:47 (0.88) 6:48 (1.19) 0.79 (0.69–0.88)
Age(y)
49–54 (n= 224) 8:26 (0.66)*** 6:59 (1.02)*** 0.85 (0.75–0.91)***
55–64 (n= 1734) 8:40 (0.80) 6:49 (1.09) 0.81 (0.72–0.89)
65–74 (n= 1782) 8:53 (0.82) 6:50 (1.11) 0.79 (0.69–0.87)
75–84 (n= 1063) 8:54 (0.94) 6:37 (1.19) 0.76 (0.66–0.85)
85–90 (n= 120) 9:03 (0.93) 6:28 (1.42) 0.72 (0.60–0.84)
Social class
Nonmanual (n= 3206) 8:47 (0.84) 6:47 (1.12)* 0.79 (0.69–0.88)*
Manual (n= 1660) 8:49 (0.88) 6:43 (1.16) 0.78 (0.68–0.87)
Education
Lower (n= 2232) 8:52 (0.86)*** 6:41 (1.18)*** 0.77 (0.67–0.86)***
Higher (n= 2691) 8:45 (0.85) 6:49 (1.09) 0.80 (0.71–0.88)
Working status
Not working (n= 2345) 8:53 (0.83)*** 6:46 (1.16)*** 0.78 (0.68–0.86)***
635 (n= 1119) 8:36 (0.79) 6:50 (1.08) 0.82 (0.72–0.89)
>35 (n= 360) 8:16 (0.70) 6:43 (0.95) 0.83 (0.75–0.90)
Marital status
Single (n= 156) 8:43 (0.86)*** 6:43 (1.05)** 0.78 (0.71–0.86)***
Married (n= 2482) 8:46 (0.80) 6:51 (1.08) 0.80 (0.71–0.88)
Others (n= 891) 8:46 (0.90) 6:37 (1.20) 0.77 (0.67–0.86)
General health
Good to excellent (n= 2980) 8:44 (0.80)*** 6:50 (1.06)*** 0.80 (0.71–0.88)***
Fair or poor (n= 553) 8:55 (0.96) 6:29 (1.32) 0.74 (0.64–0.84)
sleep difficulties, and shorter sleep durations. Sleep duration and TIB varied with sociodemographic factors, but sleep proportion was consistently lower among women, nonworkers, and older individuals, as well as those who had lower education, poorer gen-eral health, and reported sleep difficulties.
To our knowledge, our study is the largest to describe sleep characteristics in a British population and the first to address the large gap between reported sleep duration and TIB. The EPIC-Nor-folk participants are comparable to national population samples such as the population studied in the Health Survey of England 1993 in anthropometric variables, blood pressure, and serum lipids
[24], as well as functional health[27]; they also both included par-ticipants with different socioeconomic statuses [28]. The wide range of sleep questions covered in validated questionnaires[29]
allowed us to examine patterns of sleep in more detail to generate approaches for future studies.
There are several limitations to our study. First, our main anal-ysis was based on 8480 participants who completed the EPAQ2 (3HC) and the HLEQ2. Compared to the other participants from the baseline sample (25,639 participants), these individuals were remarkably younger, more likely to be women, and of higher social and educational class. Although these differences should not affect the within-population associations of sociodemographic factors, the findings may not be generalizable to other populations. Second, there is likely to be measurement error from self-reported mea-sures of TIB and sleep duration. Reported sleep may be a marker of general functional state or distress levels[30]and individuals who have health problems tend to report shorter sleep hours
[31]. Besides we are comparing TIB, a computed variable, with sleep duration, which was determined by a single question. There-fore, the comparison was based on two different measurement ap-proaches. Although our questionnaire has not been previously validated, the wording of our questions and the comparison ap-proach were similar to those used in the Pittsburgh Sleep Quality Index, which has been extensively validated[32]. It also has been suggested that the use of times of going to bed, sleep onset, morn-ing awakenmorn-ing, and rise times might help to clarify the confusmorn-ing use of sleep duration and TIB[13,33]. From a practical standpoint,
evaluation of sleep durations in the primary care setting relies on self-reported data from patients and reflects the individual’s own perception, which has validity in itself and has been associated with hard health end points[5,7,8]. Although objective measures of sleep may be feasible with new and available technologies, self-reported measure of sleep may still be a practical and useful measure in epidemiologic studies. Finally, our study presented re-sults from descriptive analyses of a range of sociodemographic measures and differences in reported sleep patterns, which there-fore require replication in other large-scale studies to provide bet-ter understanding of the relationships observed.
TIB was almost 2 h longer than sleep duration—more than that found in other studies using self-report measures[16,21,22]. Com-pared to a middle-aged Norwegian population and participants aged 55–101 years from the study of seven European countries, the EPIC-Norfolk participants reported longer TIB but similar sleep duration. This finding might be due to methodologic differences. The way we measured TIB was different from that in other studies. In addition, our study covered a sample aged 40–90 years, while the Hordaland Health Study [22] was conducted among individuals aged 40– 45 years. However, our findings are in keeping with previous studies using objective measures of sleep[34,35]. Although our results need to be replicated by more population studies, they highlighted a poten-tially significant difference between TIB and sleep duration. The de-sign of future epidemiologic studies should consider the inclusion of the assessment of TIB to avoid misinterpretation of sleeping time.
As expected, individuals spent much more TIB on weekends than on weekdays, especially among those who were younger or those who had a job. Individuals who were working spent more TIB on weekends by getting up more than 1 h later than they did on weekdays, reflective of the suggested weekend recovery sleep among workers [13]. The differences in TIB among sociodemo-graphic groups seem to be greater on weekdays. It is possible that weekday sleep also may be a better predictor of future health risk if it is a more sensitive indicator of sociodemographic differences; further studies are needed to support this hypothesis.
[image:6.595.45.563.80.254.2]Our study suggested that women spent more TIB, went to bed earlier, and got up later than men. This finding is consistent with
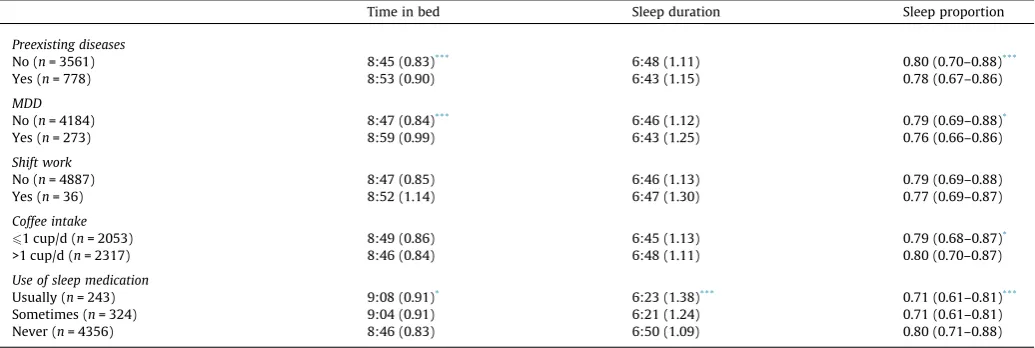
Table 1(continued)
Time in bed Sleep duration Sleep proportion
Preexisting diseases
No (n= 3561) 8:45 (0.83)*** 6:48 (1.11) 0.80 (0.70–0.88)***
Yes (n= 778) 8:53 (0.90) 6:43 (1.15) 0.78 (0.67–0.86)
MDD
No (n= 4184) 8:47 (0.84)*** 6:46 (1.12) 0.79 (0.69–0.88)*
Yes (n= 273) 8:59 (0.99) 6:43 (1.25) 0.76 (0.66–0.86)
Shift work
No (n= 4887) 8:47 (0.85) 6:46 (1.13) 0.79 (0.69–0.88)
Yes (n= 36) 8:52 (1.14) 6:47 (1.30) 0.77 (0.69–0.87)
Coffee intake
61 cup/d (n= 2053) 8:49 (0.86) 6:45 (1.13) 0.79 (0.68–0.87)*
>1 cup/d (n= 2317) 8:46 (0.84) 6:48 (1.11) 0.80 (0.70–0.87)
Use of sleep medication
Usually (n= 243) 9:08 (0.91)* 6:23 (1.38)*** 0.71 (0.61–0.81)***
Sometimes (n= 324) 9:04 (0.91) 6:21 (1.24) 0.71 (0.61–0.81)
Never (n= 4356) 8:46 (0.83) 6:50 (1.09) 0.80 (0.71–0.88)
Abbreviations:y, years; MDD, major depressive disorder; d, day. For all,⁄
is for comparisons between men and women. Comparisons of time in bed and sleep duration were based onttests or one-way analysis of variance, and comparisons of sleep proportion were based on Wilcoxon rank sum test or Kruskal–Wallis test. All thePvalues show the overall comparisons among different sociodemographic groups. Time in bed and sleep duration are presented as mean (hour: minutes) (standard deviation [hour]); sleep proportion is presented as median (interquartile range). Sleep proportion = night time sleep duration/time in bed. All the variables were concurrently measured from 2006 to 2007, except for social class, education, MDD, and shift work, which were defined at baseline.
# Widowed, separated, or divorced.
## Self-reported myocardial infarction, stroke, or cancer.
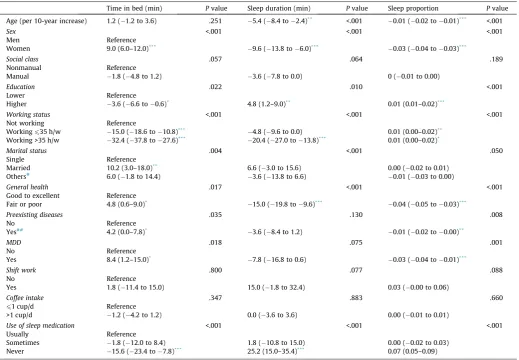
Table 2
Multivariate regressions for time in bed, sleep duration, and sleep proportion in Norwich, United Kingdom, from 2006 to 2007.
Time in bed (min) Pvalue Sleep duration (min) Pvalue Sleep proportion Pvalue Age (per 10-year increase) 1.2 ( 1.2 to 3.6) .251 5.4 ( 8.4 to 2.4)** <.001 0.01 ( 0.02 to 0.01)*** <.001
Sex <.001 <.001 <.001
Men Reference
Women 9.0 (6.0–12.0)*** 9.6 ( 13.8 to 6.0)*** 0.03 ( 0.04 to 0.03)***
Social class .057 .064 .189
Nonmanual Reference
Manual 1.8 ( 4.8 to 1.2) 3.6 ( 7.8 to 0.0) 0 ( 0.01 to 0.00)
Education .022 .010 <.001
Lower Reference
Higher 3.6 ( 6.6 to 0.6)* 4.8 (1.2–9.0)** 0.01 (0.01–0.02)***
Working status <.001 <.001 <.001
Not working Reference
Working635 h/w 15.0 ( 18.6 to 10.8)*** 4.8 ( 9.6 to 0.0) 0.01 (0.00–0.02)** Working >35 h/w 32.4 ( 37.8 to 27.6)*** 20.4 ( 27.0 to 13.8)*** 0.01 (0.00–0.02)*
Marital status .004 <.001 .050
Single Reference
Married 10.2 (3.0–18.0)** 6.6 ( 3.0 to 15.6) 0.00 ( 0.02 to 0.01)
Others#
6.0 ( 1.8 to 14.4) 3.6 ( 13.8 to 6.6) 0.01 ( 0.03 to 0.00)
General health .017 <.001 <.001
Good to excellent Reference
Fair or poor 4.8 (0.6–9.0)* 15.0 ( 19.8 to 9.6)*** 0.04 ( 0.05 to 0.03)***
Preexisting diseases .035 .130 .008
No Reference
Yes##
4.2 (0.0–7.8)* 3.6 ( 8.4 to 1.2) 0.01 ( 0.02 to 0.00)**
MDD .018 .075 .001
No Reference
Yes 8.4 (1.2–15.0)* 7.8 ( 16.8 to 0.6) 0.03 ( 0.04 to 0.01)***
Shift work .800 .077 .088
No Reference
Yes 1.8 ( 11.4 to 15.0) 15.0 ( 1.8 to 32.4) 0.03 ( 0.00 to 0.06)
Coffee intake .347 .883 .660
61 cup/d Reference
>1 cup/d 1.2 ( 4.2 to 1.2) 0.0 ( 3.6 to 3.6) 0.00 ( 0.01 to 0.01)
Use of sleep medication <.001 <.001 <.001
Usually Reference
Sometimes 1.8 ( 12.0 to 8.4) 1.8 ( 10.8 to 15.0) 0.00 ( 0.02 to 0.03)
Never 15.6 ( 23.4 to 7.8)*** 25.2 (15.0–35.4)*** 0.07 (0.05–0.09)
Abbreviations:min, minutes; h, hours; w, week; MDD, major depressive disorder; d, day.
Results are presented asb(confidence interval) in minutes. Sample sizes: time in bed N= 5055, sleep durationN= 5842, sleep proportionN= 4866. Sleep propor-tion = nighttime sleep durapropor-tion/time in bed. Each linear regression model includes all the above factors. All variables were concurrently measured from 2006 to 2007, except for social class, education, MDD and shift work, which were defined at baseline.
*P< .05. ** P< .01. ***P< .001.
#
Widowed, separated, or divorced.
##
Self-reported myocardial infarction, stroke, or cancer.
Table 3
Interrelationships between measures of sleep quality and sleep quantity in Norwich, United Kingdom, from 2006 to 2007.
Time in bed Sleep duration Sleep proportion Time in bed Sleep duration Sleep proportion Mean (SD) h Mean (SD) h Median (IQR) Mean (SD) h Mean (SD) h Median (IQR)
Difficulty falling asleep Difficulty falling asleep
Usually (n= 179) 8:40 (1.20)*** 5:46 (1.35)*** 0.65 (0.56–0.80)*** Usually (n= 478) 8:57 (1.05)*** 5:29 (1.16)*** 0.63 (0.53–0.71)*** Sometimes (n= 1104) 8:36 (0.86) 6:41 (1.00) 0.79 (0.71–0.87) Sometimes (n= 2494) 8:49 (0.82) 6:40 (1.04) 0.77 (0.68–0.84) Never (n= 2274) 8:30 (0.86) 7:12 (0.90) 0.87 (0.80–0.92) Never (n= 1951) 8:43 (0.82) 7:14 (0.94) 0.84 (0.77–0.91)
Waking up during the night Waking up during the night
Usually (n= 298) 8:39 (1.03)*** 5:46 (1.13)*** 0.68 (0.58–0.76)*** Usually (n= 690) 8:52 (0.97)*** 5:34 (1.12)*** 0.63 (0.55–0.73)*** Sometimes (n= 1933) 8:36 (0.85) 6:55 (0.96) 0.82 (0.74–0.89) Sometimes (n= 2993) 8:49 (0.81) 6:47 (0.99) 0.78 (0.70–0.85) Never (n= 1326) 8:26 (0.88) 7:19 (0.86) 0.88 (0.82–0.93) Never (n= 1240) 8:42 (0.86) 7:26 (0.86) 0.87 (0.80–0.93)
Early awakening Early awakening
Usually (n= 397) 8:28 (1.02)*** 5:51 (1.11)*** 0.70 (0.60–0.79)*** Usually (n= 674) 8:46 (0.99)*** 5:35 (1.11)*** 0.64 (0.56–0.75)*** Sometimes (n= 1878) 8:34 (0.85) 6:55 (0.91) 0.82 (0.74–0.89) Sometimes (n= 2738) 8:49 (0.81) 6:41 (0.97) 0.77 (0.69–0.84) Never (n= 1282) 8:32 (0.89) 7:24 (0.87) 0.88 (0.83–0.94) Never (n= 1511) 8:45 (0.84) 7:27 (0.88) 0.87 (0.80–0.93)
Abbreviations:SD, standard deviation; h, hours; IQR, interquartile range.
Comparisons of time in bed and sleep duration were based on one-way analysis of variance, and comparisons of sleep proportion were based on Kruskal–Wallis test. All theP
values show the overall comparisons among different levels of sleep difficulties. Time in bed and sleep duration are presented as mean (h:min) (SD [h]) and sleep proportion is presented as median (IQR). Sleep proportion = nighttime sleep duration/time in bed.
⁄
P< .05.
⁄⁄
P< .01. ***P< .001.
[image:7.595.33.558.555.694.2]previous studies[21,22]which included self-reported sleep timing, as well as one study[36] including measures of actigraphy and sleep logs.Fig. 2 shows the separation of TIB and sleep duration by age and sex. Interestingly the sleep duration decreased in wo-men and slightly increased in wo-men with age; however, the TIB in-creased for both men and women. This finding is in line with a meta-analysis of objective studies covering 3500 individuals aged 5–102 years[37], which suggested a decreased total sleep time and sleep efficiency with increasing age. These results might help to explain the increased sleep duration among the elderly popula-tions in previous studies using subjective sleep assessment
[38,39,21], as older individuals may overestimate sleep durations due to long sleep latency[15]. Sleep efficiencies decreased with age, but the decrease among women was greater than that among men. In our study, women reported more sleep difficulties than men and it is possible that the reduction in sleep duration seen with aging was more of a concern among women.
Similarly the TIB and sleep durations of the participants varied with other sociodemographic factors; however, sleep proportion seemed to be consistently lower among women, nonworkers, and older individuals, as well as those who were widowed, sepa-rated, or divorced; those who reported sleep difficulties and more frequently used sleep medication; and those who had lower edu-cation, poorer general health, or an MDD. These associations were unchanged even after multivariate analysis, which included all the above factors. This finding suggests that the sociodemograph-ic distributions of TIB and sleep durations should be separately explored in future observations. We are unaware of any previous studies of self-reported sleep that studied correlations of an indi-vidual’s sleep proportion. However, we have shown significantly decreased sleep proportion with increased sleep complaints among our participants, which suggested the potentially impor-tant role of sleep proportion as a relevant indicator of sleep in the population. It should be noted that those who took sleep med-ication slept for less time and had lower sleep proportion than those who never took such medication; however, the frequency of the medication did not make a notable difference. Although sleep medication is believed to improve sleep it is likely that the reported medication use was simply a reflection of their sleep problems, and thus the effects of sleep medication on sleep proportion are unclear.
5. Conclusion
Our study provides a sleep profile from a British population– based study. It highlights the large discrepancy between sleep duration and TIB and explores correlates of sleep proportion, which decreased with increasing age and was lower among women, non-workers, and older individuals, as well as those who were wid-owed, separated, or divorced; those who reported sleep difficulties and more frequently used sleep medication; and those who had lower education, poorer general health, or an MDD. Those who reported frequent experience of sleep difficulties also had much lower sleep proportion. Our study addresses the increasing concerns over the meaning of sleep duration defined by one single question. Sleep quantity should be better defined and interpreted to aid in the understanding of its clinical implications in future studies. Sleep proportion might be an adequate additional indica-tor of overall sleep patterns.
Funding sources
This work was supported by programme grants from the Med-ical Research Council UK G0401527 and Cancer Research UK (C864/A2883, C864/A8257). FPC leads the Sleep Health and Society Programme at the University of Warwick supported, in part, by the University of Warwick RDF and IAS. It has received funding by the NHS National Workforce Projects and the Economic and Social Re-search Council (ES/K002910/1).
Conflict of interest
The ICMJE Uniform Disclosure Form for Potential Conflicts of Interest associated with this article can be viewed by clicking on the following link:http://dx.doi.org/10.1016/j.sleep.2013.10.015
Appendix A. Supplementary data
Supplementary data associated with this article can be found, in the online version, at http://dx.doi.org/10.1016/j.sleep.2013. 10.015.
References
[1]Bonnet MH, Arand DL. We are chronically sleep deprived. Sleep 1995;18:908–11.
[2]Banks S, Dinges DF. Behavioral and physiological consequences of sleep restriction. J Clin Sleep Med 2007;3:519–28.
[3]Bin YS, Marshall NS, Glozier N. Sleeping at the limits: the changing prevalence of short and long sleep durations in 10 countries. Am J Epidemiol 2013;177:826–33.
[4]Anderson C, Horne JA. Do we really want more sleep? A population-based study evaluating the strength of desire for more sleep. Sleep Med 2008;9:184–7.
[5]Grandner MA, Hale L, Moore M, Patel NP. Mortality associated with short sleep duration: the evidence, the possible mechanisms, and the future. Sleep Med Rev 2010;14:191–203.
[6]Cappuccio FP, D’Elia L, Strazzullo P, Miller MA. Sleep duration and all-cause mortality: a systematic review and meta-analysis of prospective studies. Sleep 2010;33:585–92.
[7]Amagai Y, Ishikawa S, Gotoh T, Kayaba K, Nakamura Y, Kajii E. Sleep duration and incidence of cardiovascular events in a Japanese population: the Jichi Medical School Cohort Study. J Epidemiol 2010;20:106–10.
[8]Gangwisch JE, Heymsfield SB, Boden-Albala B, Buijs RM, Kreier F, Pickering TG, et al. Sleep duration as a risk factor for diabetes incidence in a large US sample. Sleep 2007;30:1667–73.
[9]Gottlieb DJ, Redline S, Nieto J, Baldwin CM, Newman AB, Resnick HE, et al. Association of usual sleep duration with hypertension: the sleep heart health study. Sleep 2006;29:1009–14.
[10]Patel SR, Hu FB. Short sleep duration and weight gain: a systematic review. Obesity 2008;16:643–53.
[11]Ferrie JE, Shipley MJ, Akbaraly TN, Marmot MG, Kivimäki M, Singh-Manoux A. Change in sleep duration and cognitive function: findings from the Whitehall II Study. Sleep 2011;34:565–73.
[12]Hale L. Who has time to sleep? J Public Health (Oxf) 2005;27:205–11. [13]Habitual Horne J. ‘‘Short sleep’’: six hours is ‘‘safe’’. J Sleep Res 2010;19(Pt
1):119–20.
[14]Tune GS. Sleep and wakefulness in 509 normal human adults. Br J Med Psychol 1969;42:75–80.
[15]Hume KI, Van F, Watson A. A field study of age and gender differences in habitual adult sleep. J Sleep Res 1998;7:85–94.
[16]Groeger JA, Zijlstra FRH, Dijk DJ. Sleep quantity, sleep difficulties and their perceived consequences in a representative sample of some 2000 British adults. J Sleep Res 2004;13:359–71.
[17]Ohida T, Kamal A, Uchiyama M, Kim K, Takemura S, Sone T, et al. The influence of lifestyle and health status factors on sleep loss among the Japanese general population. Sleep 2001;24:4–6.
[18]Kronholm E, Härmä M, Hublin C, Aro AR, Partonen T. Self-reported sleep duration in Finnish general population. J Sleep Res 2006;15:276–90. [19]Krueger PM, Friedman EM. Sleep duration in the United States: a
cross-sectional population-based study. Am J Epidemiol 2009;169:1052–63. [20] National Sleep Foundation. 2003 Sleep in America Poll: Sleep and aging.
Washington (DC): The Foundation; 2003 Mar. Available from: http:// www.sleepfoundation.org/article/sleep-america-polls/2003-sleep-and-aging.
[21]Ohayon MM. Interactions between sleep normative data and sociocultural characteristics in the elderly. J Psychosom Res 2004;56:479–86.
[22]Ursin R, Bjorvatn B, Holsten F. Sleep duration, subjective sleep need, and sleep habits of 40- to 45-year-olds in the Hordaland Health Study. Sleep 2005;28:1260–9.
[23]Ferrie JE, Kumari M, Salo P, Singh-Manoux A, Kivimäki M. Sleep epidemiology—a rapidly growing field. Int J Epidemiol 2011;40:1431–7.
[24]Day N, Oakes SA, Luben R, Khaw K-T, Bingham S, Welch A, et al. EPIC-Norfolk: study design and characteristics of the cohort. Br J Cancer 1999;80(Suppl. 1):S95–S103.
[25]Hayat S, Luben R, Keevil V, Moore S, Dalzell N, Bhaniani A, et al. Cohort profile: a prospective cohort study of objective physical and cognitive capability and visual health in an ageing population of men and women in Norfolk (EPIC-Norfolk 3). Int J Epidemiol 2013 [Published online ahead of print June 14, 2013]. [26]Surtees PG, Wainwright NW, Luben R, Wareham NJ, Bingham SA, Khaw K-T. Depression and ischemic heart disease mortality: evidence from the EPIC-Norfolk United Kingdom prospective cohort study. Am J Psychiatry 2008;165:515–23. [27]Surtees PG, Wainwright NW, Khaw KT. Obesity, confidant support and
functional health: cross-sectional evidence from the EPIC-Norfolk cohort. Int J Obes Relat Metab Disord 2004;28:748–58.
[28]Wainwright NW, Surtees PG. Places, people, and their physical and mental functional health. J Epidemiol Commun Health 2004;58:333–9.
[29]Wareham NJ, Jakes RW, Rennie KL, Schuit J, Mitchell J, Hennings S, et al. Validity and repeatability of the EPIC-Norfolk physical activity questionnaire. Int J Epidemiol 2002;31:168–74.
[30]Lavie P. Self-reported sleep duration—what does it mean? J Sleep Res 2009;18:385–6.
[31]Lauderdale D. Sleep duration: how well do self-reports reflect objective measures? The CARDIA Sleep Study. Epidemiology 2008;19:838–45. [32]Buysse DJ, Reynolds CF, Monk TH, Berman SR, Kupfer DJ. The Pittsburgh Sleep
Quality Index: a new instrument for psychiatric practice and research. Psychiatr Res 1989;28:193–213.
[33]Horne J. The end of sleep: ‘‘sleep debt’’ versus biological adaptation of human sleep to waking needs. Bio Psychol 2011;87:1–14.
[34]Lauderdale DS, Knutson KL, Yan LL, Rathouz PJ, Hulley SB, Sidney S, et al. Objectively measured sleep characteristics among early-middle-aged adults: the CARDIA study. Am J Epidemiol 2006;164:5–16.
[35]Van Den Berg JF, Van Rooij FJA, Vos H, Tulen JHM, Hofman A, Miedema HME, et al. Disagreement between subjective and actigraphic measures of sleep duration in a population-based study of elderly persons. J Sleep Res 2008;17:295–302. [36]Reyner LA, Horne JA, Reyner A. Gender- and age-related differences in sleep
determined by home-recorded sleep logs and actimetry from 400 adults. Sleep 1995;18:127–34.
[37]Ohayon MM, Carskadon MA, Guilleminault C, Vitiello MV. Meta-analysis of quantitative sleep parameters from childhood to old age in healthy individuals: developing normative sleep values across the human lifespan. Sleep 2004;27:1255–73.
[38]Kripke DF, Simons RN, Garfinkel L, Hammond EC. Short and long sleep and sleeping pills. Is increased mortality associated? Arch Gen Psychiatry 1979;36:103–16.