Original citation:
Turley, Glen A. (2012) Femoroacetabular impingement. Working Paper. Coventry: The University of Warwick.. (Unpublished)
Permanent WRAP url:
http://wrap.warwick.ac.uk/53063
Copyright and reuse:
The Warwick Research Archive Portal (WRAP) makes the work of researchers of the University of Warwick available open access under the following conditions. Copyright © and all moral rights to the version of the paper presented here belong to the individual author(s) and/or other copyright owners. To the extent reasonable and practicable the material made available in WRAP has been checked for eligibility before being made available.
Copies of full items can be used for personal research or study, educational, or not-for-profit purposes without prior permission or charge. Provided that the authors, title and full bibliographic details are credited, a hyperlink and/or URL is given for the original metadata page and the content is not changed in any way.
A note on versions:
The version presented here is a working paper or pre-print that may be later published elsewhere. If a published version is known of, the above WRAP url will contain details on finding it.
Femoroacetabular Impingement
Author:
Glen Alan Turley
Femoroacetabular Impingement: Abstract
Abstract
There is evidence that Femoroacetabular Impingement (FAI) is a major aetiologic factor in end stage Osteoarthritis (OA) of the hip, particularly in the young adult. These patients
are usually very active who suffer with persistent or intermittent groin pain. Recent
studies have found that the majority of these investigated cases have evidence of mild bone abnormalities. These deformities can occur on either the pelvic or femoral side or a
combination of both. They interact to reduce the amount of clearance between the femoral neck and acetabular rim. This results in repetitive early contact between these osseous
prominences which if left untreated will eventually progress to OA. This study reviews
the clinical presentation, diagnosis and research with regard to FAI. Significant findings include the confirmation that there are gender differences in FAI morphology as well as
a strong correlation between the clinical diagnosis of FAI with motion simulations and
the soft-tissue damage observed intra-operatively. However, it has been shown that FAI morphology is common within the normal population and presence of this morphology
alone does not necessarily mean that subjects will experience motion restriction or joint
degeneration. Consequently, the type and intensity of activity a person undertakes as well as presence of more than one radiological indication of FAI contribute to the progression
towards OA. Further, the analysis of the activities that a person with FAI undertakes must
consider the motion of the pelvis as well as the relative alignment of the femur and pelvis in the neutral posture. These factors along with the bone morphology dictate whether
impingement will occur as well as its overall severity. This should be the basis of further
development with regard to the motion analysis and simulation of FAI patients to obtain a more accurate diagnosis which the surgeon can respond to have a more effective surgical
Femoroacetabular Impingement: Contents
Contents
Abstract i
Contents ii
Glossary of Terms iii
List of Figures iv
List of Tables v
1 Introduction 1
2 Clinical presentation of femoroacetabular impingement 4
3 Diagnostic imaging 7
3.1 Femoral assessment . . . 9
3.2 Acetabular assessment . . . 14
3.3 Summary . . . 17
4 Radiographic findings 18 4.1 Femoral morphology . . . 18
4.2 Hip alignment and acetabular morphology . . . 22
4.3 Association of radiological indications with osteoarthritis . . . 25
4.4 Summary . . . 27
5 Dynamic assessment 29 5.1 Modelling the hip joint . . . 29
5.2 Range of motion simulation . . . 31
5.3 Range of motion studies . . . 33
5.4 Summary . . . 35
6 Conclusion 37
Femoroacetabular Impingement: Glossary of Terms
Glossary
APP Anterior Pelvic Plane, 15
CCD Caput-Collum-Diaphyseal, 9 CT Computer Tomographic, 7
DDH Developmental Dysplasia of the Hip, 1
FAI Femoroacetabular Impingement, 1
MR Magnetic Resonance, 7
MRA Magnetic Resonance Arthography, 7 MRI Magnetic Resonance Imaging, 7
OA Osteoarthritis, 1
SCFE Subclinical Slipped Capital Femoral Epiphysis,
1
Femoroacetabular Impingement: List of Figures
List of Figures
1.1 Illustration of joint clearance between the proximal femoral head-neck junction and
pelvic acetabular rim. . . 2
1.2 Illustration of femoroacetabular impingement (Tannast et al., 2007a). . . 3
2.1 Location and frequency of pain for patients with femoroacetabular impingement
(Clohisy et al., 2009).. . . 5
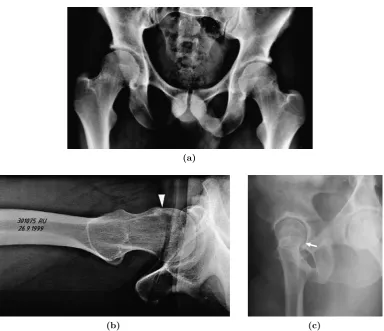
2.2 Clinical tests to assess femoroacetabular impingement (Tannast et al., 2007a). . . 6 3.1 Common radiographic projections (a)Anteroposterior radiograph - taken with the
leg in neutral flexion and internally rotated by 15o to bring the femoral neck axis
in line with the coronal plane to provide full view lateral aspect of the femoral
head-neck junction, x-ray beam parallel to the coronal plane(b)Axial cross-table
radiograph - taken in supine position with leg in neutral flexion and in either
neutral rotation or internally rotated by 15o, x-ray beam directed to the inguinal
fold(c)False profile view - to assess anterior acetabular overcoverage (Ito et al.,
2001; Maruyama et al., 2001; Neumann et al., 2009; Tannast et al., 2007a). . . 8
3.2 MR radial slices (a) Illustration of clockwise MRI slices(b) MR slice at the 3
o’clock position(c)MR slice as the 12 o’clock position (Dudda et al., 2009; Tannast
et al., 2008). . . 9
3.3 Cam pathology(a)Pistol-grip deformity (Stulberg et al., 1975)(b)Mild post-slip
deformity which shows loss of concavity of the femoral head-neck junction at point
(1) and increased concavity at point (2). . . 10
3.4 Measurement of αangle for(a)normal subjects and (b)patients with cam-type
pathology. . . 11
3.5 Measurement of osseous bump formation using(a)β angle (Wyss et al., 2007)and
(b)Triangular index (Gosvig et al., 2007). . . 13
3.6 Measurement of femoral orientation(a)Femoral anteversion (Murphy et al., 1987)
and (b)Femoral neck-shaft angle (λ) (Maruyama et al., 2001). . . 13
3.7 Diagnosis of acetabular retroversion or focal overcoverage (a) Crossover sign
(Taunton, 2007)and (b)Posterior wall sign (Laborie et al., 2011). . . 15
3.8 Diagnosis of a deep acetabulum (a) Coxa profunda and (b)Protrusio (Clohisy
et al., 2008). . . 16
3.9 Three-dimensional calculation of the acetabular angle . . . 17
4.1 Femoral head-neck offset ratio comparison(a)Symptomatic and non-symptomatic
subjects (b)Age-matched male symptomatic and non symptomatic subjects (Ito
et al., 2001). . . 19
5.1 Penetration depths of different combinations of centre edge andαangles. . . 30 5.2 Pelvic rotation in the sagittal plane during the maximal depth of squat
Femoroacetabular Impingement: List of Tables
List of Tables
4.1 Comparison of anterior αangle measurements.. . . 20 5.1 Analysis of computer simulated osseous range of motion. . . 32
Femoroacetabular Impingement: Introduction
1
Introduction
Osteoarthritis (OA) of the hip is a degenerative joint disease with diverse aetiologies (Ganz et al., 2003). The underlying causes of OA are complex with many different risk factors that
include - age, gender, race, obesity, occupation, ligamentous instability, genetic inheritance and a history of hip disorder in childhood (Goodman et al., 1997; Gosvig et al., 2007).
However, 80% of patients treated with Total Hip Arthroplasty (THA) are diagnosed with
primary or idiopathic OA which indicates that no aetiological factors can be determined (Ganz et al., 2003; Gosvig et al., 2010). Many secondary cases of OA are a result of
deformities developed or acquired as a child. These include Developmental Dysplasia of the
Hip (DDH), Legg-Calv´e-Perthes disease and Subclinical Slipped Capital Femoral Epiphysis (SCFE)(Goodman et al., 1997; Ganz et al., 2008; Leunig et al., 2009; Philippon et al., 2012).
However, a number of studies have suggested that milder deformities are a significant cause
of OA later in life (Goodman et al., 1997; Murray, 1965; Stulberg et al., 1975). Therefore, many idiopathic cases of OA can be attributed to these minor developmental deformities
which have previously been unrecognised or ignorned (Ganz et al., 2008). The collective
name for these minor deformities is Femoroacetabular Impingement (FAI)(Clohisy et al., 2010).
Today, there is more evidence that FAI is a major aetiological factor in end stage OA of
the hip, particularly in the young adult (Clohisy et al., 2010; Leunig et al., 2009; Murphy et al., 2004; Neumann et al., 2009). These patients are usually very active who suffer with
persistent or intermittent groin pain (Ganz et al., 2003; Wyss et al., 2007). This pain
is associated with damage to the hip joint cartilage and labrum which progresses to OA (Audenaert et al., 2011; Clohisy et al., 2009). Although this damage can occur in isolation,
recent studies have found that the majority of the investigated cases have evidence of mild
bone abnormalities (May et al., 2007; Peelle et al., 2005; Wenger et al., 2004; Wyss et al., 2007). These deformities can occur on either the pelvic or femoral side or a combination
of both and involve minor variations in the orientation and shape of the acetabulum or femoral head-neck junction (Buller et al., 2012; Guanche and Bare, 2006; K¨ohnlein et al.,
2009). These minor morphological abnormalities reduce the amount of clearance between
the femoral neck and acetabular rim, as Figure 1.1 shows (Kubiak-Langer et al., 2007). This results in repetitive early contact between these osseous prominences particularly
during end range of motion activities which cause both labral and prearthritic chrondral
damage which if left untreated eventually progresses to OA (Almoussa et al., 2011; Tannast et al., 2007b). The combination of repetitive microtrauma which occur during end range
of motion make the young active adult vulnerable to early OA of the hip (Guanche and
Femoroacetabular Impingement: Introduction
Figure 1.1: Illustration of joint clearance between the proximal femoral head-neck junction and pelvic acetabular rim.
FAI has been categorised into cam, pincer and mixed-type morphologies. Cam-type FAI
occurs on the femoral side and appears as a cam-shaped abnormality at the femoral head-neck junction (Audenaert et al., 2011; Neumann et al., 2009). Cam impingement is caused
by jamming this aspheric portion of the femoral head into the acetabulum (Ganz et al.,
2008; Tannast et al., 2008). It typically occurs during flexion combined with additional rotation of the hip which induces compression and shear stresses at the labrum-cartilage
junction and at the subchrondral bone of the acetabulum (Arbabi et al., 2010; Audenaert
et al., 2011; Neumann et al., 2009). The ability of the cam-type prominences to intrude into the hip joint rather than abut against the acetabular rim means that they have a
particularly destructive effect (Audenaert et al., 2011; Ganz et al., 2008). Damage typically
occurs on the acetabular side in the anterosuperior quadrant and is often seen in young athletic males (Cobb et al., 2010; Ganz et al., 2003).
Pincer FAI occurs on the acetabular side and appears as either a focal or a general
overcoverage of the femoral head by the acetabulum (Cobb et al., 2010; Tannast et al., 2007b). A focal overcoverage is caused by a retroverted acetabulum while a general
overcoverage is the result of a deep acetabulum (Beck et al., 2005; Pfirrmann et al., 2006).
In end range of motion activities this overcoverage causes early abutment of the femoral neck against the acetabular rim (Audenaert et al., 2011; Ganz et al., 2008). This leverage
effect causes anterior labral damage and posterior wear which is typically less extensive than cam-type impingement (Cobb et al., 2010; Ganz et al., 2008; Neumann et al., 2009).
Femoroacetabular Impingement: Introduction
[image:10.595.114.540.122.264.2](a) Normal hip joint. (b) Cam-type impingement. (c) Pincer-type impingement.
Figure 1.2: Illustration of femoroacetabular impingement (Tannast et al., 2007a).
women who perform high demand activities (Ganz et al., 2008). It has traditionally been regarded that isolated cam-type or pincer type impingement is rare, most patients will
have a combination of these two conditions (Ganz et al., 2008; Neumann et al., 2009). However, recent studies have regarded these two mechanisms to be distinct (Cobb et al.,
2010; Laborie et al., 2011). Figure 1.2 illustrates a normal hip joint in contrast to hips
Femoroacetabular Impingement: Clinical presentation
2
Clinical presentation of femoroacetabular impingement
Treatment of FAI can be difficult as the onset of symptoms are often subtle and unnoticed by the patient (Arbabi et al., 2010; Murphy et al., 2004). Initially, they notice limited range
of motion during sporting activities - such as skiing or swimming (Tannast et al., 2007a; Wyss et al., 2007). It is only when they are regularly participating in sports, particularly
stop and go activities like soccer, hockey, hand ball and tennis that there is a slow onset of
groin pain which typically starts after minor trauma (Ganz et al., 2003; Wyss et al., 2007). Patients will experience pain intermittently at first, typically after sporting activities or
being seated for a prolonged period (Ganz et al., 2003; Tannast et al., 2007a). Patients
will then seek medical consultation presenting with a degree of functional impairment in conjunction with groin pain (Jung et al., 2011; Leunig et al., 2009). There are other
pain and functional symptoms such as trochenteric pain radiating in the lateral thigh or
experiencing pain when putting on ones shoes (Clohisy et al., 2009; Tannast et al., 2007a). Figure 2.1 shows the typical location and frequency of pain for patients with FAI.
A recent study by Gosvig et al. (2010) analysed the responses given by 3,620 subjects
(1,332 male, 2,288 female) to the question “have you experienced frequent or recurrent deep deep pain in the groin during the last 12 months?”. It was found that it was not only subjects with FAI that experienced groin pain but also patients with developmental
abnormalities such as DDH and those patients without any malformations. In fact, patients with hip abnormalities did not have higher incidence of groin pain compared with normal
hips. This the author’s suggest shows that groin pain is a limited predictor of hip joint
malformation, making prompt diagnosis difficult (Gosvig et al., 2010). Clohisy et al. (2009) found that patients had to wait on average three years, seeing on average 4.2 healthcare
providers, before a correct diagnosis of FAI was made. This is because the symptoms
overlap with other abnormalities of the hip and lumbar spine (Arbabi et al., 2010; Clohisy et al., 2009). There is one clinical examination that has been shown to be well correlated
with a diagnosis for FAI and that is to test for the impingement sign. 88% to 99% of patients diagnosed with FAI have a positive impingement sign (Clohisy et al., 2009; Leunig
et al., 1997; Philippon et al., 2007). Anterior FAI, where impingement typically occurs in
the anterosuperior quadrant of the acetabulum can be diagnosed upon physical examination if there is reproducible pain when the hip is flexed at 90o and then internally rotated or
both internally rotated and sligtly adducted (Tannast et al., 2007a; Lamontagne et al.,
2009). Forced internal rotation induces shearing forces at the labram which creates pain at the site of the labral or chondral lesion (Ganz et al., 2003). This recreates the pain
experienced during daily activities for patients with cam-type impingement. Forced flexion
Femoroacetabular Impingement: Clinical presentation
Figure 2.1: Location and frequency of pain for patients with femoroacetabular impingement (Clohisy et al., 2009).
labrum in the anterosuperior rim of the acetabulum (Dudda et al., 2009; Lamontagne et al.,
2009).
Occasionally with pincer-type FAI there is posteroinferior impingement where the femoral neck leverages on the front of the acetabulum causing posterior wear in what it known
as the contre-coup lesion (Cobb et al., 2010; Ganz et al., 2008). This can be recreated by
externally rotating the leg in extension giving rise to deep seated groin pain (Tannast et al., 2007a). If while flexing the leg there is unavoidable passive external rotation this indicates
presence of a SCFE in what is known as a positive Drehmann sign (Kamegaya et al., 2011;
Tannast et al., 2007a). Figure 2.2 provides an illustration of these clinical tests.
FAI as a clinical diagnosis is estimated to exist within 10-15% of the adult population
(Laborie et al., 2011; Tannast et al., 2007a). Typically they tend to be highly active with
over 50% participating in regular sporting activities and 29% characterising their activity level as high (Clohisy et al., 2009). This indicates that high demand activity is a risk
factor for the development of symptomatic FAI (Clohisy et al., 2009; Ito et al., 2001).
Consequently, there may be many more people with subtle bone abnormalities that remain asymptomatic because they do not routinely participate in activities that demand forced
flexion and internal rotation (Wyss et al., 2007). Further there may be some activities that
require great flexibility and consequently are unsuitable for individuals with mild or severe deformities (Wyss et al., 2007). In addition, subjects may also be symptomatic but may not
Femoroacetabular Impingement: Clinical presentation
[image:13.595.126.527.117.308.2](a)Anterior impingement. (b) Posteroinferior impingement. (c) Drehmann’s sign.
Figure 2.2: Clinical tests to assess femoroacetabular impingement (Tannast et al., 2007a).
ballet dancer (Tannast et al., 2007a). The link of activity with symptomatic FAI explains
why patient’s will fail conservative treatment. FAI is a mechanical problem therefore
conservative treatments such as anti-inflammatory medications and activity modifaction will not eliminate the source (Guanche and Bare, 2006). In a number of cases where
restricted range of motion is being treated by stretching. Patients with FAI will often fail
this treatment approach and may even come to harm (Guanche and Bare, 2006; Wyss et al., 2007).
After clinical examination where the patient exhibits a positive impingement sign there are
Femoroacetabular Impingement: Diagnostic imaging
3
Diagnostic imaging
There are a number of imaging modalities that can be use to diagnose and assess FAI. Radiographs are used to make an assessment of the femoral head-neck junction and the
contour of the acetabular rim (Laborie et al., 2011). Magnetic Resonance Imaging (MRI) or more typically Magnetic Resonance Arthrography (MRA) is used to assess soft tissue
damage (Leunig et al., 2004; Siebenrock et al., 2003). However, both Magnetic Resonance
(MR) and Computer Tomography (CT) imaging are now being used to gain a three-dimensional understanding of the bone (Beaul´e et al., 2005; Jung et al., 2011). It has
been acknowledged that radiographs cannot assess the full extent of the aspherity of the
femoral head-neck junction as its maximum aspheric deviation occurs in the anterosuperior quadrant which is common blindspot radiologically (Leunig et al., 2009; Jung et al., 2011).
Dudda et al. (2009) found in their study that asphericity of the femoral-neck junction when
assessed radiographically would have been underestimated in 34.6% of cases. However, there are still drawbacks with both MR and CT imaging. CT requires a rather high dose
of radiation and can only provide a suitable evaluation of the bony anatomy (Leunig et al.,
2009). While MRA is accurate at assessing the integrity of the labrum, for identification of adjacent acetabular cartilage disorders it is less reliable (Heyworth et al., 2012; Siebenrock
et al., 2003). However, future developments in MR technology may add to the image
quality particulary for visualisation of the bony contour, cartilage lesions and capsular adhesions (Leunig et al., 2009).
There are a number of common radiographic projections which are use to diagnose FAI,
Figure 3.1. Among these views, the standard projections are the Anteroposterior (AP) radiograph and the Axial Cross-Table radiograph (Tannast et al., 2007a). The AP projection
provides a view of the lateral femoral head-neck junction while the cross-table view provides
a view of the anterior aspect of the hip joint (Ganz et al., 2008). A frog-leg radiograph is another projection which is commonly used to assess the lateral aspect of the femoral
head-neck junction as well as the focal prominence of the acetabular rim (Laborie et al., 2011). An alternative to the cross-table view is the Dunn-Rippstein projection which is
taken with the leg flexed to 45o to show the anterior of the femoral head-neck junction
(Tannast et al., 2007a). A false-profile view is occasionally used to assess anterior acetabular over-coverage (Tannast et al., 2007a). In summary, a lateral and anterior view of the
femoral head-neck junction and acetabular rim is sought. These radiographs first allowed a
number of measurements to be made to assess the extent of the bone abnormality, such as centre-edge angle, acetabular centre margin angle, femoral head coverage, acetabular index,
Femoroacetabular Impingement: Diagnostic imaging
(a)
[image:15.595.135.520.212.543.2](b) (c)
Figure 3.1: Common radiographic projections(a)Anteroposterior radiograph - taken with the leg in neutral flexion and internally rotated by 15oto bring the femoral neck axis in line with the
coronal plane to provide full view lateral aspect of the femoral head-neck junction, x-ray beam parallel to the coronal plane(b)Axial cross-table radiograph - taken in supine position with leg in neutral flexion and in either neutral rotation or internally rotated by 15o, x-ray beam directed to
Femoroacetabular Impingement: Diagnostic imaging
[image:16.595.129.528.116.264.2](a) (b) (c)
Figure 3.2: MR radial slices(a)Illustration of clockwise MRI slices(b)MR slice at the 3 o’clock position(c)MR slice as the 12 o’clock position (Dudda et al., 2009; Tannast et al., 2008).
As well as radiographic projections, there are also common CT and MR views. For instance,
the coronal scout view provides an image which corresponds to a lateral radiograph and is parallel to the axis of the femoral neck which passes through the centre of the femoral
head (Notzli et al., 2002). However, both imaging modalities have the ability to provide
non-standard radial sequences where images are taken about the femoral neck axis in both orthogonal and oblique planes as Figure 3.2 show (Dudda et al., 2009; Rakhra et al., 2009).
An overview of the image modalities used to diagnose FAI has been provided. Sections
3.1 and 3.2 will now provide an overview of the clinical measurements taken using these modalities to assess the extent of the bone abnormality for both the proximal femur and
acetabulum.
3.1 Femoral assessment
There are number of radiological and imaging measures used to diagnose a cam-type
deformity or assess its severity. These measurements include the α angle,β angle, anterior offset and triangular index (Gosvig et al., 2007; Ito et al., 2001; Notzli et al., 2002; Wyss et al., 2007). These measurements are used to quantify osseous bump formation on the
femoral head-neck junction whose appearance signifies cam pathology (Tannast et al.,
2007a). The orientation of the proximal femoral neck can also cause cam-type impingement which is assessed using the traditional anatomical measurements of the
Caput-Collum-Diaphyseal (CCD) angle or neck-shaft angle and femoral anteversion (Murphy et al., 1987;
Widmer and Majewski, 2005).
Theα angle is perhaps the most widely used measure to assess the extent of the osseous bump formation at the femoral head-neck junction. It was defined by Notzli et al. (2002)
Femoroacetabular Impingement: Diagnostic imaging
[image:17.595.179.471.121.306.2](a) (b)
Figure 3.3: Cam pathology(a)Pistol-grip deformity (Stulberg et al., 1975)(b)Mild post-slip deformity which shows loss of concavity of the femoral head-neck junction at point (1) and increased concavity at point (2).
1975) and ‘post-slip’ (Goodman et al., 1997) which had been used previously to describe the osseous bump formation in pathological cam-type impingement. Stulberg et al. (1975)
described a flattened femoral head-neck junction seen on AP radiographs being present
in 40% of patients who develop OA of the hip. Goodman et al. (1997) also described a flattened femoral head-neck junction but in the anterior aspect of the proximal femur
which AP views may miss. This flattened morphological shape in both cases is thought
to be characteristic of a silent post-slipped capital femoral epiphysis (Ganz et al., 2008; Goodman et al., 1997). Figure 3.3 shows the loss of concavity of the femoral head neck
junction in both the superior and anterior aspects and is why both AP and axial cross-table
radiographs are taken to diagnose FAI (Tannast et al., 2007a).
Notzli et al. (2002) compared 39 patients with symptomatic groin pain with 35 asymptomatic
control subjects. The purpose of the original study was to confirm that young patients
with clinical signs of impingement also had shape abnormalities at the anterior of the femoral head-neck junction (Notzli et al., 2002). Therefore, axial MRI images were acquired
whereby the projection image was adjusted to be parallel to the individual patient femoral
neck axis passing through the centre of the femoral head. This oblique axial plane was defined using a coronal scout view whereby the angle of the femoral neck axis could be
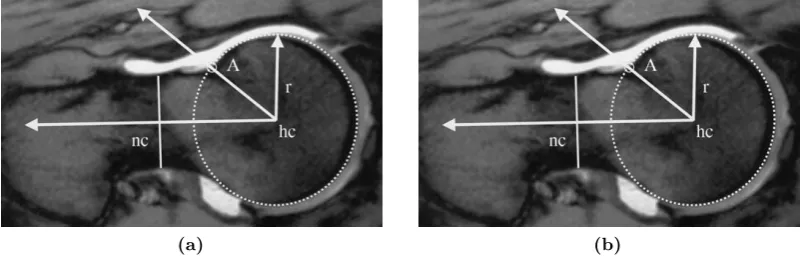
defined (Notzli et al., 2002). Figure 3.4, shows the measurement of the α angle using the axial MRI image. Using this figure, theα angle is measured from a line (nc-hc) defined by the centre of the femoral neck at its narrowest point and the femoral head centre (hc) to a
Femoroacetabular Impingement: Diagnostic imaging
[image:18.595.125.528.121.249.2](a) (b)
Figure 3.4: Measurement of αangle for (a)normal subjects and (b) patients with cam-type pathology.
that hips with a deformity of the femoral head neck junction have a large α angle. This will be discussed further in section 4 (Jung et al., 2011; Neumann et al., 2009; Notzli et al.,
2002).
The measurement of α angle described by Notzli et al. (2002) assessed the severity of the anterior femoral head-neck deformity which was measured in an oblique axial plane.
However, both Gosvig et al. (2007) and Jung et al. (2011) measured α angle in the coronal plane using AP radiographs and coronal scout CT images respectively. These studies confirmed the presence of osseous bump or ‘pistol grip’ formation in this view.
The studies of Dudda et al. (2009) and Rakhra et al. (2009) measuredα angle using the radial images as illustrated in Figure 3.2. Both studies found that the maximum α angle occurs anterosuperiorly in the 1 o’clock to 2 o’clock position (Dudda et al., 2009; Rakhra
et al., 2009). Therefore, three-dimensional assessment is more sensitive in assessing FAI
than using plain radiographs, coronal scout views or oblique axial images alone. Dudda et al. (2009) found that asphericity of the femoral head-neck junction would have been
underestimated in 34.6% of patients. Rakhra et al. (2009) found that 54% of subjects with
a non-pathologicalαangle in the oblique axial plane were in fact pathologic when measured in a radial plane. Consequently, a substantial portion of subjects with a seemingly normal
femoral head-neck contour may in fact be pathogical (Rakhra et al., 2009).
Both Beaul´e et al. (2005) and Wyss et al. (2007) have described β angle measurement. These are two different types of measurement. In the Beaul´e et al. (2005) definition the β
angle is a mirror image of theαangle whereby it assesses posterior concavity of the femoral head-neck junction as opposed to the anterior concavity. Using Figure 3.3b, cam-type
impingement causes a loss of anterior concavity shown at point 1 and an increase in posterior
Femoroacetabular Impingement: Diagnostic imaging
angle alone. However, these measurements were performed using planar reformation of the axial oblique plane using CT imaging. In three-dimensional imaging the β angle would be the α angle measurement for the posterior radial slice. However, the ratio can still be applied in the diagnosis of FAI.
Wyss et al. (2007) used the term β angle to describe the clearance between the femoral head-neck junction and the acetabular rim. It therefore considers the effect of both
cam-type and pincer-cam-type morphology. This angle was measured in an axial plane where the space between the acetabular rim and the femoral neck was at its smallest. The β angle as defined by Wyss et al. (2007) is shown in Figure 3.5a. Similar to the α angle point C represents the point where the concavity of the anterior femoral head is lost, while point D is the lateral bony margin of the acetabulum (Wyss et al., 2007). The angle
formed between the lines (hc-C) and (hc-D) is defined as the β angle. The measured β
angle is dependent upon the relative orientation of the proximal femur with regard to the acetabulum. Consequently, its result will change in accordance to the posture of the
subject. Wyss et al. (2007) used this to determine whether clinically replicated groin pain when the hip is flexed at 90o and then internally rotated correlated with small β angle clearance when the hip was flexed at 90o. This will be discussed further in section 4.
Gosvig et al. (2007) extended the findings of Notzli et al. (2002) with regard to their measurement of both αangle and offset to develop the triangular index. The measurement of the triangular index is shown in Figure 3.5b where (r) is the natural radius of the
femoral head. At a distance r/2 along the femoral neck axis, the distance (H) is measured
perpendicularly from the femoral neck axis to the border of the femoral head neck junction.
The radius (R) from this point to the centre of the femoral head (hc) can be calculated
using Pythagoras theorem for right handed triangles (a2+b2 =c2). Consequently, if (R) is greater than (r) than this represents a loss of concavity of the femoral head-neck junction
symptomatic of cam impingement. Gosvig et al. (2007) found that the α angle and the triangular index were highly inter-related. However, the α alpha was more sensitive to the internal/external rotation of the femur, where as the triangular index value remains
relatively unaltered with rotation of the femur.
The final measurement used to assess the extent of osseous bump formation is femoral offset. There are a number of definitions of femoral offset (Eijer et al., 2001; Ito et al., 2001;
Notzli et al., 2002). These methods quantify the linear distance between the femoral neck radius and the femoral head radius and has been measured on AP and lateral crosstable
radiographs (Beck et al., 2005; Tannast et al., 2007a). Ito et al. (2001) extended this
method to take points around the femoral head and neck circumference.
As well as measurements which quantify the osseous bump formation on the femoral
Femoroacetabular Impingement: Diagnostic imaging
[image:20.595.127.511.123.280.2](a) (b)
Figure 3.5: Measurement of osseous bump formation using(a)β angle (Wyss et al., 2007)and (b)Triangular index (Gosvig et al., 2007).
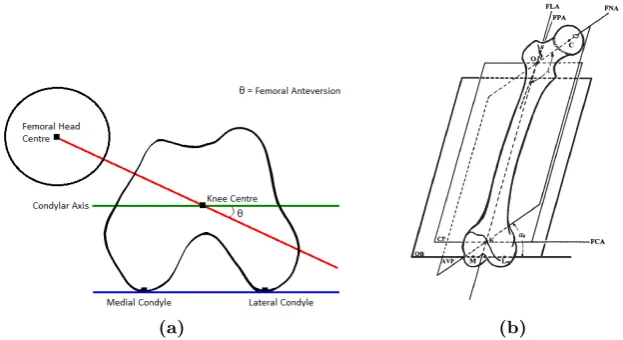
orientation of the femur is defined by measurement of femoral anteversion and neck-shaft
angle. Femoral version, in a joint coordinate frame is regarded to be the angle between the
femoral neck axis and the coronal plane (Ko and Yoon, 2008; Seki et al., 1998; Yoshimine, 2006). It has been defined clinically by Murphy et al. (1987) as the angle between the
femoral neck axis and an axis parallel to the posterior aspect of the femoral condyles,
measured in the transverse plane. This axis is known as the condylar axis and is shown in Figure 3.6a. The condylar axis is used to define the neutral rotation of the femur.
Therefore, it is coincident with the coronal plane of the hip joint (Maruyama et al., 2001).
The femoral neck-shaft angle is defined as the angle between the femoral neck axis and the longitudinal axis of the femur, shown as symbol λin 3.6b (Maruyama et al., 2001).
(a) (b)
Figure 3.6: Measurement of femoral orientation(a)Femoral anteversion (Murphy et al., 1987)
[image:20.595.170.482.516.686.2]Femoroacetabular Impingement: Diagnostic imaging
3.2 Acetabular assessment
Similar to cam-type impingement there are a number of radiological measurements which
are used to diagnose and assess pincer morphology. As discussed in section 1 pincer-type impingement occurs when there is direct linear abutment between the proximal femoral
neck and the acetabular rim, which is caused by either a focal or generally overcovered
acetabulum (Beck et al., 2005; Neumann et al., 2009). It is hypothesised that this is a result of an unrecognised mild developmental dysplasia which causes acetabular cartilage
damage in a thin circumferential strip adjacent to the labrum as well as the contre-coup lesion (Ganz et al., 2008; Tannast et al., 2007a). Focal overcoverage is thought to be a
result of acetabular retroversion where the anterolateral edge of the acetabulum obstructs
motion (Siebenrock et al., 2003). A globally overcovered acetabulum is a result of a deep acetabulum diagnosed as protrusio acetabuli or coxa profunda (Gosvig et al., 2010;
Neumann et al., 2009). In both cases the leverage effect caused by early abutment means
that pincer hips typically fail toward a posteroinferior of central OA (Ganz et al., 2008).
Both focal and global overcoverage in pincer-type impingement is principally diagnosed
from AP radiographs using two measures - the crossover sign and the posterior wall sign
(Laborie et al., 2011; Siebenrock et al., 2003). Clohisy et al. (2008) stated that the presence of the crossover sign in combination with a deficient (positive) posterior wall sign was
indication of acetabular retroversion, while the presence of the crossover sign alone indicated
anterior overcoverage. A prominent posterior wall (negative sign) is generally seen with coxa profunda or protrusio acetabuli in a globally overcovered acetabulum. However, it can
appear in isolated cases of posterior focal overcoverage, as opposed to the more common
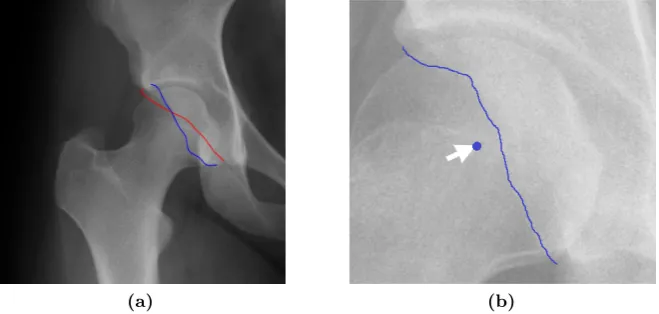
anterior overcoverage (Tannast et al., 2007a). A positive crossover sign occurs when the anterior acetabular rim border is more lateral than the posterior rim in the cranial part of
the acetabulum (Cobb et al., 2010; Tannast et al., 2008). In normal cases the outline edges
of the anterior and posterior wall borders should meet superiorly and laterally (Taunton, 2007). However, the crossover sign appears when the anterior border crosses over the
posterior border medial to the lateral edge of the acetabulum (Beck et al., 2005; Taunton, 2007). Considering the posterior wall sign, in a normal hip the posterior wall border should
descend through the centre of the femoral head (Tannast et al., 2007a). If the posterior rim
border lies medially to the centre of the femoral head, then this is indication of a deficient posterior wall (Clohisy et al., 2008). Both a positive crossover and posterior wall sign are
shown in 3.7.
Global overcoverage is diagnosed on an AP radiograph by either coxa profunda or protrusio acetabuli which indicates a deep acetabulum (Tannast et al., 2007a). The degree of
overcoverage can be quantified using the lateral centre edge angle, anterior centre edge
Femoroacetabular Impingement: Diagnostic imaging
[image:22.595.162.492.121.278.2](a) (b)
Figure 3.7: Diagnosis of acetabular retroversion or focal overcoverage(a)Crossover sign (Taunton, 2007)and (b)Posterior wall sign (Laborie et al., 2011).
are traditional measures which have been used in the assessment of acetabular dysplasia
(Clohisy et al., 2008). A coxa profunda is diagnosed using an AP radiograph when the
floor of the acetabulum touches or overlaps the ilioischial line medially (Beck et al., 2005). A protrusio is diagnosed when the femoral head overlaps the ilioischial line medially (Beck
et al., 2005). Both these cases are shown in Figure 3.8, a normal hip will have the acetabular
fossa lying laterally to the ilioischial line (Tannast et al., 2007a).
The lateral centre edge angle is one of the predominant methods of quantifying acetabular
overcoverage. The angle is formed by a vertical line and a line which connects the centre of
the femoral head with the lateral edge of the acetabulum. If the angle is greater than 39o then the hip is overcovered, if it is less than 25o the hip is dysplastic (Tannast et al., 2007a).
The anterior centre edge angle is calculated using a false profile view in the same manner
as the lateral centre edge angle (Clohisy et al., 2008). The femoral head extrusion index determines the percentage of the femoral head which is not covered by the acetabulum
and should normally be less than 25% (Tannast et al., 2007a). Finally, the T¨onnis angle is the angle formed on an AP radiograph between a horzontal line drawn from the inferior
sourcil and a line connecting the interior sourcil with the lateral sourcil (Clohisy et al.,
2008). In a normal hip this angle should be between 0o and 10o but in hip with coxa profunda or protrusio it is 0o or negative (Clohisy et al., 2008; Tannast et al., 2007a). These
measurements are very dependent upon pelvic orientation as the vertical and horzontal
lines used as the datums from which to calculate many of these angles should be aligned with an anatomical axis (K¨ohnlein et al., 2009; Siebenrock et al., 2003).
CT imaging has allowed the coverage of the acetabulum to be quantified in three-dimensions
Femoroacetabular Impingement: Diagnostic imaging
[image:23.595.121.533.120.279.2](a) (b)
Figure 3.8: Diagnosis of a deep acetabulum(a)Coxa profundaand (b)Protrusio (Clohisy et al., 2008).
rim of the acetabulum and best-fitting a plane to these points, known as the acetabular
rim plane (Cobb et al., 2010). The normal to this plane is defined as the polar axis and
is located at the hip joint centre. This polar axis can be used to define the acetabular inclination and anteversion relative to the pelvic coordinate frame typically derived from
the Anterior Pelvic Plane (APP) using the definitions of Murray (1993). The hip joint
centre is the centre of a best-fit sphere formed from points taken from the articular surface of the acetabulum (Cobb et al., 2010). The coverage angle is the angle between the polar
axis pointing medially from the hip joint centre and a line joining the hip joint centre with
an individual acetabular rim point (Cobb et al., 2010; Murphy et al., 1990). A rim point is hemispherical when it is 90o, undercovered when it is less than 90o and overcovered
when it is greater than 90o (Murphy et al., 1990). These rim points are then transferred
to a clockface for visualisation. Figure 3.9 illustrates the calculation of this acetabular coverage angle. However, as K¨ohnlein et al. (2009) identifies, the rim of the acetabulum
is shaped in a regular wave form with three consistent prominences and two depressions. Consequently, the acetabular rim plane is artificial which may affect interpretation of the
Femoroacetabular Impingement: Diagnostic imaging
Figure 3.9: Three-dimensional calculation of the acetabular angle
3.3 Summary
This section has reviewed the predominant diagnostic measurements used to describe
both the osseous abnormality and orientation of the acetabulum and femur. This will
aid the analysis of the skeletal, radiographic, CT and MR studies which will be discussed in the following section. One of the most important factors that has arisen through
the documentation of the various diagnostic measurements is the disconnect between
two-dimensional and three-dimensional imaging. The various projection planes result in different interpretations of the diagnostic measurements and should be considered when
analysing clinical studies. Many of the clinical studies discussed in the following section
also consider the degree of OA that is evident in the joint. Predominantly, the degree of OA is evaluated using the T¨onnis Grade (Clohisy et al., 2008).
Grade 0: No radiological sign of OA.
Grade 1: Increased sclerosis of the head and acetabulum, slight jointspace narrowing, and slight lipping at the joint margins.
Grade 2: Small cysts in the head or acetabulum, moderate joint-space narrowing, and moderate loss of sphericity of the head.
Femoroacetabular Impingement: Radiographic findings
4
Radiographic findings
There have been a number of studies which have studied FAI morphology using standard radiographs, MR, CT as well as skeletal studies. This section will present the findings
of these studies, which include assessment of osseous morphology and evaluation of joint degeneration. Firstly, femoral morphology will be discussed, followed by acetabular
morphology and hip alignment. Finally, the link between abnormal hip morphology and
OA will be considered.
4.1 Femoral morphology
One of the first quantitative studies which evaluated femoral morphology was the skeletal
study of Goodman et al. (1997). The authors visually evaluated 2665 skeletons (2227
males, 438 females) for evidence of post-slip morphology, a total of 5330 hips. The study found that 306 (5.7%) of the femora analysed had evidence of a mild post-slip morphology,
only 21 (0.4%) hips had a moderate or severe slippage. When comparing these 306 femora with age-matched femora with no evidence of post-slip morphology, significantly more of
the mild post-slip femora (38% compared to 26%) had grade two or three OA (p-value
≤ 0.005). This difference was more pronounced in individuals aged 56 or older - 68% post-slip compared to 48% normal (p-value ≤0.025). The results of this study was one of the first to show that mild shape abnormalities of the proximal femur have an elevated risk
of developing OA in comparison to normal hips. These mild post-slip abnormalities have the same epidemiological characteristics of femora associated with SCFE (Goodman et al.,
1997).
Prior to the study of Notzli et al. (2002) which defined the radiological α angle mea-surement, Ito et al. (2001) sought to characterise the distribution and location of the
osseous abnormality on the femoral head-neck junction. The authors used MR imaging
and constructed a sagittal oblique plane with a view projecting along the femoral neck axis. Consequently, two sections were taken, one of the femoral head and the other of the
femoral neck. Femoral head-neck offset was calculated using radial sections around these
two planar images - comparing 24 (12 male, 12 female) symptomatic patients exhibiting a positive impingement sign with 24 asymptomatic volunteers. Femoral head-neck offset
was significantly less within the patient group in the anterior to medial quadrant (p-value
≤ 0.05). Further, younger men had significantly less head-neck offset in the lateral and anterior aspects in comparison to age and gender match control subjects, particularly in
Femoroacetabular Impingement: Radiographic Findings
[image:26.595.122.530.125.263.2](a) (b)
Figure 4.1: Femoral head-neck offset ratio comparison(a)Symptomatic and non-symptomatic subjects(b)Age-matched male symptomatic and non symptomatic subjects (Ito et al., 2001).
impingement can only take place at a specific point in the arc of flexion which mean that
both the level and type of activity play a role in the development of OA (Ito et al., 2001)
Siebenrock et al. (2004) assessed femoral head-neck offset in conjunction with measurement
of epiphysial extension. The purpose was to assess the correlation between these two
measurements, which if positive would support the hypothesis that decreased head-neck offset might be caused by a growth abnormality of the capital epiphysis. 15 patients with
a hump malformation, normal acetabulum and a positive impingement sign were assessed
in conjunction with 15 normal subjects. On comparison of the patient and the control groups there was a significantly decreased head-neck offset in the patient group. Patients
also showed a significantly larger extension of the epiphysis onto the neck in this quadrant.
These two measurement had a very high correlation coefficient supporting the hypothesis that a decreased head-neck offset is caused by a growth abnormality of the capital epiphysis.
The study by Notzli et al. (2002) was the first to define and measure the α angle using an oblique axial view to measure the aspherity of anterior aspect of the femoral head-neck junction. Beaul´e et al. (2005) measured both theα and β angle in the same oblique axial plane to assess the aspherity of both the anterior and posterior aspects of the femoral head. Neumann et al. (2009) used cross-table radiographs to measure aspherity of the anterior
aspect of the femoral head. Consequently, the α measurements of these studies can be compared in Table 4.1.
Theαangle measurements are consistent among studies for both symptomatic and asymp-tomatic subjects. Neumann et al. (2009) has identified that since the study by Notzli et al.
(2002), 55o has been wrongly interpreted as the upper limit that allows for impingement free motion (Kubiak-Langer et al., 2007; Meyer et al., 2006). Neumann et al. (2009) also
Femoroacetabular Impingement: Radiographic Findings
Study Symptomatic (αangle) Asymptomatic (αangle) p-value
Notzli et al. (2002) 74o(55o-95o) 42o(33o-48o) p≤0.001
[image:27.595.120.530.111.166.2]Beaul´e et al. (2005) 66.4o, (39o-94o) 43.8o(39.3o-48.3o) p = 0.001 Neumann et al. (2009) 66o(45o-79o)
Table 4.1: Comparison of anterior αangle measurements.
femoral head abnormality but also acetabular morphology, there is an interactive effect
between the two. Therefore, in a normal hip an anteriorα angle of 43o may be sufficient for impingement free motion but in hips with a deep acetabulum it may be necessary to have anα angle of less than 43o. The results of Neumann et al. (2009) also showed that the α angle remained stable one year after surgery - post-operatively 43o (34o-60o) and at one year follow-up 41o (34o-51o). In the study by Beaul´e et al. (2005) they also noted that as well as the α angle being significantly larger in the patient group when compared to the asymptomatic control. In contrast, the β angle was significantly smaller in the patient group (mean 40.2o) compared to the control group (mean 43.8o). This agrees with the findings of Goodman et al. (1997) who found evidence that in a post-slip morphology there
is a loss of concavity at the anterior of the femoral head-neck junction and an increase in
concavity at the posterior of this junction, Figure 3.3b. Other notable findings were that the α:β ratio was more sensitive at diagnosing cam-impingement thanα angle alone (81% compared to 72%) and that there was no correlation between age andα angle. It was also noted that within the symptomatic group males had a greater αangle than females - 73.3o compared with 58.7o. However, within the control group no such difference existed (Beaul´e et al., 2005).
There are a number of studies which have used theα angle to quantify the aspherity of the femoral head-neck junction in the coronal plane using AP radiographs, thus evaluating
pistol-grip morphology. Gosvig et al. (2007) analysed AP weight bearing radiographs of 2803 subjects (1055 male, 1748 female) in a population study. The authors found significant
gender differences - the mean α angle for males was 52.4o (30o-100o) for females it was 44.5o (32o-108o). This was supported by detection of a hump malformation in 10% of males and only 2% of females. Consequently, the following pathological boundaries were defined:
male - pathological (α ≥83o), borderline (69o ≥ α ≤82o) and normal (α ≤68o), female - pathological (α ≥ 57o), borderline (51o ≥α ≤56o) and normal (α ≤ 50o). As well as a population study, Gosvig et al. (2007) also compared the α angle measurements in the coronal and axial views of 164 (82 male, 82 female) THA patients. For males the α angle was greater in the superior region 71o (40o-114o) compared to 61o (30o-110o) at the anterior. For females this difference was less pronounced - AP plane 59o (39o-103o) compared to
Femoroacetabular Impingement: Radiographic Findings
primarily a male condition. The study by Gosvig et al. (2007) is supported by the results presented by Jung et al. (2011) who assessed the prevalence of morphological abnormalies in
asymptomatic adults. Jung et al. (2011) found that males had both a significantly greater
α angle (59o compared to 45o) and a greater number of pathological (13.95% compared to 5.56%) and borderline (14.88% compared to 6.11%) cases in comparison to females (p-value
≤ 0.001). However, there were no significant differences in α angle between age groups within each gender challenging the assumption that FAI deformity develops over time.
Laborie et al. (2011) also assessed the prevalence of cam-type FAI in 60 eligible
asymp-tomatic young adults (868 male, 1192 female) using lateral views of the hip. There were
three indications of cam-type morphology - pistol grip (21.5% male, 3.3% female), focal prominence of the femoral neck (10.3% male, 2.6% female) and flattening of the lateral
aspect of the femoral head (14.4% male, 6.2% female). Evidence of one of more of these
cam features was shown in 304 males (35.0%) and 121 females (10.2%). This is similar to the number of borderline and pathological cases found in the study by Jung et al. (2011).
This shows that the presence of asymptomatic cam-type deformity is not a rare condition especially within a healthy adolescent population (Laborie et al., 2011). Consequently, an
abnormalα angle does not hold an absolute relationship with the presence of symptomatic disease (Jung et al., 2011).
The variation in the magnitude of theα angle around the circumference of the femoral head-neck junction has led researchers to take radial sections around the femoral head,
as discussed in section 3.1. Pfirrmann et al. (2006) as part of their study measured the
α angle at 8 radial sections around the femoral head in 50 patients (30 male, 20 female) average age 28.8 years (19-48). Of the 50 patients there were 33 patients diagnosed with
cam impingement and 17 with pincer impingement. It was found that the α angle was significantly larger in the cam impingement group in the anterior (68o compared to 54o) and
anterosuperior (81ocompared to 66o) regions compared to the pincer group. Findings in the
anterior region are consistent with those values presented in Table 4.1. However, theαangle was more pronounced in the anterosuperior region. These findings have been supported by
both Dudda et al. (2009) and Rakhra et al. (2009) who both found that the maximumα
angle occurred in the anterosuperior region. Consequently, many patients found not to be pathological using the traditional axial oblique plane and 55o α angle limit were in fact pathological when radial images were analysed. As well as documenting measurements of
femoral head-neck morphology in both symptomatic patients and asymptomatic subjects, other studies have looked at the damage patterns associated with cam-type impingement.
Beck et al. (2005) analysed 26 (24 male, 2 female) pure pistol-grip deformities with damage to the labral, acetabular and femoral head cartilage, evaluated after surgical dislocation
of the hip. In the cam-impingement group the labrum was separated from the cartilage
Femoroacetabular Impingement: Radiographic Findings
the one o’clock position. The mean depth of cartilage damage was found to be 11mm corresponding to one-third of the total depth of the cartilage at this location. Debonding of
the acetabular cartilage from the subchondral bone was evident in 10 hips and more severe
loss of fixation was found in a further 10 hips with frayed edges and cartilage thinning. Other studies have also noted soft-tissue damage associated with cam-type impingement.
Siebenrock et al. (2004) noted that within their cohort of 15 patients, four had labral
degeneration and 11 had partial labral tears. Philippon et al. (2012) during surgery of 65 hips (6 cam, 10 pincer, 49 mixed) had to address labral tears in all patients. Wyss et al.
(2007) found that all patients had a degenerated or torn labrum and 86% had evidence of
articular cartilage damage. Pfirrmann et al. (2006) assessed cartilage lesions and labral abnormalities in 33 cam patients and 17 pincer patients. Cartilage lesions were found in the
anterior and anterosuperior quadrants and were significantly larger in the cam impingement
group. Consequently, Pfirrmann et al. (2006) characterised cam FAI to include large α
angles, acetabular cartilage lesions in the anterosuperior position and an osseous bump
formation on the femoral neck.
4.2 Hip alignment and acetabular morphology
There have been a number of skeletal studies of pelvic morphology (K¨ohnlein et al., 2009;
Maruyama et al., 2001). The study by K¨ohnlein et al. (2009) considered their findings
in relation to FAI. They analysed 66 (42 male, 16 female, 8 unknown) acetabulae from 33 subjects and found that the outer bony rim was shaped in a regular wave-like manner
with three consistent prominences and two depressions. The prominences were located
in the anterosuperior, anteroinferior and posteroinferior regions of the acetabulum, while the depressions were located at the anterior wall and along the posterosuperior wall. The
location and extent of these prominences and depressions were not distinguishable by gender. The anterior depression was on average 9o below the level of a hemisphere while
the posterosuperior depression was 21o below the level of the hemisphere. The orientation
of the acetabular opening plane was 48o ±4o in inclination, 21o ±5o in anteversion and 19o ±6o for tilt. Acetabular tilt describes the rotation of the acetabulum with respect to the APP plane, it is the angle in the sagittal plane between the APP and a line through
the 6pm and 12pm positions of the acetabulum. The role of both acetabular inclination and tilt had not previously been considered with regard to FAI. K¨ohnlein et al. (2009)
hypothesised that lower inclination was likely to decrease anterosuperior hip clearance
which would lead to pincer impingement. In a similar manner decreased acetabular tilt would place the constant rim prominences more inferiorly causing decreased clearance.
Consequently, the degree of pelvic tilt and acetabular tilt should be considered separately
Femoroacetabular Impingement: Radiographic Findings
bony prominences in certain postures.
Buller et al. (2012) considered not only the alignment of the pelvis but also the femur. They
hypothesised that acetabular retroversion may be compensated for by alterations in the
proximal femur. The study determined the correlations between femoral version, neck-shaft angle, acetabular version, centre edge angle and gender in normal subjects - 115 patients
(57 male, 58 female), average age 59 (29-75). Correlations were found between these
anatomical measurements - a positive correlation between femoral version and acetabular version (0.38o:1o) and between femoral neck-shaft angle with acetabular version (0.21o:1o). The female gender was also positively correlated to both acetabular version (2.6o:1o) and centre edge angle (2.8o:1o). These findings build upon the results of Cobb et al. (2010) who found no significant difference in acetabular version between patients with cam or pincer
FAI and control subjects with normal acetabulae. Indeed, Cobb et al. (2010) questioned
whether acetabular retroversion was indeed a leading factor for FAI and in fact acetabular and femoral versions compensate for each other (Buller et al., 2012). Consequently, the
authors suggest that improvement in FAI surgery may be due to addressing the labral tears and chrondral injury rather than correcting the bone abnormality. However, Ito
et al. (2001) recorded in their study that femoral anteversion was significantly less in their
patient group (9.7o ±4.7o) compared to the asymptomatic control (15.7o ±4.4o). This means as well as differences in acetabular orientation in FAI patients, femoral anteversion
and neck-shaft angle my also be a route cause for impingement as well as bony morphology
with regard to femoral hump malformation and acetabular overcoverage.
The combination of bony malformation, orientation of the acetabulum and proximal femur
as well as pelvic tilt make it possible to experience impingement during a normal range
of motion. One of the main manoeuvres which has been found to cause groin pain in symptomatic patients is forced internal rotation at 90oflexion. Wyss et al. (2007) conducted
a study to observe whether this manoeuvre correlated to lack of joint clearance at 90o
flexion. The study used positional MRI to image the subject at 90o of hip flexion, there were 23 (19 male, 4 female) patients identified clinically with a positive impingement sign,
average age 33 (22-42). There were 40 asymptomatic volunteers (20 male, 20 female),
average age 30 (20-46). Theβ angle as described in section 3.1 was measured in the flexed position. There was a significant difference in both the measured internal rotation and β
angle clearance between the patient group and the control group - patient group internal
rotation 4o (−10o-20o), β angle 5o ± 9o; control group internal rotation 28o (10o-40o),
β angle 30o ±9o. The correlation between internal rotation and β angle clearance was r = 0.97. The results showed clinical evidence of hip impingement was due to direct abutment between the acetabular rim and femoral neck. Wyss et al. (2007), also found that
internal rotation of less than 20o was highly correlated to joint damage and anterior joint
Femoroacetabular Impingement: Radiographic Findings
asymptomatic because they do not routinely participate in activities that demand forced flexion and internal rotation. In contrast, there may be some activities that are unsuitable
for individuals with mild or severe deformities.
Cobb et al. (2010) analysed the extent of acetabular bony deformity in 20 normal subjects, 20 cam (α ≥ 50o) and 20 pincer patients (lateral centre edge angle ≥ 39o). MRA was used to measure the acetabular angle in three-dimensions, as described in section 3.2 as
well as the inclination and anteversion of the acetabular rim plane. It was found that on average cam acetabulae (84o ±5o) were shallower than normal hips (87o ±4o) which were shallower than pincer hips (96o ± 5o) a one-way ANOVA statistic showed a significant difference between these groups. Considering, no significant difference was found with regard to acetabular inclination and anteversion, the only model for impingement in the
pincer group was the depth of the acetabulum whereby overcoverage allows for linear
abutment at the extremes of hip motion. These findings are supported by Pfirrmann et al. (2006) who also found that the acetabulum was significantly deeper in pincer patients with
a mean depth of 4.8mm compared to 0.7mm in the cam impingement group.
In the normal population Laborie et al. (2011) found that overcoverage was evident in
14.4% of males and 4.9% of females. While evidence of focal overcoverage and acetabular
retroversion was more prominent - posterior wall sign (23.4% male, 11.0% female) and crossover sign (51.4% male, 45.5% female). Evidence of one of more of these pincer
features was shown in 298 males (34.3%) and 198 females (16.6%). There was a high
degree of coexistance amongst most FAI findings but particularly with posterior wall sign and crossover sign especially within the female population. The presence of both
these radiological signs indicates acetabular retroversion (Clohisy et al., 2008). Therefore,
considering the commonality of pincer findings within the male population, acetabular retroversion in females may be the main cause of pincer-type FAI. Laborie et al. (2011)
also found little overlap between cam and pincer findings which support the findings of
Cobb et al. (2010) who regard cam and pincer deformities as distinct. Finally, the authors summarise that FAI indications are the result of anatomic variation rather than true
pathologic abnormalities.
Considering the documentation of joint degeneration Beck et al. (2005) recorded labral as well as femoral and acetabular cartilage damage in 16 (2 male, 14 female) patients
with isolated coxa profunda. In these hips, the labrum was separated from the acetabular cartilage in five hips. Damage to both the labrum and acetabular cartilage was more
circumferential with a mean maximum depth of cartilage damage of 4mm at the 12 o’clock
position. Loss of fixation of the acetabular cartilage was seen in five hips. Five hips had roughening of the acetabular cartilage in the posteroinferior region while ten femoral heads
Femoroacetabular Impingement: Radiographic Findings
2003). These findings were reinforced by Pfirrmann et al. (2006) who analysed 17 patients with a deep acetabulum. In these hips, cartilage lesions were seen in the anterior and
anterosuperior regions but significantly in contrast to cam hip, labral and cartilage lesions
were also evident in the posterior and posteroinferior regions. Pfirrmann et al. (2006) characterised pincer FAI as having a deep acetabulum and posteroinferior cartilage lesions.
4.3 Association of radiological indications with osteoarthritis
A number of recent studies have been motivated by findings with regard to the prevalence of FAI morphology in the asymptomatic population to assess the link between FAI morphology
and OA (Bardakos and Villar, 2009; Gosvig et al., 2010; Hartofilakidis et al., 2011). Bardakos
and Villar (2009) built upon the findings of Wyss et al. (2007) who found when comparing patients with FAI and asymptomatic control subjects there was a 12% overlap in the range
of internal rotation between the patients and the asymptomatic volunteers. Thus raising
the question of how influencial the role of activity is in the development of systematic impingement. Bardakos and Villar (2009) hypothesised that not all hips with FAI were
equally likley to develop FAI. To test this hypothesis they analysed the radiographs of
patients who were under 55 with a pistol-grip deformity. Two sets of radiographs were analysed set 10 years apart for a total of 43 (47 hips) eligible patients. On the initial
radiographs, 29 hips had mild grade I OA and 14 had moderate grade II OA. In the
final radiographs a total of 28 hips had progressed to OA. There were three important factors which distinguished the OA group from the non-OA group - medial proximal
femoral angle (p-value = 0.004), posterior wall sign (p-value = 0.02) and cross-over sign
(p-value = 0.08). The medial proximal femoral angle describes the topographic relationship between the femoral head and greater trochanter in the coronal plane. Factors such as
α angle, neck-shaft angle, centre-edge angle, T¨onnis angle and coxa profunda were found not to be significant, although there was a low incidence of coxa profunda in the initial
radiographs. The author’s stated that their results show that mild to moderate OA of
hips with a pistol grip deformity will not progress to full OA in all patients. In fact, other structural abnormalities such as acetabular version when present are partly responsible for
this progress.
In a similar study, Hartofilakidis et al. (2011) sought to investigate the association of cam, pincer and mixed-type impingement and degeneration of the hip joint. The authors
examined the initial AP radiographs of patients who had been treated for unilateral hip
disease but on initial examination had no radiological signs of OA. A total of 96 (31 males, 65 females) patients were identified as having one or more morphologic features of FAI
Femoroacetabular Impingement: Radiographic Findings
were also assessed for presence of early OA. Of the 96 hips there were 17 cam (1 developed OA), 34 pincer (7 developed OA) and 45 mixed (9 developed OA) - there was no significant
difference in the incidence of OA amongst groups. The presence of the posterior wall
sign together with crossover sign which indicate acetabular retroversion was significantly associated with development of OA. However, the study found that factors not measured
by the study were significant contributors to the development of OA. Many authors cite
that activity may play a role in the development of OA (Bardakos and Villar, 2009; Clohisy et al., 2009; Ito et al., 2001), while a recent study by Pollard et al. (2010) indicated that
genetic influences may play a role. None of these factors were measured by the study.
The study by Gosvig et al. (2010) was a population based overview of the main osseous malformations of the hip seen radiologically. In total there were 3620 (1332 male, 2288
female) patients included in the study. The AP radiographs were reviewed and classified
into (1) No malformation (2) acetabula dysplasia (centre edge angle ≤ 20o) (3) deep acetabulum in coxa profunda or protrusio acetabuli (centre edge angle≥ 45o) (4) pistol-grip deformity (triangular index≥0mm) and (5) a combination of a deep acetabulum and pistol-grip deformity. The prevalence of OA within the study group was found to be 9.5%
in males and 11.2% in female. There was a significant correlation with prevalence of OA
and patients with a deep acetabulum and pistol grip deformity. Of those patients with OA - 3.1% of males and 2.7% of females had acetabular dysplasia. A deep acetabulum was seen
in 27% of males and 28.3% of females, a pistol-grip deformity in 30.2% of males and 5%
of females. Finally, combined deep acetabulum and pistol grip deformity was present in 10.5% of males and 0.6% of females. The findings of this study reinforced previous findings
in a number of areas. Firstly, it supports the findings of Goodman et al. (1997) who found
that a pistol-grip deformity is primarily a malformation in males and the male to female ratio of this deformity is approximatley the same ratio found in cases of SCFE. The study
also agreed with the findings of Goodman et al. (1997) with regard to pistol-grip being a
significant risk factor for OA along with a deep acetabulum which has been found in other studies (Bardakos and Villar, 2009; Hartofilakidis et al., 2011). In fact the study found
malformation in 71% of males and 36.6% of females with hip OA suggesting idiopathic OA
Femoroacetabular Impingement: Radiographic Findings
4.4 Summary
This section has summarised the findings of many of the significant studies analysing the
predominance of FAI and its role in joint degeneration. The key findings of these studies have been summarised.
Both Jung et al. (2011) and Laborie et al. (2011) have identified that both cam and pincer morphology is common in the asymptomatic population and the studies by
Bardakos and Villar (2009), Gosvig et al. (2010) and Hartofilakidis et al. (2011) have
analysed progression to OA in subjects with these morphologies. It has been found that presence of cam or pincer abnormality does not necessarily lead to OA. However,
pistol-grip morphology or a deep acetabulum are present in a significant number
of OA cases (Gosvig et al., 2010). In cases of pistol-grip morphology presence of acetabular retroversion will heighten the risk of progression to OA and is a risk factor
in its own right (Bardakos and Villar, 2009; Hartofilakidis et al., 2011). Consequently,
there is an interactive effect between femoral and acetabular morphology (Neumann et al., 2009).
There has been found to be significant gender differences with regard to bony abnormality, particularly on the femoral side. It is clear that cam-type morphology is more common in males than it is in females (Gosvig et al., 2007; Jung et al.,
2011; Laborie et al., 2011). However, on the acetabular side the findings are less
clear, with many studies finding an equal distribution of pincer-type morphologies in males and females (Gosvig et al., 2010; Laborie et al., 2011). This disagrees with the
clinical presentation of pincer FAI being predominant in females (Clohisy et al., 2009;
Tannast et al., 2007a). However, both Buller et al. (2012) and Laborie et al. (2011) found that females were more likely to show clinical signs of acetabular retroversion.
Consequently, separating out the pincer morphologies, acetabular retroversion is more predominant in females while a deep acetabulum is equally likely to be seen in males
and females.
A number of radiological diagnoses have characterised distinct acetabular morphology which differentiates cam and pincer morphologies (Cobb et al., 2010; Laborie et al.,
2011; Pfirrmann et al., 2006). Both Cobb et al. (2010) and Pfirrmann et al. (2006)
only assessed pure cam and pincer cases and distinguished pincer hips as being deeper than cam hips, rather than classifying retroversion as being distinct within these
groups. Consequently, these studies have analysed only pure pathologies, missing
mixed cases which many studies still identify as being predominant (Neumann et al., 2009; Philippon et al., 2012; Siebenrock et al., 2004) as well as gender differences