Learning a Spelling Error Model from Search Query Logs
Farooq Ahmad Department of Electrical and
Computer Engineering University of Alberta
Edmonton, Canada [email protected]
Grzegorz Kondrak
Department of Computing Science University of Alberta
Edmonton, Canada
Abstract
Applying the noisy channel model to search query spelling correction requires an error model and a language model. Typically, the error model relies on a weighted string edit distance measure. The weights can be learned from pairs of misspelled words and their corrections. This paper investigates using the Expec-tation Maximization algorithm to learn edit distance weights directly from search query logs, without relying on a corpus of paired words.
1 Introduction
There are several sources of error in written lan-guage. Typing errors can be divided into two groups (Kucich, 1992): typographic errors and cog-nitive errors. Typographic errors are the result of mistyped keys and can be described in terms of key-board key proximity. Cognitive errors on the other hand, are caused by a misunderstanding of the cor-rect spelling of a word. They include phonetic er-rors, in which similar sounding letter sequences are substituted for the correct sequence; and homonym errors, in which a word is substituted for another word with the same pronunciation but a different meaning. Spelling errors can also be grouped into errors that result in another valid word, such as homonym errors, versus those errors that result in a non-word. Generally non-word errors are easier to detect and correct. In addition to its traditional use in word processing, spelling correction also has ap-plications in optical character recognition and
hand-writing recognition. Spelling errors in this context are caused by inaccurate character recognition.
Search query correction is an interesting branch of spelling correction. Due to the wide variety of search queries, dictionary based spelling correction is not adequate for correcting search terms. The con-cept of using query logs to aid in spelling correction is explored in (Brill and Cucerzan, 2004). It is noted that using traditional Levenshtein distance as an er-ror model can lead to inappropriate corrections, so a weighted distance measure is used instead.
This paper focuses on deriving a language model and probabilistic error model directly from search query logs without requiring a corpus of misspelled words paired with their corrections. The task of search query spelling correction is analyzed, and an implementation of the Expectation Maximization (EM) algorithm to learn an error model is described, with reference to similar approaches. In Section 2, the make-up of search queries is analyzed in the context of spelling correction. Section 3 details the noisy channel model spelling correction framework and describes how the EM algorithm is applied to learn an error model. The learned error model is ex-plored in Section 4. The derived model is tested in Section 5 by comparing its performance in the single word spelling correction task to popular spell check-ing applications. Finally, conclusions and directions for future work are presented in Section 6.
2 Analysis of Search Queries
Search queries present a difficult challenge for tradi-tional spelling correction algorithms. As mentioned above, dictionary-based approaches cannot be used since many search terms include words and names that are not well established in the language. Fur-thermore, search queries typically consist of a few key words rather than grammatically correct sen-tences, making grammar-based approaches inappro-priate. In addition, spelling errors are more com-mon in search queries than in regular written text, as approximately 10-15 % of search queries contain a misspelling (Brill and Cucerzan, 2004). The suit-ability of query logs as a corpus for spelling correc-tion is investigated in this seccorrec-tion.
The metaspy website1 displays search queries
submitted to the popular metacrawler search engine in real time. Over a period of five days in the last
[image:2.612.326.527.54.179.2]1www.metaspy.com
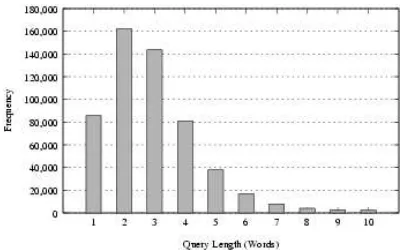
Figure 1: Query Length Frequency Histogram
week of March 2005, 580,000 queries were ex-tracted from the site. Several interesting observa-tions can be made from the analysis of the search queries.
2.1 Query Length
On average, each query consisted of approximately 3 words. Figure 1 shows the distribution of query lengths.
As illustrated in Figure 1, over 80% of queries include more than one search term. Thus word n-gram probabilities provide useful statistical knowl-edge that can be exploited to improve spelling cor-rection. Although word cooccurrences are not used for spelling correction in this paper, the possibilities for n-gram analysis are explored in Section 3.2. The longer queries (>5 terms) often contain quotations,
song lyric excerpts or very specific product names. The frequency of words in written text has been shown to follow Zipf’s law. That is, if the words are ordered in terms of frequency, the relationship be-tween frequency and rank can be approximated with the following equation.
F ≈ C
rm (1)
whereF is the frequency,ris rank,Cis a constant,
and m is an exponent close to 1. In logarithmic
form,
log(F) = log(C)−m∗log(r) (2)
Figure 2: Token Frequency vs. Rank for Dictionary and Non-Dictionary Words
non-dictionary search query tokens. The word list available on most Unix systems/usr/dict/words is a comprehensive list that contains 96,274 words, in-cluding names, plurals, verbs in several tenses, and colloquialisms. Following tokenization of the query logs, the tokens were divided into dictionary and non-dictionary words. The frequency-rank relation-ship is similar for both types of words, except that nearly all of the 100 most frequent query tokens are dictionary words. The exponent m, the (negative)
slope of the linear best fit lines shown in Figure 2, was determined to be 1.11 for dictionary words, and 1.14 for non-dictionary words. As in (Baeza-Yates, 2005), the exponent is slightly higher than 1, partly due to the less frequent use of function words such asthein search queries relative to formal writing.
Although the majority of search tokens can be found in a standard dictionary, a large proportion of the less common queries are not dictionary words. In fact, 73% of unique word types were not found in the dictionary. Taking token frequency into con-sideration, these non-dictionary tokens account for approximately 20% of query search words, includ-ing correctly and incorrectly spelled words. How-ever, the majority of the non-dictionary tokens are correctly spelled words, illustrating the unsuitabil-ity of traditional dictionary based spelling correction for search query correction.
What are these non-dictionary words? An anal-ysis of the top two hundred non-dictionary words in the query logs allows categorization into a few main groups. The percentage of non-dictionary words belonging to each category, and some exam-ples from each category are shown in Table 1. The first category, e-speak, includes words and
abbre-Word Class Percent Examples 1 E-speak &
new words 45% pics, html, multiplayer,clipart, mpeg, midi 2 Companies
& Products 18% google, xbox, ebay,hotmail , playstation 3 Proper
Names 16% (los) angeles, ratzinger,ilios, mallorca 4 Medical
terms 5% ERBS, mesothelioma,neuropsychological, alzheimers
5 Misspellings 9% womens, realestate 6 Foreign
Words 6% lettre, para
Table 1: Classes of Non-Dictionary Words
viations that are commonly used online, but have not crossed over into common language. This cat-egory includes words such aspics, multiplayer, and
[image:3.612.317.535.230.366.2]3 Spelling Correction for Search Queries The spelling correction problem can be considered in terms of the noisy channel model, which consid-ers the misspelled wordv to be a corrupted version
of the correctly spelled wordw.
P(w|v) = P(v|w)P(w)
P(v) (3)
Finding the best candidate correction W involves
maximizing the above probability.
W =argmaxwP(v|w)P(w) (4)
The denominator P(v)in Equation 3 is the same for allwand can be eliminated from the calculation. P(v|w)models the errors that corrupt stringwinto
string v, and P(w) is the language model, or prior probability, of wordw.
3.1 Error Model
Given two stringsvandw,P(v|w)is the probability that v is transmitted given that the desired word is w. One method of describing the noise model is to
considerP(v|w)to be proportional to the number of edit operations required to transformwintov. This
gives
P(v|w)∝ED(v, w) (5) whereED(v, w) is the edit distance between v and w.
The traditional edit distance calculation assigns a fixed cost for each insertion, deletion, and substi-tution operation. For example, each insertion and deletion may be assigned a cost of 1, while substitu-tions are assigned a cost of 1.5. The edit distance calculation can be accomplished by dynamic pro-gramming.
The error model can be improved if each edit op-eration is considered separately, rather than assign-ing a fixed cost to each operation. For example, the substitution of the letter i for the letter e may be
much more likely than k fore. Thus if a stringS1
differs from stringS2 by onee → isubstitution, it
should be considered more similar toS2than a string
S3that differs fromS1by ane→ksubstitution.
Generating an accurate error model that consid-ers each edit operation individually requires learn-ing edit distance weights. As described in (Ristad
and Yianilos, 1997), character-to-character edit dis-tance costsED(e)can be related to edit probability
P(e)by means of the equation:
ED(e) =−log[P(e)] (6)
where e is an edit operation consisting of a
sub-stitution of one alphanumeric character for another (c1 → c2), an insertion ( → c1), or a deletion
(c1 → ).
Thus higher probability edits will have lower edit distances, and the string to string edit distance cal-culation proceeds in the same way as the tradi-tional calculation. This convenient representation allows whole string-to-string edit probability to be expressed in terms of the edit distance of the edit sequence[e1...en]:
P(w|v) = ΠP(ei)
=P(e1)∗P(e2)∗...∗P(en) (7)
Taking the log of both sides gives
log[P(w|v)] = log[P(e1)] + log[P(e2)]
+...+ log[P(en)] (8)
Finally, by combining 6 and 8 we can relate the probability of misspelling a string wasv to
string-to-string edit distance.
log[P(w|v)] =−ED(w, v) (9)
The edit probabilities can be estimated using the expectation maximization (EM) algorithm as de-scribed in Section 3.3.
3.2 Language Model
model is determined by tokenizing the query logs and determining the frequency of each token. The language modelP(w)is the frequency of the word
C(w)divided by the total number of tokensNin the
query log:
P(w) = C(w)
N (10)
Add-One smoothing is used to account for words not present in query logs.
3.3 Determining Edit Probabilities with Expectation Maximization
The EM algorithm is used to determine the parame-ters of the probability distribution for a given a set of data. It can be considered to be a soft-clustering al-gorithm: given several data points, the task is to find the cluster parameters which best represent the data. The EM algorithm is applied iteratively to each data point in a two-step process; the expectation step de-termines the degree to which data agrees with each cluster/hypothesis, and the maximization step up-dates the parameters to reflect the inclusion of the new data.
Prior to running the EM algorithm, the edit dis-tance table is seeded with initial values. The ini-tialization stage assigns high probability (low edit distance) to characters being typed correctly, and a lower probability for character substitutions. For each characterl, substitution distance is equally
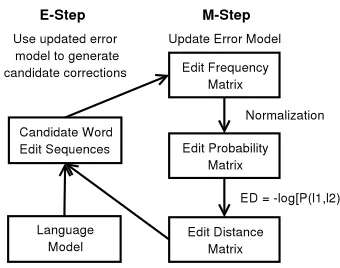
dis-tributed over all other characters and the deletion operation (l → ). Specifically the initial prob-ability for a character match was set to 90%, and the remaining 10% was equally distributed over the other 26 possible substitutions. Essentially, the first edit distance calculated in the EM algorithm will be equivalent to the fixed-weight Levenshtein distance. After this preprocessing stage, the edit probability matrix is iteratively improved with the E-Step and M-Step described below. The operation of the EM algorithm is illustrated in Figure 3.
For each query token, possible corrections are harvested from the query word list. The entire word list is searched, and any word within a threshold edit distance is considered as a candidate. Since the query logs can be quite large, determining the ex-act weighted edit distance between the input query and each logged query is quite computationally ex-pensive. Instead, the candidate queries are first
nar-Figure 3: The EM process
rowed down using a fast approximate string match-ing algorithm (Wu and Manber, 1990) to determine all candidates withink unweighted edit operations.
Then, the candidate queries that are within a second tighter threshold T, based on weighted edit distance, are kept.
Candidates(v) ={wi|ED(wi, v)< T}
Generally several words in the query logs will meet the above criteria. The threshold T is chosen
to ensure the inclusion of all reasonable corrections, while maintaining a manageable computation time. IfT were infinite, every query log token would need
to be considered, taking too much time. On the other hand, ifTis too small, some corrections may not be
considered. In practice,K was set to 3 unweighted
edits, andT was set as a constant proportion of word
length.
The expectation of each candidate correction is the probability that the word wi was desired given that the query wasv:
P(wi|v) =
P(v|wi)P(wi)
P(v) (11)
whereP(v|w) and P(w) are determined using the error and language models described in Equations (9) and (10).
If the value of T is set high enough, it can be
assumed that the correct word w is within the set
of candidates. So, the sum of probabilities over all candidates is normalized toP(v)in accordance with Bayes Rule of Total Probability.
[image:5.612.340.510.55.189.2]Correction Error
Model LanguageModel Total Proba-bility
[image:6.612.332.520.54.254.2]Normal-ized equipment 0.0014 0.00078 1.1e-6 0.77 equpment 0.64 5.0e-7 3.4e-7 0.23 equpiment 0.0005 5.0e-7 1.0e-9 0.0005
Table 2: Candidate Corrections forequpment
This gives us the following formula for the expecta-tion value
P(wi|v) =
P(v|wi)P(wi) ΣjP(v|wj)P(wj)
(13)
The E-step is used to generate candidate correc-tions for input query tokens. For example, input query”equpment”returns the candidate corrections and their probabilities shown in Table 2.
Note that several incorrectly spelled words, in-cluding ”equpment” itself, are given as candidate corrections. However, the language model derived from the query logs assigns a low probability to the incorrect candidates. In the case of a correctly spelled query, the most likely candidate correction is the word itself. However, occasionally there is a correctly spelled but infrequent word within a small edit distance of another more common word. In this case, the language model will bias the correction probability in favor of an incorrect edit. Neverthe-less, overall these cases do not seem to cause a sig-nificant impact on the error model except in the case of plural nouns as discussed in Section 4.
The maximization step updates the edit distance probabilities and edit distance table to reflect the query considered in the E-Step. For each can-didate correction, the required edits are added to the edit frequency table, weighted by the proba-bility of the correction. Then, the probaproba-bility of an edit for each character is normalized to 1 and the edit probabilities are stored in a table. Finally, Equation 6 is used to generate the edit probabil-ity table. For example, for the input query ”equp-ment” in response to the first candidate correction (equpment→equipment), the following
substitu-tion frequencies will each be incremented by 0.77:
e→e, q → q, u →u, i → , p →p, m →m, e→
e, n → n, t → t. The (i→ ) edit represents dele-tion of the letteri.
Letter Subs Letter Subs
a e qo n fkb
b grnw o a ei
c ksm p nfrm
d ds nk q glk
e ao i r sdm
f btpj s mdn
g o ks t yir
h rab u rio
i aue v awcm
j blhm w prgk
k vots x gtms
l r is y ioaje
[image:6.612.73.298.55.118.2]m nkvs z skmt
Table 3: Most Common Substitutions
4 The Learned Error Model
Approximately 580,000 queries were extracted from the metaspy site over a period of 5 days. After gener-ating a language model by analyzing token frequen-cies, the EM algorithm was run on a subset of the queries to find the edit probability matrix.
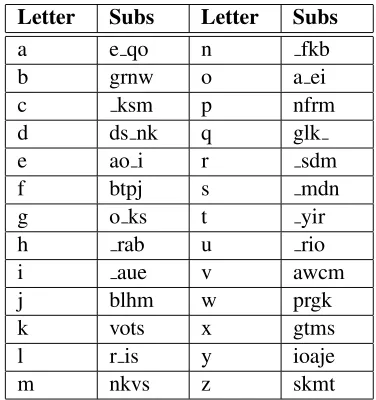
After 15,000 iterations, several patterns can be observed in the edit distance table. The most com-mon edit operations are shown in Table 3. As ex-pected, vowels are most commonly substituted for other vowels. As can be seen in the table, vowel edits are more probable than vowel-to-consonant transitions. The letter e is most
com-monly mistyped as a, o, and i; the letter iis most
often mistyped as a, u, and e. For the most part,
vowel substitutions can be considered to be cogni-tive errors (excepto→imay be a cognitive error or
typographic error). The effect of keyboard key prox-imity is also evident;bis often typed asg;dass;m
asn; and so on. Other errors seem to be a result of
phonetic similarity;cis misspelled askands;qasg
andk; andvasw. In general, the edit probabilities
roughly match those derived using a corpus of word pairs in (Kernighan, Church, and Gale, 1990).
Fig-Figure 4: Letter Insertion Probabilities
ure 4. That is because high frequency query words often appear in both singular and plural form. Every time the singular form is encountered, the plural is considered as a viable candidate correction, and the
sinsertion probability is increased.
Complementar-ily, every time the plural form is seen, the singular form is considered, increasing thesdeletion
proba-bility. Indeed, as can be seen in Table 3, deletion is the highest probability operation for the letters.
5 Testing
To test the accuracy of the error model, the well-known Unix based spelling correction programs Is-pell2andAspell3spell checking programs were used
for comparison. Ispell generates candidate cor-rections by considering all words within 1 edit of the misspelled word. Aspell uses the metaphone
algorithm (Philips, 1990), which divides English words into phonetic segments, and generates al-ternate spellings by substituting similar sounding phones. The test data set4 consists of 547
mis-spelled words paired with their best correction as de-termined by a human expert.Compound words were removed from the test set, leaving 508 misspellings. Several of the misspellings differ from the correction by multiple edit operations. Only the error model learned by the EM algorithm on the search engine queries was used; instead of using the probabilis-tic language model derived from the query logs and used for training, the word list in/usr/dict/wordswas used, with equal probability assigned to each word. 2International Ispell Version 3.1.20.
http://www.lasr.cs.ucla.edu/geoff/ispell.html
3Kevin Atkinson. Aspell Version 0.29.
http://aspell.sourceforge.net/
4Kevin Atkinson. http://aspell.net/test/
Spell
Checker ISPELL3.1.20 ASPELL0.29 EMBED Google Total
Tokens 508 508 508 508
Total
Found 272(53.5%) 480(94.5%) 402(79.1%) -Top 1
(%) 197(38.8%) 302(59.5%) 211(41.5%) 291(57%) Top 5
(%) 260(51.2%) 435(85.6%) 331(65.2%) -Top 25
(%) 272(53.5%) 478(94.1%) 386(76.0%)
-Table 4: Spelling Correction Accuracy
Since the test data is composed of single words of varying prevalence, a language model does not sig-nificantly aid correction. In practice, the language model would improve performance.
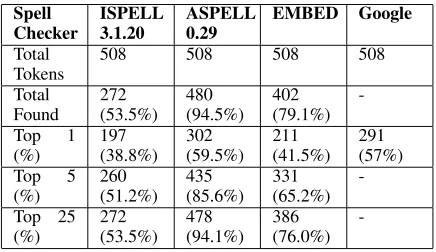
Table 4 compares the performance of the As-pell and Ispell spell checkers with the Expecta-tion MaximizaExpecta-tion Based Edit Distance (EMBED) spelling correction system described in this paper. The percentages refer to the percentage of instances in which the correct correction was within the top
N suggestions given by the algorithm. If only the
top recommended correction is considered, EMBED fares better than Ispell, but worse than Aspell. For the top 5 and 25 corrections, the rankings of the al-gorithms are the same.
[image:7.612.318.536.54.180.2] [image:7.612.85.286.55.181.2]Comparison to online spelling suggestion systems such as provided by theGooglesearch engine is dif-ficult since search results are returned for nearly ev-ery quev-ery on account of the large lexicon. Conse-quently, many suggestions provided by Google are reasonable, but do not correspond to the golden stan-dard in the test data. For example, ”cimplicity” and ”hallo” are not considered misspellings since several online companies and products contain these terms, and ”verison” is corrected to ”verizon” rather than ”version.” While Googlereturns 291 corrections in agreement with the data set (57%), another 44 were judged to be acceptable corrections, giving an accu-racy of 66%. In addition, several of the apparently misspelled test strings are new words, proper names, or commonly accepted alternate spellings that are common on the web, so no suggestions were given. Taking these words into account would further im-prove the accuracy rating.
6 Conclusions and Future Work
The EM algorithm is able to learn an accurate error model without relying on a corpus of paired strings. The edit probabilities determined using the EM al-gorithm are similar to error models previously erated using other approaches. In addition, the gen-erated error model can be used to find the correct spelling of misspelled words as described in Section 5. However, there are several improvements that can be made to improve spelling error correction. One step is increasing the size of the corpus. While the corpus included nearly 580,000 queries, sev-eral thousand of those queries were correctly spelled words without any misspelled versions in the corpus, or misspelled words without the correctly spelled version available. This results in the misidentifi-cation of candidate spelling corrections. Another improvement that can improve candidate correction identification is the use of better language models, as discussed in Section 3.2. Since a large propor-tion of queries contain more than one word, word n-gram statistics can be used to provide context sen-sitive spelling correction. Finally, a large proportion of typos involve letter transpositions, and other oper-ations that can not be captured by a single-letter sub-stitution model. In (Brill and Moore, 2000), a more general model allowing generic string to string
ed-its is used, allowing many-to-one and one-to-many character substitution edits. Pronunciation modeling in (Toutanova and Moore, 2002) further improves spelling correction performance.
Acknowledgments
Support for this work was provided by the Natu-ral Sciences and Engineering Research Council of Canada.
References
Baeza-Yates, R. 2005. Web Usage Mining in Search
Engines. Chapter 14 in Web Mining: Applications
and Techniques. Ed. Anthony Scime. New York: Idea Group Publishing, 2005. 307-321.
Brill, E. and Cucerzan, S. 2004. Spelling correction as an iterative process that exploits the collective knowledge
of web users. Proceedings of EMNLP 04. 293-300.
Brill, E. and Moore, R. 2000. An improved error model for noisy channel spelling correction. Proceedings of the 38th Annual Meeting of the Association for Com-putational Linguistics. 286 - 293.
Damerau, F. March 1964. A technique for computer detection and correction of spelling errors. Communi-cations of the ACM. 7(3):171-176.
Kernighan, M., Church, K., and Gale, W. 1990. A spelling correction program based on a noisy channel
model. Proceedings of COLING 1990. 205-210.
Kucich, K. 1992. Techniques for automatically
cor-recting words in text. ACM Computing Surveys.
24(4):377-439.
Philips, L. 1990. Hanging on the metaphone. Computer
Language Magazine.7(12):39.
Ristad, E. and Yianilos, P. 1997. Learning string edit
distance. IEEE Transactions on Pattern Analysis and
Machine Intelligence. 20(5):522-532.
Toutanova, K. and Moore, R. 2002. Pronunciation mod-eling for improved spelling correction.Proceedings of the 40th Annual Meeting of the Association for Com-putational Linguistics. 144-151.
Wagner, R. and Fischer, M. January 1974. The
string-to-string correction problem. Journal of the ACM.
21(1):168-173.
Wu, S. and Manber, U. 1992. Fast text searching
allow-ing errors. Communications of the ACM.