Surface Modification of Titanium using Laser Beam
*Kazumasa Nishio
1, Tomiko Yamaguchi
2, Hidenori Era
3and Mitsuaki Katoh
31Department of Biological Functions and Engineering, Graduate School of Life Science and Systems Engineering,
Kyushu Institute of Technology, Kitakyushu 804-8550, Japan
2
Department of Applied Science for Integrated System Engineering, Graduate School of Engineering, Kyushu Institute of Technology, Kitakyushu 804-8550, Japan
3Department of Materials Science, Faculty of Engineering, Kyushu Institute of Technology, Kitakyushu 804-8550, Japan
Pure titanium has an excellent biocompatiblity in comparison with stainless steels and Ti-Al-V alloys. We would expect pure titanium to have application for artificial joints and artificial bones if the wear resistance of the pure titanium were to be improved. So the surface modification of the pure titanium was performed using YAG laser beam. The laser power was 1.5 kW and Ar was used as the shielding gas. The shielding gas flow rate was changed from 5 to 40 L/min with a constant laser torch traveling speed of 500 mm/min. First, we investigated effects of the shielding gas flow rate on the Vickers hardness of the laser melted zone. When the shielding gas flow rate decrease, the average hardness increases and the oxygen and nitrogen concentrations of the laser melted zone also increase. We made clear the relationship between the average hardness and the nitrogen equivalent in the laser melted zone as follows. When the square root of the nitrogen equivalent (Neq¼NþO=2) was
less than 0.1, a plot of the average hardness for the square root of the nitrogen equivalent reveals a linear relationship. However, the average hardness of the laser melted zone increased more than the value indicated by the linear relationship when the square root of the nitrogen equivalent was above 0.1. Next, metallurgical analyses of the laser melted zone were performed using an electron probe micro analyzer (EPMA), an X-ray diffraction method (XRD) and a transmission electron microscope (TEM), and effects of the behavior of oxygen and nitrogen on the hardness of the laser melted zone were studied. A uniform dislocation structures in the laser melted zone is observed over a wide area where there is the linear relationship between the hardness and the square root of the nitrogen equivalent. Lamellar structure, which alternated between two phases ofTi and TiN in the laser melted zone, was formed where the hardness is greater than those indicated by the linear relationship. One phase of TiN contained a large quantity of nitrogen, and the other phase ofTi contained little nitrogen. It is found that the lamellar structure composes ofTi and Ti-nitrides (TiN and TiN0:26). It is also observed that a wide area ofTi possesses a twin structure with a high dislocation
density.
(Received January 16, 2004; Accepted March 30, 2004)
Keywords: surface modification, titanium, laser, biocompatibility, Ti-nitride, lamellar structure
1. Introduction
Pure titanium has an excellent biocompatibility in com-parison with stainless steels and Ti-Al-V alloys. We would expect pure titanium to have applications for artificial joints and artificial bones if the wear resistance of the pure titanium were to be improved. By means of an optical microscope, a serrate structure is observed in the laser melted zone, regardless of the laser irradiation conditions. As the Ar-shielding gas flow rate is decreased, the oxygen and nitrogen concentrations in the laser melted zone increase, and both the hardness and the tensile strength also increase. Furthermore, Okazaki et al.,1,2) Conrad3) and Tyson4) reported on the relationship between the soluble oxygen and/or nitrogen concentrations in Ti-O alloys and Ti-N alloys and the hardness, the yield strength and the flow stress of the alloys. To begin with, we investigated the effects of the Ar-shielding gas flow rate on the Vickers hardness of the laser melted zone. Then, the relationship between hardness and nitrogen equivalent in the laser melted zones was established, using the equation of Okazaki et al.2) Next, metallurgical
analyses of the laser melted zones were performed using an electron probe micro analyzer (EPMA), an X-ray diffraction method (XRD) and a transmission electron microscope (TEM), and the effects of the behavior of oxygen and nitrogen on the hardness of the laser melted zones were studied.
2. Experimental Procedures
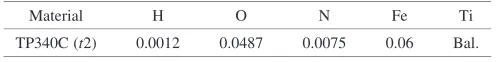
[image:1.595.303.551.664.695.2]The material used in this study was a commercial-pure titanium TP340C and the chemical composition is listed in Table 1. The thickness, width and length of the specimens were 2, 50 and 150 mm, respectively. The specimen surfaces were cleaned with acetone. Then, a length of 100 mm in the center of the specimens was melted using a YAG laser processor (Sumitomo Heavy Industries, MW2000). The focus of the laser beam (focal distance: 12.5 mm, spot diameter: 2 mm) was adjusted on the specimen surface, and then the laser torch was tilted by 10 degrees in the traveling direction. Table 2 shows the laser irradiation conditions. The laser power was 1.5 kW and Ar was used as the shielding gas. We investigated the effect of shielding gas flow rate on Vickers hardness of the laser melted zones when the
Table 1 Chemical composition of a titanium plate used (mass%).
Material H O N Fe Ti
[image:1.595.303.549.745.784.2]TP340C (t2) 0.0012 0.0487 0.0075 0.06 Bal.
Table 2 Laser irradiation conditions.
Laser power, Traveling speed, Shielding gas flow rate,
P/kW v/mmmin1 /Lmin1
1.5 500 5, 10, 15, 20, 30 and 40
*This Paper was Presented at the Kyushu Branch Meeting of the Japan
Institute of Metals, held in Kitakyushu, on June 6 ,2003.
Special Issue on Recent Research and Developments in Titanium and Its Alloys
shielding gas flow rate was changed from 5 to 40 L/min with a constant laser torch traveling speed of 500 mm/min.
A cross section of the laser melted zone was polished to a mirror like finish and the hardness profiles were measured at a depth of 1.0 mm from the surface of the laser melted zone, using a micro Vickers hardness tester (load:0.49 N, time: 20 seconds).
Quantitative analyses of oxygen and nitrogen in the laser melted zones were performed using an oxygen and nitrogen simultaneous analysis equipment (LECO-TC136). The speci-mens used for gas analysis were cut out with approximate
dimensions of 2 mm2 mm5 mm from the laser melted
zones only and were polished using emery paper of # 100 in order to remove the oxide layer of the specimen surfaces.
High resolution microstructure observation of the laser melted zones was performed using both a TEM H-900NAR (acceleration voltage: 300 kV, selected area:200 nm) and a TEM JEM-2010F (acceleration voltage: 200 kV, selected
area: 140 nm). To produce specimens used for a TEM
observation, disks having 3 mm diameter with a thickness of 150–200mmwere cut parallel to the top surface of the laser melted zone; thereafter thin films were produced by mechanical grinding, dimpling and ion milling processes.
3. Results
3.1 Hardness Distribution of the Laser Melted Zone
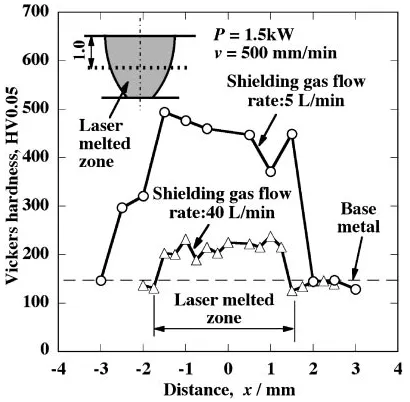
Hardness distributions of the laser melted zones, produced using shielding gas with flow rates of 5 and 40 L/min, are shown in Fig. 1. The hardnesses of the laser melted zones rapidly increase in the laser melted zone boundary and are more than that of the base metal, about 150HV. Where the shielding gas flow rate of 5 and 40 L/min, the average hardnesses of the laser melted zones are about 450 and 210HV, respectively. The relationship between the average hardness of the laser melted zones and the shielding gas flow rate is shown in Fig. 2. When the shielding gas flow rate decreases, the hardness gradually increases. However, when
the shielding gas flow rate was less than 15 L/min, the hardness rapidly increases.
3.2 Effect of Shielding Gas Flow Rate on the Nitrogen and Oxygen Concentrations
The relationship between the nitrogen and/or oxygen concentrations of the laser melted zones and the shielding gas flow rate is shown in Fig. 3. The nitrogen and oxygen concentration of the base metal, as shown by the broken lines, were 75 and 487 ppm, respectively. When the shielding gas flow rate decrease from 40 to 20 L/min, the nitrogen and/or oxygen concentrations gradually increase and then rapidly increase down to 5 L/min. Thus, the laser melted zones are obliged to contain nitrogen and oxygen even if the shielding gas is used to protect and the hardness of the laser melted zones depends on the nitrogen and oxygen concentrations.
Fig. 1 Hardness distributions of laser melted zones protected with shielding gas flow rates of 5 and 40 L/min.
Fig. 2 Relationship between average hardness of laser melted zones and shielding gas flow rate.
[image:2.595.325.525.71.267.2] [image:2.595.325.525.334.533.2] [image:2.595.67.272.557.758.2]4. Discussions
4.1 Relationship between Hardness and Nitrogen Equivalent
The relationship between the hardnessHand the average grain sizesdis given in eq. (1), from the relationship between the hardness H and the yield strength and the equation of Hall-Petch.
H¼H0þKH=d1=2 ð1Þ
Where, H0 and KH are constants. Okazaki et al. produced
several kinds of Ti-N alloys and Ti-O alloys by the zone melting method and examined the effects of grain size and interstitial solute concentration on the hardness at room temperature.1)As a result, the relationships betweenH
0and
KHand the square root of the interstitial solute concentration
are given using eqs. (2)–(5), respectively.
Ti-N alloys H0¼64þ1400N1=2 ð2Þ
KH¼1:15þ38N1=2 ð3Þ
Ti-O alloys H0¼64þ1000O1=2 ð4Þ
KH¼1:15þ27O1=2 ð5Þ
Where, N (= 0.09–0.61 at %) andO(= 0.25–045 at %) are
the nitrogen and oxygen concentrations (at %), respectively. The gradients in eqs. (2) and (3) are 1.4 times the gradients in eqs. (4) and (5); that is, the effect of the square root of the nitrogen concentration N1=2 onH0 andKH is 1.4 times the
effect of the square root of the oxygen concentration O1=2. Similarly, Conrad reported that the effect of nitrogen was twice the effect of oxygen on the yield strength3)and Tyson
also reported that the effect of nitrogen was approximately twice the effect of oxygen on the flow stress at 0.2 % strain.4)
Therefore,H0andKHare given by eqs. (7) and (8), using the
nitrogen equivalentNeq defined in eq. (6) for Ti-N-O alloy,
and the effect of the nitrogen equivalent on the hardness was examined.
Neq¼NþO=2 ð6Þ
H0¼64þ1400Neq1=2 ðNeq1=2¼0:03{0:078Þ ð7Þ
KH¼1:15þ38Neq1=2 ðNeq1=2¼0:03{0:078Þ ð8Þ
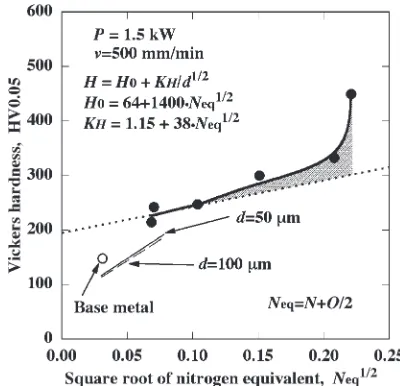
Figure 4 shows the relationship between the hardness and the square root of the nitrogen equivalent obtained in this study. Microstructures in laser melted zones had an apparent grain size of 50–100mm. The thin solid and the broken lines in the figure represent calculated results obtained using eqs. (1), (6), (7) and (8) for grain sizes d of 50 and 100mm, respectively. It is clear that the hardness increases linearly with an increase of the square root of the nitrogen equivalent. It is considered that the difference in the grain size has very little effect on the gradient of the straight line and the hardness is affected by the nitrogen equivalent more than by
the grain size. The symbol in the figure represents the
measured results for the laser melted zones with the supply of shielding gas at various flow rates. In addition the symbol represents the base metal. When the square root of nitrogen equivalent is less than 0.1, the experimental results, as indicated by the dotted line in the figure, reveal a linear relationship between the average hardness of the laser melted
zones and the square root of the nitrogen equivalent. It is considered that the increase of the hardness in this region is caused by the solution of oxygen and nitrogen in the laser melted zones. However, when the laser melting was performed with conditions of shielding gas flow rates of 5 and 10 L/min, the average hardness of the laser melted zones increased more than the value indicated by the linear relationship. It is considered that this increase in the hardness is caused by the formation of the second phase, which is different from the parent phase.
4.2 Distribution of nitrogen and oxygen
Metallurgical analyses of the laser melted zones were performed using EPMA, XRD and TEM for two cases, the first where there is the linear relationship between the hardness and the nitrogen equivalent (shielding gas flow rate: 40 L/min) and the second where the hardness is greater than indicated by the linear relationship (shielding gas flow rate: 10 L/min).
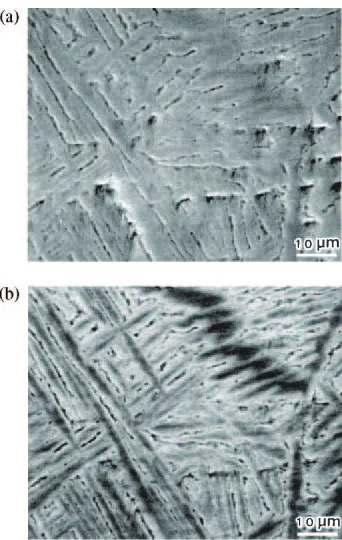
Figures 5(a) and (b) show composition images and linear analysis results for titanium, nitrogen and oxygen in the laser melted zones protected with shielding gas flow rates of 40 and 10 L/min, respectively. In the case of a shielding gas flow rate of 40 L/min (Fig. 5(a)), segregation of nitrogen and oxygen cannot be observed. In the case of a shielding gas flow rate of 10 L/min (Fig. 5(b)), lamellar structures are observed within the crystal grain of the composition image and the nitrogen concentration is seen to enrich in the region where the titanium concentration is decreased.
Figures 6(a), (b) and (c) show the scanning electron microscope (SEM) image, the composition image and the result of EPMA plane analysis of a laser melted zone, different from the results shown in Fig. 5(b), protected with a shielding gas flow rate of 10 L/min. Nitrogen (yellow in Fig. 6(c)) is present in the dark regions in the SEM image and the composition image, and titanium (red in Fig. 6(c)) can be observed in the intermediate regions. Though a region where oxygen had segregated was also observed, correlation was not observed with the contrast of the composition image.
[image:3.595.324.524.71.264.2]4.3 Change of lattice constant
Figure 7 shows XRD patterns obtained from the base metal and the laser melted zone protected with a shielding gas flow rate of 10 L/min. No intermetallic compounds were observed in either the base metal or the laser melted zone. However, profiles of XRD peaks obtained from several diffraction planes of the laser melted zone were synthesized. These were
separated and the lattice constants measured with a high degree of precision. Figure 8 shows XRD patterns of the diffraction plane (10113) for a separated example. The results for the lattice constants are shown in Table 3. The laser melted zone consists of two phases; one phase has a lattice constant equal to that of the base metal and the other phase shows a lattice constant with an increased c axis length compared with that of the base metal.
Consequently, the lamellar structures formed in the laser melted zone protected with a shielding gas flow rate of 10 L/ min, consist of two phases. One phase contains a large quantity of nitrogen, and the other contains little nitrogen.
4.4 Microstructure of the laser melted zone
Figures 9(a), (b) and (c) show a bright field image (BFI), a selected area diffraction pattern (SADP) and indexed result in the laser melted zones at a shielding gas flow rates of 40 L/
Fig. 5 Composition images and linear analysis results for titanium, nitrogen and oxygen in laser melted zones. (a) With a shielding gas flow rate of 40 L/min. (b) With a shielding gas flow rate of 10 L/min.
Fig. 7 XRD pattern obtained from base metal and laser melted zone protected with a shielding gas flow rate of 10 L/min.
[image:4.595.48.291.67.358.2] [image:4.595.324.527.69.244.2] [image:4.595.86.257.512.782.2]min, respectively. A uniform dislocation structure is ob-served over a wide area. The region having the uniform dislocation structure consists of mostlyTi and a very small amount ofTi.
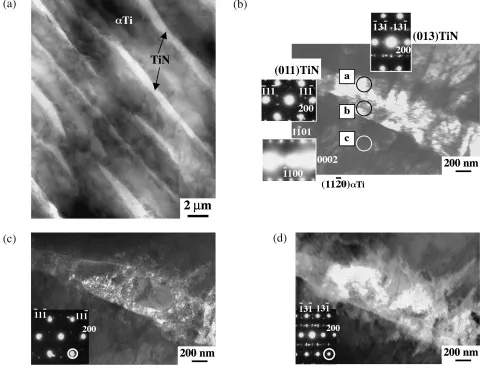
Figure 10(a) shows a BFI of low magnification in the laser melted zones at a shielding gas flow rates of 10 L/min. A lamellar structure is observed which is an alternated structure
between a dark contrast parent phase (Ti) and a white
contrast region of about 1mmin width at intervals of about 3mm. Firstly, the white contrast region was examined using TEM. Fig. 10(b) shows a BFI of the region near the white contrast region shown in Fig. 10(a). From analyses of the SADPs in the regions encircled ‘‘a’’, ‘‘b’’ and ‘‘c’’ in the photograph, regions of a, b and c were identified as TiN, TiN andTi, respectively. It is noted here that the laser melted zone contains nitrogen and oxygen and TiN and TiO have the same crystal structure of NaCl and the almost same lattice constant.5,6)From these facts, it is difficult to distinguish TiN
from TiO. However, the laser melted zone reveals much higher concentration of nitrogen than that of oxygen (see Fig. 3). Furthermore, solubility limit of nitrogen is considerably less than that of oxygen,7,8)suggesting that oxygen tends to
be inTi in solid solution. Therefore, the revealed phase of the white contrast region is considered to be of TiN. The dark field images (DFI) obtained from the (1111)TiN and (3331)TiN spots (indicated by circles in the SADPs) are shown in Figs. 10(c) and (d), respectively. From these DFIs, it is revealed that TiN is a polycrystalline substance.
Figures 11(a) and (b) show a BFI and DFI respectively of a region different from that shown in Fig. 10. There is lamellar ofTi and TiN (white contrast region of Fig. 11(b)) of about 200 nm in width. Figures 12(a) and (b) show a BFI and SADPs of a region different from those shown in Figs. 10 and 11. A phase of 200–500 nm wide is observed. Analyses of SADPs in the regions encircled ‘‘a1’’, ‘‘a2’’ and ‘‘a3’’ in the BFI, make clear that regions of a1 and a3 are of intermetallic compounds TiN0:26and region of a2 is of parent phase (Ti). Khidirov reported that the phase of TiN0:26has a space group of P33m1 (hexagonal structure) and the lattice constants of ‘‘a’’ and ‘‘c’’ are 0.2956 and 0.4765 nm.9) Referring their
experimental and calculated result of X-ray intensities, the phase of regions ‘‘a1’’ and ‘‘a3’’ was identified as TiN0:26. Figures 13(a) and (b) show a BFI and the indexed result of SADP in a region different from those shown in Figs. 10, 11 and 12. These are identified asTi, TiN0:26and TiN as shown in the indexed result. Consequently, it is clear that the white contrast phase isTi, including Ti-nitrides (TiN0:26 and/or TiN).
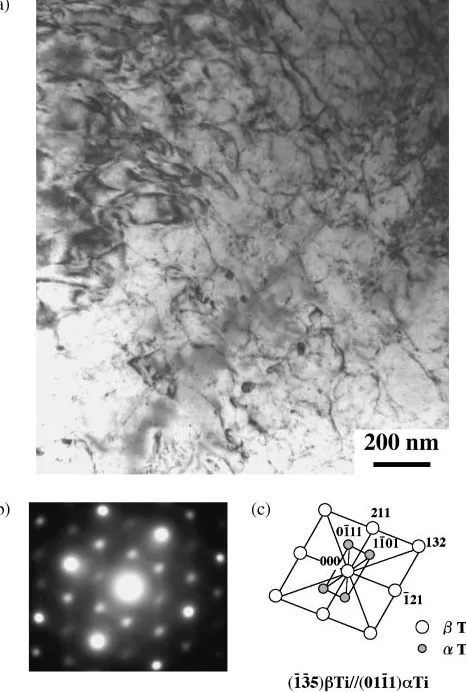
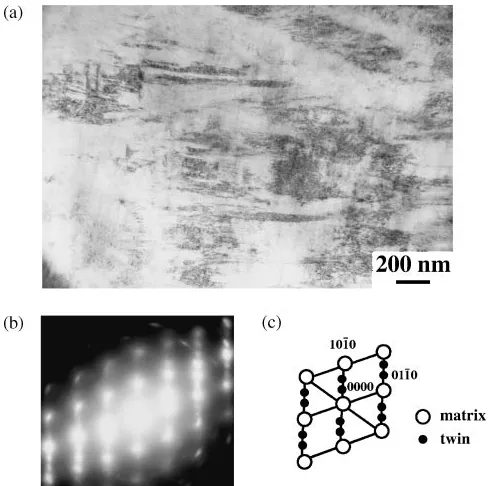
[image:5.595.67.275.71.318.2]Next, the black contrast phase shown in Fig. 10(a) was examined using TEM. Figures 14(a), (b) and (c) show a BFI, SADP and indexed result, respectively. A high strain filed due to containing a large amount of dislocation is observed (Fig. 14(a)). Furthermore, extra spots are observed besides the fundamental spots of Ti. The extra spot reveal at the
Table 3 Results of lattice constants ofTi obtained with shielding gas flow rates of 10 L/min.
Materials a/nm c/nm Laser melted zone:1 0.2958 0.4730 Laser melted zone:2 0.2958 0.4700 Base metal 0.2955 0.4692
[image:5.595.311.544.75.421.2] [image:5.595.46.291.375.430.2]reciprocal lattice positions of 1/3(a1–a3) where the vector (a1–a3) correspond to (10110)Ti in the real space and the extra spots indicate the twin formation10)(Figs. 14(b)
and (c)). Thus the Ti contains a large amount of lattice defects.
As mentioned above, the lamellar structure is very complicated, but it is considered to bring about a marked rise in the hardness due to the fact that is consists of, at least,
Ti with a high dislocation density and Ti-nitrides. Con-sequently, if the titanium surface is laser-melted, lamellar structures are formed in the surface layer of the titanium and the surface layer hardness is modified from approximately 400 to 500HV. So it is considered to improve the wear resistance of titanium.
5. Conclusions
We investigated, by means of metallurgical analyses, titanium melted zone protected with a YAG laser under different conditions of Ar-shielding gas flow rate. Main results obtained are as follows.
(1) The average hardness of the laser melted zones increased linearly with the increase of the square root of the nitrogen equivalent and then increased more rapidly than the linear relationship.
(2) A uniform dislocation structure in the laser melted zone with a shielding gas flow rate of 40 L/min, was observed using a TEM.
(3) Lamellar structure, composed of two phases in the laser melted zone with a shielding gas flow rate of 10 L/min, was formed. One phase contained a large quantity of nitrogen, and the other phase contained little nitrogen. (4) The lamellar structure consisted ofTi and Ti-nitrides
(TiN0:26 and/or TiN) and a wide area ofTi exhibits a twin structure containing a high dislocation density. Consequently, by laser surface melting, the surface hardness of the pure titanium was modified to approx-imately 450HV.
Acknowledgments
Thanks are due to Mr. N. Wakayama, Center of Instru-mental Analysis, Kyushu Institute of Technology, for his aids in this experiment.
REFERENCES
[image:6.595.56.539.74.442.2]1) K. Okazaki and H. Conrad: Trans. JIM14(1973) 364–367. 2) K. Okazaki and H. Conrad: Trans. JIM14(1973) 368–376. 3) H. Conrad: Acta Metall.14(1966) 1631–1633.
4) W. R. Tyson: Can. Metall. Quart.6(1968) 301.
5) P. Villare:Pearson’s Handbook Desk Edition, 2 (ASM International, Ohio, 1997) pp. 2441.
6) P. Villare:Pearson’s Handbook Desk Edition, 2 (ASM International, Ohio, 1997) pp. 2583–2584.
7) J. L. Murray: Phase Diagrams of Binary Titanium Alloys, (ASM
International, Ohio, 1987) pp. 176.
8) J. L. Murray: Phase Diagrams of Binary Titanium Alloys, (ASM International, Ohio, 1987) pp. 212.
9) I. Khidirov, A. S. Rakhimov, V. E. Loryan and I. I. Kurbanov: Inorg. Mater.26(1991) 1811–1813.
[image:7.595.315.545.70.360.2]10) P. B. Hirsch, A. Howie, R. B. Nicholson, D. W. Pashley and M. J. Whelan: Electron Microscopy of Thin Crystals, (Butter Worths, London, 1965) pp. 141–148.
[image:7.595.51.288.70.372.2]Fig. 14 Observation of region near the dark contrast region shown in Fig. 10(a) using TEM. (a) BFI. (b) SADP. (c) Indexed result.
Fig. 11 Observation of a region different from that shown in Fig. 10 using TEM. (a) BFI. (b) DFI.
[image:7.595.304.548.411.654.2]Fig. 12 Observation of a region different from those shown in Figs. 10 and 11 using TEM. (a) BFI. (b) SADPs.
[image:7.595.65.270.419.672.2]