Effect of Shear Deformation on Microstructural Evolution
of Ni-30Fe Alloy during Hot Deformation
Jae-Young Cho
1;2, Tadanobu Inoue
1, Fuxing Yin
1and Kotobu Nagai
11
Steel Research Center, National Institute for Materials Science, Tsukuba 305-0047, Japan
2School of Materials Science and Engineering, Seoul National University Shinrim-dong,
San 56-1, Kwanak-ku, Seoul 151-742, Korea
Electron backscattered diffraction analysis has been used to investigate the effect of shear deformation on the microstructural evolution of a Ni-30Fe alloy during hot deformation. The alloy was compressed by 50% or 75% in thickness at a strain rate of 1/s in a single pass at 1023 K using a hot compression simulator. An explicit finite element analysis was carried out to evaluate the inhomogeneous strain distribution introduced in the specimens by hot compression simulator. As the equivalent strain increased, the fraction of high angle grain boundaries with misorientaions between 15and 30increased almost in the similar way regardless of the presence of shear strain. The fraction of high angle grain boundaries having misorientations in excess of 30increased mainly at the expense of low angle grain boundaries with misorientations smaller than 15. Such the expense occurred at much higher rate with shear strain than without shear strain. The compressive direction changed continuously in the areas with shear strain component during deformation, which was thought to accelerate the subdivision of austenite grain interiors with increased misorientations between subdivided local areas.
(Received April 6, 2004; Accepted June 23, 2004)
Keywords: nickel-30 ferrous alloy, microstructural evolution, high angle grain boundary, low angle grain boundary, electron back-scattering diffraction pattern
1. Introduction
In recent years, several severe deformation techniques have been proposed, for example, equal channel angular
extrusion (ECAE),1–3) multi-axis compression,4)
accumula-tive roll bonding (ARB)5–7) and severe plastic torsion
straining (SPTS).8)These techniques aim to accumulate high
plastic strains into materials since the increase of the plastic strains leads to the enhanced rate of grain refinement.
The plastic strain is generally composed of two strain components or has two deformation modes: shear strain and the compressive (or tensile) strain. It is expected that these two strain components coexist in the materials deformed by the severe deformation techniques. The shear strain is known to be more effective for creating finer ferrite grains than the compressive strain due to the faster increasing rate of
austenite grain boundary surface area per unit volume.9)
Recently, Inoue et al. have reported that under the same
equivalent plastic strain"eq, the ferrite grain size in the area
with the shear strain is finer than that in the area without the
shear strain.10,11)At the same time it is also expected that the
different type of plastic strain will introduce significant changes in the microstructural evolution behavior of austen-ite grain interiors.
In this study, the effect of deformation mode on the microstructural evolution of Ni-30Fe alloy hot compressed by a pair of anvils is investigated. The explicit finite element analysis was used to evaluate the strain distribution in the specimens compressed by reduction ratios of 50% and 75%. On the basis of the calculated strain distribution, the microstructural evolution behaviors in the positions with and without the shear strain were compared according to the
equivalent plastic strain "eq. Finally, the effect of the shear
strain on the microstructural evolution was investigated in the
range of0¼xy¼2:29at the fixed equivalent strain"eqof
1.5 by means of EBSD technique.
2. Experimental
2.1 Specimen preparation
The ingot of Ni-30Fe alloy was prepared in a vacuum induction melting furnace with a weight capacity of 50 kg. The chemical compositions of Ni-30Fe alloy are given in Table 1. The ingot was re-heated to 1473 K and hot rolled to
make a plate with a size ofT60L550W140(mm). The
final rolling temperature was 1243 K. Rectangular specimens that were 12 mm in thickness, 20 mm in width and 18 mm in length were machined from the hot rolled plate for hot compression test.
2.2 Hot compression test
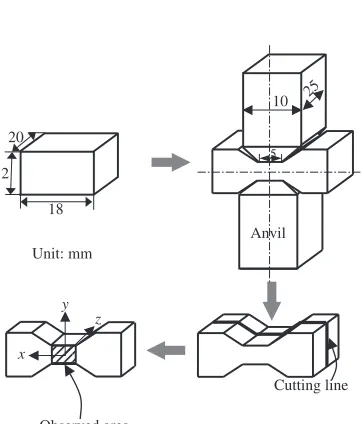
Figure 1 shows the path of the hot compression test. A hot compression simulator (DSI, Gleeble 2000) was used for the thermo-mechanical treatment. The specimen was heated to 1023 K and held for 20 seconds to make the specimen temperature uniform and then deformed by reduction ratios of 50% and 75% at a strain rate of 1/s. The deformation temperature of 1023 K was known to be in non-recrystallized
region.12) The deformed specimen was quenched to room
temperature by water jet immediately after the compression to freeze the deformed microstructure.
2.3 Observation of microstructural characteristics
[image:1.595.302.552.384.411.2]The specimen surface observed was parallel to the compression direction, as shown in Fig. 2. The specimens were etched for 20 seconds using a solution containing HCl
Table 1 Chemical compositions of specimen (in mass%).
C Mn Si P S Ni Fe
0.002 <0:002 0.008 0.002 0.001 69.8 Bal.
(10 ml), FeCl3(5 g) and ethanol (40 ml). The microstructures were characterized by optical microscopy and scanning electron microscopy.
The grain orientations were determined by scanning electron microscopy (LEO Gemini 1550) using the TSL EBSD system. The specimens for the EBSD examination were ground with SiC papers, mechanically polished with a
1mm-diameter alumina paste, and then electrochemically
polished for 20 s with a solution of 10% perchloric acid in
ethanol. The maps were typically 150mm150mmwith a
step size of a 0.5mm. Because the angular accuracy of the
present EBSD system is limited to approximately 1.5in the
expression of misorientation of two neighbor grains, in all the maps the following definitions were used. Low angle grain boundaries (LAGBs), or subgrain boundaries, were defined
as boundaries with misorientation between 1.5 and 15
misorientation, and high angle grain boundaries (HAGBs), or
grain boundaries, are defined as boundaries greater than 15
in the misorientation.
The three-dimensional dynamic finite element simulation was carried out using the explicit FE code ABAQUS/
Explicit.13) The specimen is assumed to be isotropic and
homogeneous. The anvil is regarded as a rigid body and the
specimen is not constrained in the x direction. An 8 node
linear element was used for the specimen. And the finite element mesh in the sample includes 6552 nodes and 5400 elements. Furthermore, adaptive meshing is carried out in the analysis because the mesh becomes too degenerate on heavy deformation.
The stress-strain relationships employed in the analysis were measured experimentally by compression test using a cylindrical specimen, and modified by considering
barrel-ing.10) In the analysis, the frictional conditions on the
contacting planes between the anvil and the specimen are described by the Coulomb model. The friction coefficient was assumed to be constant throughout the deformation and was determined by using experimental results with a screw. The Coulomb condition with a friction coefficient of 0.3 is used as the frictional condition on the contacting planes between the anvil and the specimen. Refs. 10–11) may be consulted for more detailed description of the numerical analysis.
4. Results and Discussion
4.1 Plastic strain distribution estimated by numerical
[image:2.595.80.256.71.517.2]analysis
Figure 3 represents the contour maps showing the
distri-butions of shear strain xy and equivalent plastic strain "eq
after 50% and 75% deformations at 1023 K and a strain rate
of 1/s. Here, thexyis denoted as the engineering strain. The
numerical analysis was carried out on the x-y plane of the
gray quarter part of the specimen. As can be seen in Fig. 3,
the material expands in thexdirection and contracts in they
direction by hot compression test. The shear strain increases towards the anvil edge from the center. And the shear strain
becomes zero along thexandyaxes in both cases of 50% and
75% deformations, which means that the plastic strains along
the x and y direction show a plane strain condition, i.e.,
"xxþ"yy¼0,"zz¼0. The equivalent plastic strain shows the
maximum value at the specimen center and the anvil edges. The high compressive strains at the center and the high shear strains at the anvil edges seem to be responsible for the maximum equivalent plastic strain.
Microstructures at different sites on the cross-section surface of the 75% compressed specimen are shown in Fig. 4. The microstructure below the contacting surface with anvils
shows non-deformed austenite grains of about 90mm in
diameter. However, the specimen is heavily deformed around the central region and anvil edges, as expected in Fig. 3 and the deformation feature shows a symmetrical distribution
about thexandyaxis. Figures 4(b)–(d) show the magnified
optical micrographs. They show different deformed micro-structures from site to site. The difference in the deformed microstructures is due to the strain variation induced by hot compression, as seen in Fig. 3.
Figure 5 represents schematic diagrams showing the sites 1023K, 20s
ratio of 50 % & 75% - Strain rate of 1/s
Quenched by water jet 5K/s
Fig. 1 Hot compression process.
Observed area 18 12
20
Cutting line Unit: mm
25
10
5
Anvil
x y
z
[image:2.595.86.248.75.247.2] [image:2.595.78.259.282.494.2](a)
(b)
(c)
(d)
y
x
z
Fig. 3 Contour maps of (a) shear strainxyand (b) equivalent plastic strain
"eqafter 50% compression and (c) shear strain xy and (d) equivalent
plastic strain"eqafter 75% compression at 1023 K and strain rate of 1/s.
y
x (a)
(c)
(d) (b)
500 µm
30 µm 30 µm
30 µm
Fig. 4 (a) Optical micrograph after deformation of 75% at 1023 K and strain rate of 1/s and (b)–(d) magnified views of areas indicated by squares in (a).
x
y
c1 s5 s6
(a)
x
y
c2 c3 c4 s1 s2 s3
s4
(b)
2.5mm
3mm
2.5mm
1.5mm
Fig. 5 Schematic diagrams of cross sections of specimens after (a) 50% and (b) 75% compression.
(a)
(e)
50 µm = 100 steps
(b)
(f)
(c)
1
2
(d)
3
4
(1.5°≤ <5θ °) (5°≤θ<15°) (15°≤θ)
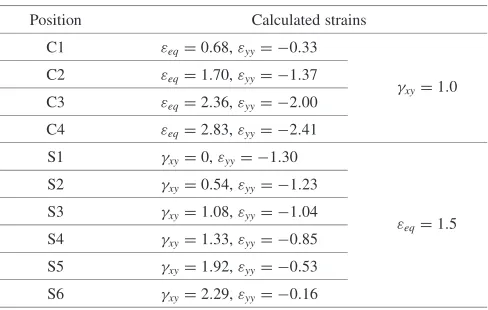
[image:3.595.335.516.74.356.2] [image:3.595.52.289.74.416.2] [image:3.595.307.541.411.735.2] [image:3.595.49.289.475.750.2]where the compressive strains and the shear strains and the equivalent plastic strains are evaluated in detail. The calculated strains at each site are shown in Table 2. The solid symbols in Fig. 5 indicate the positions in which the equivalent strain varies under the fixed shear strain of 1.0. On the other hand, the open symbols represent the positions where the shear strain varies under the same equivalent plastic strain of 1.5.
The following sections will deal with the microstructural evolution behaviors in the positions with and without the shear strain and the effect of the shear strain on the
microstructural evolution in the range of 0¼xy¼2:29at
the fixed equivalent strain"eqof 1.5.
4.2 Evolution of deformed structure with strain
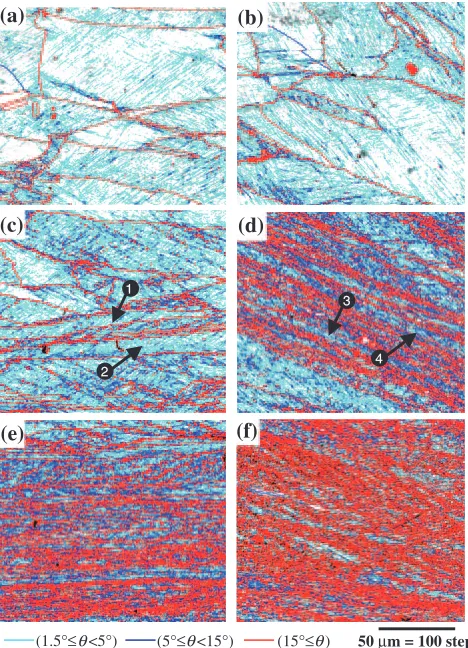
Figure 6 presents the EBSD maps of the deformed specimens by three equivalent plastic without or with shear
strain. The left hand side corresponds to the area along they
axis of Fig. 4(a), showing a plane strain compression without shear strain. On the other hand, the right hand side corresponds to the sites of C1–C4 of Fig. 5 with shear strain
xyof 1.0. It can be seen that at an equivalent plastic strain"eq
of 0.68 (Figs. 6(a), (b)), both deformed structures within austenite grains are composed of only LAGBs. At an equivalent plastic strain of 1.70 (Fig. 6(c), (d)), the laminar elongation of the structure aligned in the material flow direction becomes more evident. New HAGBs were gen-erated by the formation of deformation bands within austenite grains, signifying localized non-homogeneous deformation. However, the considerably elongated austenite grains of #1–#4 indicated by arrows in Figs. 6(c) and (d), have no HAGBs in contrast to other austenite grains. These elongated austenite grains with uniform deformation struc-ture are thought to develop in the austenite grains with stable crystal orientation. But such the stable elongated grains are known to be broken into subgrains when they are reduced to
approximately one subgrain size in width.14)With increasing
the equivalent plastic strain to 2.83 (Figs. 6(e), (f)), the grains are subdivided more rapidly by the formation of HAGBs in almost all the austenite grains.
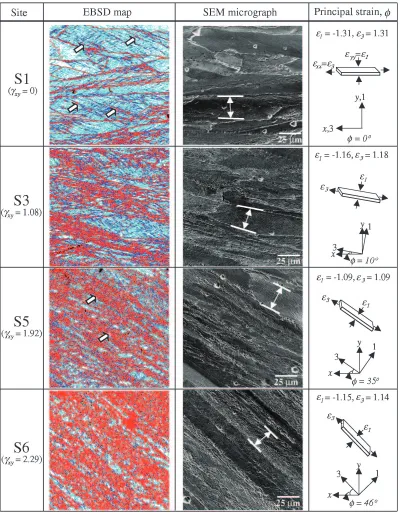
In order to investigate the effect of shear strain component on the microstructural evolution, EBSD maps was
deter-mined for the sites of S1-S6 of Fig. 5 with shear strainxyup
in Fig. 7. With fixing the equivalent plastic strain at 1.5, the amount of compressive strain decreases with increasing shear strain, as shown in Table 2. Since it becomes difficult to discern the austenite grain boundaries with increasing strain, SEM micrographs are also shown in Fig. 7. It can be seen that
the site S1 with a shear strainxyof 0, that is, deformed with
just compressive strain, new HAGBs were generated by the formation of deformation bands within austenite grains, as indicated by arrows. After deformation with shear strain of 1.92 (at site S5), some grains, indicated by arrows, were filled with fine HAGBs. With increasing the shear strain to 2.29 (at site S6), new HAGBs get developing on a much finer scale within almost all the austenite grains.
From Fig. 7, it can be also known that the compressive direction varies with shear strain, contrary to no rotation of compressive direction in the sites without it. In order to express local strain, it is convenient to introduce a local coordinate system (1-2-3) whose axes coincide with the
directions of the principal strains"1,"2and"3("1< "2 < "3).
Using each strain value obtained in the specimen coordinate
system (x-y-z), the directions of the principal axes in the local
coordinate system and the principal strains are calculated. The schematic drawings of the principal axes (1-3) and the
rotation anglefrom thexandyaxes to the principal axes at
each site are also illustrated in Fig. 7.
Under the same equivalent strain of 1.5, the principal strains at each site are almost identical around 1.2 with different shear strains from 0 to 2.29. Accordingly the deformed austenite grains have a similar thickness of
approximately 25mmas indicated by arrows in SEM
micro-graphs of Fig. 7.
On the other hand, the rotation angle calculated with
shear strain becomes larger with increasing shear strain. For
example, the rotation angle is 10at the shear strain of 1.08
and 46 at the shear strain of 2.29. And further it shows a
good agreement with the slope of the deformed austenite grain boundary when the SEM micrograph and the illustra-tion of rotaillustra-tion angle in Fig. 7 are compared.
These results imply that the compressive direction rotates continuously during deformation and a kind of multidirec-tional deformation occurs with an increase in shear strain. Multidirectional deformation is well known to be effective
for grain refinement.18) That is, the multidirectional
defor-mation is believed to induce multiplication of slip systems and enhance the formation of high angle grain boundaries or the subdivision of grains. Consequently, even under the same equivalent strain, the increasing the shear strain might accelerate the subdivision of austenite grain interiors with increased misorientations between subdivided local areas.
4.3 Statistical measurements of the microstructural
evolution during deformation
The fractions of HAGB area are displayed as a function of equivalent plastic strain in Fig. 8. Figure 8 shows that the fraction of HAGB increases as the equivalent plastic strain increases. And the existence of shear strain makes the higher increase rate of increase in HAGB area fraction than no shear strain. At the equivalent plastic strain of 2.83, the fraction of HAGB is over 50% with shear strain of 1.0, in comparison eq
Position Calculated strains
C1 "eq¼0:68,"yy¼ 0:33
C2 "eq¼1:70,"yy¼ 1:37
xy¼1:0
C3 "eq¼2:36,"yy¼ 2:00
C4 "eq¼2:83,"yy¼ 2:41
S1 xy¼0,"yy¼ 1:30
S2 xy¼0:54,"yy¼ 1:23
S3 xy¼1:08,"yy¼ 1:04
"eq¼1:5
S4 xy¼1:33,"yy¼ 0:85
S5 xy¼1:92,"yy¼ 0:53
[image:4.595.47.291.92.247.2]with only 30% without the shear strain. Even with the increased equivalent plastic strain of 3.5, the fraction of HAGB is still 43% HAGB without the shear strain.
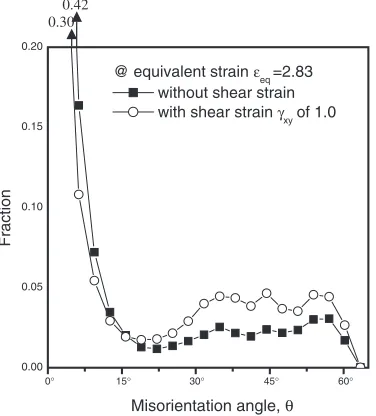
The typical boundary misorientation distribution deter-mined from the EBSD maps is shown in Fig. 9 at an equivalent plastic strain of 2.83 with and without shear strain. The graphs show the relative frequency of boundary
misorientations at intervals of 3. Misorientations less than
1.5 are omitted due to the orientation noise in EBSD
measurements. The fraction of misorientation angle,
espe-cially between 30and 50, is approximately two times with
shear strain as large as without shear strain.
Figure 10 compares the rates of development of bounda-ries for each misorientation range with increasing equivalent plastic strain in the area with and without shear strain component during deformation. In the graphs two classes of HAGBs are shown; lower high angle grain boundaries with
misorientations between 15 and 30, and very high angle
grain boundaries with misorientations in excess of 30. The
LAGBs are plotted against the left vertical axis and all the HAGBs are plotted against the right in Fig. 10.
As the equivalent strain increases, the fraction of HAGB
(15–30) increases almost in the similar way regardless of
the presence of shear strain. The fraction of HAGB (>30)
Fig. 7 EBSD maps, SEM micrographs and principal strains for some sites at equivalent strain of"eq¼1:5: site S1 (xy¼0), site S3
[image:5.595.99.499.71.585.2]increases mainly at the expense of LAGB (<15). Such the expense occurs at much higher rate with shear strain than without shear strain.
[image:6.595.77.266.71.261.2]Examples of misorientation distributions are presented in Fig. 11 for three shear strain levels at an equivalent plastic strain of 1.5. The fraction of LAGB decreases with an increase in shear strain. For example, the fraction of LAGB is 69% without shear strain but 33% with the shear strain of
2.29. On the other hand, the fraction of HAGB (>30)
remarkably increases with an increase in shear strain. Figure 12 represents the change of the fraction of grain boundary misorientation by shear stain when the equivalent
strain is 1.5. Again the fraction of HAGB (>30) increases
mainly at the expense of LAGB (<15) with an increase in
shear strain.
In general, the increase in the HAGBs during deformation is attributed to two mechanisms; (i) the formation of new
0 1 2 3 4
0.0 0.1 0.2 0.3 0.4 0.5
Fraction of HAGB (>15
°
)
shear strain γxy=0 shear strain γxy=1.0
eq
Equivalent Plastic Strain,ε
Fig. 8 Fraction of HAGB area plotted as a function of equivalent plastic strain with and without shear strain.
0.00 0.05 0.10 0.15 0.20 Fraction
@ equivalent strain εeq=2.83 without shear strain with shear strain γxy of 1.0 0.30
0.42
Misorientation angle, θ 15°
0° 30° 45° 60°
Fig. 9 One example of boundary misorientation distributions at equivalent plastic strain of 2.83 with and without shear strain of 1.0.
(b)
0 1 2 3
0.0 0.2 0.4 0.6 0.8 1.0
LAGB (<15°)
Fraction of HAGBs (>15
°
)
Fraction of LAGBs (<15
° ) 0.00 0.05 0.10 0.15 0.20 0.25 0.30 0.35 0.40 0.45
HAGB (15°-30°) HAGB (>30°)
0 1 2 3
0.0 0.2 0.4 0.6 0.8 1.0
LAGB (<15°)
Fraction of LAGB s(<15
° ) 0.00 0.05 0.10 0.15 0.20 0.25 0.30 0.35 0.40 0.45
HAGB (15°-30°) HAGB (>30°)
Fraction of HAGBs (>15
°
)
Equivalent Plastic Strain,εeq
[image:6.595.326.530.77.469.2]Equivalent Plastic Strain,εeq
Fig. 10 Comparison of the rates of development of boundary area fractions according to equivalent strains (a) without and (b) with shear strain of 1.0.
0.69 0.00 0.05 0.10 0.15 0.20 0.25 0.30 0.35 0.40 0.45 Fraction
@ equivalent strain εeq=1.5 shear strain γxy=0 shear strain γxy=1.33 shear strain γxy=2.29
10°
0° 20° 30° 40° 50° 60°
Misorientation angle, θ
[image:6.595.77.265.324.532.2] [image:6.595.332.522.553.758.2]high angle grain boundaries by grain subdivision9–11)and (ii) the extension of the initial and newly formed grain
boundaries with increasing strain.15–20)Here the initial grain
size is known to be a significant factor.16)Namely, the former
process is expected to occur predominantly in materials with
large grain sizes (i.e. >25mm). Because the grain size of
interest in the present study was approximately 90mm, the
former is thought to be controlling in the formation of HAGBs area of Figs. 6 and 10, as confirmed by SEM micrographs of Fig. 7. The formation of new HAGBs by
grain subdivision has been widely studied.15–20) Initially at
[image:7.595.63.276.70.265.2]low strains very coarse deformation bands are formed. As the strain increases cell blocks bordered by dense dislocation walls develop within the coarse bands and rotate progres-sively. On average the misorientation between adjacent cell blocks increases with strain and some dense dislocation walls will evolve into new high angle boundaries.
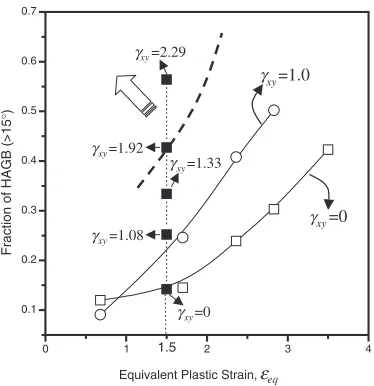
Figure 13 represents the fractions of HAGB area accord-ing to shear strain, with fixaccord-ing the equivalent plastic strain at
"eq¼1:5, together with the data of Fig. 8 which showed the faster formation of high angle grain boundaries during
deformation due to the presence of shear strain ofxy¼1:0.
It is likely that the curve passing through the point indicated
by xy¼1:92 might follow the dotted bold line with
increasing equivalent plastic strain. And the curves will move in the upper left-handed direction with an increase of shear strain component, as indicated by the arrow in Fig. 13. Hence, it is implied that the same HAGB fraction can be reached much rapidly at a relatively small equivalent plastic strain, with increasing the shear strain component.
The present study clarified that the shear strain component is more effective to develop uniform HAGBs in austenite grain interiors than the compressive strain.
5. Conclusions
On the basis of the calculated strain distribution induced by hot compression of 50% or 75% at a strain rate of 1/s in a single pass at 1023 K, the microstructural evolution behav-iors in the positions with and without the shear strain were compared.
As the equivalent plastic strain increased, the fraction of high angle grain boundaries with misorientations between
15 and 30 increased in the similar way regardless of the
presence of shear strain. On the other hand, the fraction of
boundaries with misorienations in excess of 30 increased
mainly at the expense of LAGB. Such the expense occurred at much higher rate with shear strain than without shear strain.
Under the same equivalent strain of 1.5, the principal
strains and the rotation anglefrom thexandyaxes to the
principal axes at each site were calculated. Though the deformed austenite grains had a similar thickness, the rotation angle of compressive direction became larger with increasing shear strain. Because of the rotation of compres-sive direction during deformation, a kind of multidirectional deformation seemed to occur with an increase in shear strain. Consequently, the multidirectional deformation accelerated the subdivision of austenite grain interiors with increased misorientations between subdivided local areas.
Acknowledgements
The authors would like to thank Ms. Sakurai, NIMS, for her help with EBSD experiment. One of the authors (J.Y.C) was supported by the Post-doctoral Fellowship Program of KOREA SCIENCE & Engineering Foundation (KOSEF) and wishes to express sincere gratitude to the Steel Research Center, NIMS.
REFERENCES
1) V. M. Segal: Mater. Sci. Eng. A197(1995) 157–164.
2) Y. Iwahashi, Z. Horita, M. Nemoto and T. G. Langdon: Acta Mater.45 (1997) 4733–4741.
3) D. H. Shin, B. C. Kim, Y.-S. Kim and K.-T. Park: Acta Mater.48 (2000) 2247–2255.
4) A. Belyakov, T. Sakai, H. Miura and R. Kaibyshev: ISIJ Int.39(1999)
0.0 0.5 1.0 1.5 2.0 2.5 0.0 0.2 0.4 0.6 0.8 1.0
LAGB (<15°)
Fraction of HAGBs (>15
°
)
Fraction of LAGBs (<15
°
)
HAGB (>30°) HAGB (15°-30°)
0.0 0.05 0.10 0.15 0.20 0.25 0.30 0.35 0.40 0.45 0.50 0.55
Shear Strain,γxy
Fig. 12 Rates of development of boundary area fractions according to shear strains at equivalent plastic strain of 1.5.
0 1 2 3 4
0.1 0.2 0.3 0.4 0.5 0.6 0.7 1.5
Fraction of HAGB (>15
° ) xy=1.0 xy=0 xy=0 xy=1.08 xy=1.92 γ γ xy=2.29 γ γ γ γ γ xy=1.33
[image:7.595.76.263.331.524.2]Equivalent Plastic Strain,εeq
Mater.39(1998) 1221–1227.
6) Y. Saito, N. Tsuji, H. Utsunomiya and T. Sakai: Acta Mater.47(1999) 579–583.
7) N. Tsuji, Y. Saito, H. Utsunomiya, S. Tanigawa: Scr. Mater.40(1999) 795–800.
8) Z. Horita, D. Smith, M. Furukawa, M. Nemoto, R. Z. Valiev and T. G. Langdon: J. Mater. Res.11(1996) 1880–1890.
9) J. G. Sevillano, P. Van Houtte and E. Aernoudt: Prog. Mater. Sci.25 (1980) 69–134.
10) T. Inoue, S. Torizuka, K. Nagai, K. Tsuzaki and T. Ohashi: Mater. Sci. Tech.17(2001) 1580–1588.
11) T. Inoue, S. Torizuka and K. Nagai: Mater. Sci. Tech.18(2002) 1007– 1015.
12) P. J. Hurley, B. C. Muddle and P. D. Hodgson: Metall. Mater. Trans.
Sorensen, Inc. USA, 1998).
14) J. R. Bowen, P. B. Prangnell and F. J. Humphreys: Mater. Sci. Tech.16 (2000) 1246–1250.
15) D. A. Hughes and N. Hansen: Acta Mater.45(1997) 3871–3886. 16) P. B. Prangnell, J. R. Bowen, A. Gholinia and M. V. Markushev:
International Symposium on Superplasticity, ed. by P. B. Berbonet al.,
(MRS Fall Meeting, Boston, 1999) 323–334.
17) A. Gholinia, P. B. Prangnell and M. V. Markushev: Acta Mater.48 (2000) 1115–1130.
18) A. Belyakov, T. Sakai, H. Miura and K. Tsuzaki: Philos. Mag. A81 (2001) 2629–2643.
19) Z. C. Wagn and P. B. Prangnell: Mater. Sci. Eng. A328(2002) 87–97. 20) P. J. Apps, J. R. Bowen and P. B. Prangnell: Acta Mater.51(2003)