Full title 1
Analyzing dialectal variation in articulation rate using crowdsourced speech data 2
3
Short title 4
Geospatial variation in articulation rate in Swiss German 5
6
Adrian Leemann 7
8
9
Phonetics Laboratory 10
Department of Theoretical and Applied Linguistics 11
University of Cambridge 12
Sidgwick Avenue 13
Cambridge, CB3 9DA 14
United Kingdom 15
+44 77 153 999 45 16
ABSTRACT 18
Most recent studies on the geographical distribution of acoustic features analyze comparatively 19
few speakers and localities, both of which may be unrepresentative of the diversity found in 20
larger or more spatially fragmented populations. In the present study we introduce a new 21
paradigm that enables the crowdsourcing of acoustic features through smartphone devices. We 22
used Dialäkt Äpp, a free iOS app that allows users to record themselves, to crowdsource audio 23
data. Nearly 3,000 speakers from 452 localities in German-speaking Switzerland provided 24
recordings; we measured articulation rates for these speakers using a metric based on duration 25
intervals between consecutive vowel onsets. Results revealed distinct regional differences in 26
articulation rate between major dialect regions and individual localities. The specification of 452 27
localities enabled analyses at an unprecedented spatial resolution. Results further revealed a 28
robust effect of gender, with women articulating significantly more slowly than men. Both the 29
geographical patterns and the effect of gender found in this study corroborate similar findings on 30
Swiss German previously reported in a very limited set of localities, thus verifying the validity of 31
the crowdsourcing framework. Given the application of this new framework, a large bulk of the 32
discussion is devoted to discussing methodological caveats. 33
34
ACKNOWLEDGMENTS 35
This research was supported by the Swiss NSF (grant nr. P300P1_151210, 36
http://p3.snf.ch/project-151210). We thank our colleague Beat Siebenhaar from the University of 37
Leipzig, who provided insight and expertise that greatly assisted the research. We thank Tam 38
Blaxter from the University of Cambridge for assistance with GIS, Yang Li for support on the 39
would also like to show our gratitude to Marie-José Kolly, Daniel Wanitsch, Iwar Werlen, Fiona 41
Hasler, and Carina Eisenblatt for co-developing Dialäkt Äpp, the tool that laid the basis for the 42
research presented. Any errors are our own and should not tarnish the reputations of the persons 43
acknowledged here. 44
1. INTRODUCTION 46
Speech rate can be measured in terms of speaking rate – the number of units, typically syllables 47
or words, and silent intervals produced in a given time – or articulation rate, the number of units 48
produced in a given time after silent intervals have been removed (Robb et al., 2004). Pauses and 49
silent intervals have been reported to exhibit distinct between-speaker variation (cf. Kolly et al., 50
2015), which is why articulation rate has been said to provide a more sensitive measure of 51
speech rate (Robb et al., 2004). Studies have demonstrated inherent speech rate differences 52
between languages as well as between varieties of the same language. Extensive research has 53
been conducted on within-language dialectal speech rate variation in English: Robb et al. (2004) 54
compared speaking and articulation rates of 40 New Zealand English (Christchurch) speakers to 55
40 American English (Connecticut) speakers and reports that NZ English speakers overall 56
articulated 30 syllables per minute faster. They report a higher degree of vowel reduction and 57
elision for the NZ English speakers. For American English dialects, Jacewicz et al. (2009) and 58
Jacewicz, Fox and Wei (2010) examined 192 speakers from two dialect regions, the North 59
(Wisconsin) and the South (North Carolina). Northerners showed significantly higher 60
articulation rates than Southerners, and men spoke slightly faster than women. In a more large-61
scale fashion – again within American English – Byrd (1994) studied the speaking rates of 630 62
speakers from eight different dialect regions. She found a significant effect of region, with 63
Southerners speaking the slowest and Northeasterners and Army Brats speaking the fastest. Byrd 64
(1994) also reports an effect of gender, with men speaking more than 6% faster than women, as 65
well as speaker-specific speech rates. 66
Differences in speech rate have been reported within other languages, too. Verhoeven et al. 67
in the Netherlands as well as four regions in northern Belgium (Flanders), providing evidence of 69
significant differences in articulation rate between the two countries: 5.05 syll/sec for the 70
Netherlands, and 4.23 syll/sec for Belgium. Men were also shown to speak more quickly than 71
women and younger speakers spoke somewhat more quickly than older ones. Schwab and 72
Avanzi (2015) investigated regional differences in speech rate in French varieties, examining 73
seven regions in France, Belgium, and Switzerland (eight speakers per variety); they report that 74
Swiss speakers, on average, have longer syllable durations (indicated in ms/syll). 75
Despite abundant anecdotal evidence that the German-speaking regions of Europe differ in 76
how quickly or slowly people speak, comparatively little scientific research has been devoted to 77
the spatial distribution of speech rate in varieties of German. Much of the research on speech rate 78
in German is found in applied fields, such as speech technology (Siebenhaar et al., 2001; 79
Trouvain, 2003) or forensic speaker identification (Jessen, 2007; Künzel, 1997). From a more 80
forensic angle, Jessen (2007), for example, provided an initial description of 100 male German 81
speakers’ average articulation rates. Mean articulation rate was reported to be 5.21 syll/sec in the 82
read condition and 5.41 and 5.19 syll/sec in the spontaneous conditions. A large bulk of the 83
literature on speech rate in German addresses methodological factors surrounding the 84
examination of speech rate (Kohler et al. 1981, 1982; Trouvain et al. 2001) or addresses speech 85
perception-related aspects of speech rate (Pfitzinger, 1998, 1999). Ulbrich (2004) presents one of 86
the few analyses on regional variation in articulation rate in German, examining the speech rate 87
of a total of 28 news reporters from Germany, Austria, and Switzerland based on read material. 88
She reports significantly higher syllable rates for the German reporters as opposed to the 89
Austrian reporters, with the Swiss nested between the two. The duration of pauses, too, exhibited 90
fewest pauses per sentence and the Swiss the most. Hahn and Siebenhaar (2016) provide a 92
preliminary study of regional variation in speech rate in German dialects. By examining speech 93
rate in two conditions – normal and fast reading speeds – with speakers from 67 localities (one 94
speaker per locality) across German-speaking Europe, they found a North/South divide in 95
articulation rate. The study is currently being expanded to include 1494 recordings from 192 96
localities across German-speaking Europe. With a particular focus on Swiss German varieties, 97
Leemann and Siebenhaar (2007, 2010) and Leemann (2012) have found that the dialects of Bern 98
(Northwest), Winterthur (Northeast), Chur (Southeast), and Brig (Southwest) differ in 99
articulation rate in spontaneous speech. Results from ten speakers per dialect revealed that 100
speakers from Winterthur and Brig articulated nearly one syllable per second faster than speakers 101
from Bern (5.8 syll/sec vs. 5.0 syll/sec). Chur German was nestled between the two extremes. 102
Leemann and Siebenhaar (2010) speculate that differences in phrase-final lengthening between 103
the dialects contribute to these findings: Bern German exhibited distinctly longer mean vowel 104
durations in all positions, but especially phrase-finally. 105
As this review indicates, the factors that affect speech rate are numerous, ranging from 106
regional affiliation to age, gender, speaker, and speaking style (with this list and literature review 107
being far from exhaustive; see Section 4). Some of the studies presented above used 108
comparatively small numbers of homogeneous speakers that may in reality be unrepresentative 109
of the diversity of speakers found in a larger population of a specific language. In the present 110
study we put forth a new paradigm for how prosodic features, including speech rate, can be 111
crowdsourced through smartphone devices. We present how this approach can yield area-112
covering geographical distributions of linguistic parameters, such as speech rate. We examine 113
data that was collected through the recording capability of smartphones. In a first proof-of-115
concept study, Leemann, Kolly and Dellwo (2014) presented a pilot of this new method: data 116
from 100+ Bern city and 200+ Zurich city German speakers, i.e., speakers in two localities, were 117
collected through Dialäkt Äpp (henceforth DÄ, Leemann & Kolly, 2013). Six recorded words per 118
speaker were analyzed for articulation rate, which was captured using a metric measuring 119
intervals between consecutive vowel onsets in disyllabic words. The shorter the duration, the 120
faster articulation rate; the larger the duration, the slower the articulation rate. Leemann, Kolly 121
and Dellwo (2014) robustly showed that the 300+ speakers of the two dialects differed in speech 122
rate: Bern German speakers articulated significantly more slowly than Zurich German 123
speakers, corroborating previous findings that exhibited the same trend (Leemann, 2007, 2012; 124
Leemann & Siebenhaar, 2010). They further reported differences between men and women, the 125
latter articulating more slowly. In the present contribution we expand this paradigm by applying 126
the interval measure on the full corpus presented in Leemann, Kolly and Dellwo (2014), i.e. 127
about 3,000 speakers from 452 localities. Before the predictions of this study are introduced, we 128
first provide relevant background information on the sociolinguistics of Swiss German and on a 129
number of technicalities concerning crowdsourcing speech parameters with smartphone 130
applications. 131
132
1.1. The linguistic situation in Switzerland 133
Switzerland has four official languages: German, French, Italian, and Romansh (Federal 134
Constitution of 1999, Article 4). However, the term ‘German’ does not adequately represent the 135
dialects of German-speaking Switzerland: the variety of German spoken is referred to as ‘Swiss 136
Statistics, 2016a). 63.3% of the Swiss population indicated German (incl. the dialects) as their 138
primary language (ibid.). Swiss German is comprised of a number of dialects that are not clearly 139
delineated (Lötscher, 1983). Commonly, lay people name the dialects according to the canton or 140
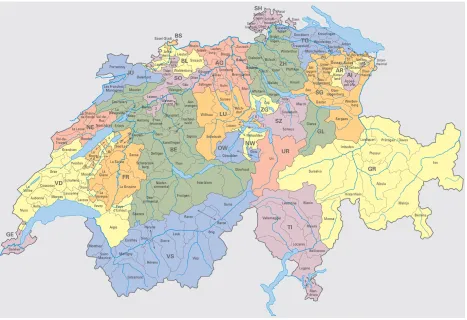
half-canton – administrative subdivisions – in which they are spoken. Figure 1 shows the 26 141
cantons of Switzerland along with major localities. Twenty-one of the cantons (incl. half 142
cantons) have German as an official language. Abbreviations for the cantons are explained in the 143
leftmost column of Table 1. 144
145
@@@INSERT FIGURE 1 HERE@@@ 146
147
French is spoken in the West, Italian in the South, and Rumansh in the Southeast. Typically, 148
mutual intelligibility is assured due to extensive dialect contact and exposure to the national mass 149
media. A majority (an estimated 60%) of Swiss National Television programs are broadcast in 150
dialect (Siebenhaar & Wyler, 1997). The language use situation is one of diglossia: both 151
Standard German and Swiss German dialects are used (Ferguson, 1959). The Standard variety 152
and a local vernacular coexist and each have their specific domains of application: dialect is the 153
common means of communication and meets high approval in society, to the point that it is 154
viewed as more prestigious than Standard German (Sieber & Sitta, 1986). The use of the 155
standard is largely restricted to writing and reading, as Swiss German does not have a formal 156
writing system. Contemporary technology, such as email and text messages, has fostered the use 157
of written Swiss German, characterized by idiosyncratic orthography (Christen, 2004). The oral 158
use of Standard German is restricted to school, mass media, and – most commonly – public 159
many dialects are stereotyped: Zurich German, for example, is perceived as fast. Bern German, 161
which has been dubbed Switzerland’s most popular regional variety (Schwarzenbach, 1969), is 162
perceived as very slow (Berthele, 2006; Ris, 1992; Werlen, 1978). 163
164
1.2. Crowdsourcing speech parameters with smartphone applications 165
‘Crowdsourcing’ refers to ‘the practice of obtaining needed services, ideas, or content by 166
soliciting contributions from a large group of people and especially from the online community 167
rather than from traditional employees or suppliers’ (Merriam-Webster, 2016). The use of 168
crowdsourcing applications for studying linguistic phenomena has received relatively little 169
attention until recently. This is extraordinary, given that iPhone microphones, for example, 170
feature wide frequency responses of 50Hz-20kHz that enable high-quality audio recordings 171
(faberacoustical, 2009). Even a first generation iPhone from 2007 has been shown to prove very 172
useful for speech analysis and enables reliable acoustic measurements – particularly for F1 and 173
F2 (De Decker & Nycz, 2011). A number of smartphone applications are in use or in 174
development for crowdsourcing linguistic data; for instance, Hughes et al. (2010) and de Vries et 175
al. (2014) developed Android applications as a means to collect speech for the training of 176
acoustic models, and Ma! Iwaidja (de Moiser 2016) is an application in development for the 177
purpose of documenting endangered languages. Such apps are primarily used for acoustic 178
modeling, dictionary building, text collection, translation, and dialect mapping. With DÄ we 179
present a novel method for crowdsourcing acoustic data to conduct large-scale spatial analyses. 180
181
The objective of the present study is to examine regional differences in articulation rate in Swiss 182
these purposes, a large bulk of the discussion will be dedicated to addressing methodological 184
caveats. Going into the study, we expected the geographical patterns emergent from our data to 185
corroborate previously reported evidence on speech rate variation in Swiss German, though in 186
this case such patterns would be be shown in significantly higher spatial resolution (452 187
localities) and with a much larger and a more representative dataset (nearly 3,000 speakers). 188
189
2. METHODS 190
191
2.1. iOS application: ‘Dialäkt Äpp’ 192
The data for the present paper was crowdsourced through DÄ (Leemann & Kolly, 2013). DÄ has 193
two core functionalities: on the one hand, users can localize their Swiss German dialect by 194
indicating their dialectal pronunciation of 16 words – that is, listening to pre-recorded items and 195
then tapping on the screen to select one. The app then tells users which dialects they most likely 196
speak. Secondly, users can anonymously record these 16 words in their dialect, re-listen to these 197
recordings, and listen to the recordings of other users by navigating an interactive map. Data 198
used in the current study stem from this second functionality. In this recording function, the user 199
interface prompts speakers first to indicate, i.e. self-declare, their dialect, out of 550 possible 200
localities mirroring those used in the Sprachatlas der Deutschen Schweiz (1962–2003) 201
(henceforth referred to as Atlas, 1962–2003) as well as their age and gender (Figure 2, left 202
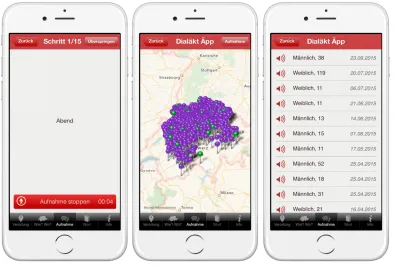
panel), before proceeding to the recording instructions (Figure 2, right panel). 203
204
@@@INSERT FIGURE 2 HERE@@@ 205
The right panel in Figure 2 reads: ‘Please record your voice in as quiet an environment as 207
possible. Keep an approximate distance of about 15 cm between your device and your lips. 208
Please articulate the text loudly and clearly in your own dialectal pronunciation’. Users then 209
record the tokens shown on the screen (see Figure 3, left panel). Recordings are anonymously 210
uploaded to servers where each audio file is given a unique ID. It is explained that in recording 211
their voices, the users consent to providing their acoustic data and information about their 212
dialectal origin, gender, and age (Figure 2, left panel). None of these pieces of information 213
individually or in combination allow for the identification of a user. Users also have the 214
opportunity to opt out of this procedure at any time (i.e. by clicking on ‘back’ in the top left 215
corner in Figure 2, left panel). This procedure for collecting and analyzing anonymous user data 216
conforms to the regulations of the Zurich cantonal ethics committee 217
(http://www.kek.zh.ch/internet/gesundheitsdirektion/kek/de/home.html) and the accompanying 218
federal laws on experimentation on humans in Switzerland 219
(http://www.admin.ch/opc/de/classified-compilation/20061313/index.html). Once their recording 220
has been uploaded, users can navigate to an interactive map of Switzerland (Figure 3, central 221
panel) where they can listen to their own recordings and those of other users (Figure 3, right 222
panel). 223
224
@@@INSERT FIGURE 3 HERE@@@ 225
226
In Switzerland, DÄ became the number one downloaded free app for iPhone after its release on 227
downloads. More than 3,000 users from all over German-speaking Switzerland have uploaded 229
voice recordings. 230
231
2.2. Material 232
For this study we selected six out of a total of 15 recorded DÄ words (see Section 2.1) for 233
analysis of speech rate. Each token consisted of two syllables, given that we were measuring the 234
temporal distance between adjacent vowel onsets (see Section 2.7). Half of our selected words 235
featured phonologically long vowels or diphthongs (as defined by their Middle High German 236
roots) while the other half featured historically short vowels. This distribution of long and short 237
vowels holds for nearly all of the 452 localities examined in the present study; only in the word 238
fragen does the Atlas (1962–2003, variable 140.10) document underlyingly short vowels in four 239
localities in the canton of Solothurn and four localities in the canton of Bern. The selected words 240
with underlying long vowels were Abend ‘evening’, Augen ‘eyes’, and fragen ‘to ask’; those 241
with short vowels were Donnerstag ‘Thursday’, heben ‘to lift’, and trinken ‘to drink’. Typical 242
articulations of these words in two dialects, Bern and Zurich German, are as follows: 243
244
Long vowels/diphthongs: 245
Abend: Bern German: [ˈɑːb̥ ə]; play audio file #1 here; Zurich German: [ˈɒːb̥ig̥]; play audio file 246
#2 here. 247
Augen: Bern German: [ˈɔug̥ ə]; play audio file #3 here; Zurich German: [ˈæug̥ ə]; play audio file 248
#4 here. 249
fragen: Bern German: [ˈfrɑːg̥ ə]; play audio file #5 here; Zurich German: [ˈfrœːg̥ ə]; play audio 250
Short vowels: 252
Donnerstag: Bern German: [ˈd̥ ɔnʃt̥i]; play audio file #7 here; Zurich German: [ˈd̥unʃt̥ig]; play 253
audio file #8 here. 254
heben: Bern German: [ˈlʏp͡fə]; play audio file #9 here; Zurich German: [ˈlup͡fə]; play audio file 255
#10 here. 256
trinken: Bern German: [ˈtrɪŋk͡xə]; play audio file #11 here; Zurich German: [ˈtriŋk͡xə]; play audio 257
file #12 here. 258
259
The vast majority of recordings were usable, i.e. demonstrated little background noise 260
interference. Instances of unfavorable audio quality or otherwise unusable material were 261
discarded from the analysis (with approximately 5–10% discarded tokens, cf. Leemann et al., 262
2015). The word heben (‘to lift’) has much fewer recordings than the other five words (cf. Table 263
1) because the prompt was frequently misinterpreted as meaning ‘to hold’ and thus articulated as 264
[ˈhɛb̥ ə], whereas we intended to elicit [ˈlup͡fə], i.e. ‘to lift up’. lupfen, however, is not a word in 265
Standard German, which is why would we would not have been able to use lupfen as a prompt. 266
267
2.3. Localities
268
Users who submitted the information described in Section 2.1 served as subjects. Figure 4 shows 269
the total of 452 localities represented in the current study. The map only shows German-speaking 270
Switzerland. Each locality is illustrated with a yellow dot, with Bing areal used as a base map on 271
QGIS (QGIS, 2016). 272
273
The white lines in Figure 4 denote canton borders. The net of localities is quite evenly spread 275
across German-speaking Switzerland. Alpine areas, e.g. the Southeast and Southwest, are not as 276
densely captured as the Midland areas (in particular the cantons of Bern, Aargau, and Zurich), 277
reflecting their lower population densities. 278
279
2.4. Speakers
280
The number of recordings analyzed varied for each of the six words, since not all speakers read 281
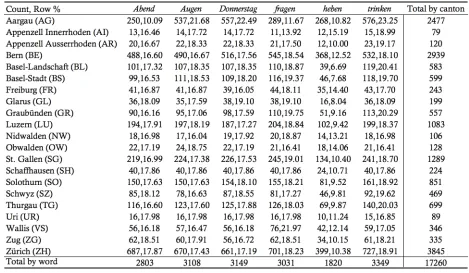
all of the presented words. Table 1 shows the number of recordings for each word by canton as 282
well as the percentage for each word by canton; this sums to 100% for each canton from left to 283
right. 284
285
@@@INSERT TABLE 1 HERE@@@ 286
287
The number of recordings ranged from 1,820 for heben ‘to lift’ to 3,149 for Donnerstag
288
‘Thursday’. Relative proportions of words varied between the cantons (X2=265, p<.0001***): 289
the word with the highest number of tokens in Aargau, for example, was trinken (N=576, 290
23.25%), while in Bern this was fragen (N=545, 18.54%). Altogether, the database consists of 291
17,260 audio recordings. Figure 5 shows the number of recordings, pooled for all words, for each 292
canton – each dot represents one locality; Figure 6 shows the number of recordings for each of 293
the 452 localities. The categorizations in Figures 5 and 6 are based on five and ten natural breaks 294
(Jenks). Polygons in Figure 6 are Voronoi polygons (10 buffer). Layers that demarcate the 295
German-speaking area of Switzerland were retrieved from the Federal Department of Statistics 296
recordings (N=3,845), followed by the cantons of Bern (N=2,939) and Aargau (N=2,477). This 298
is unsurprising, as the major hubs of Zurich, Bern, Aarau, and Baden have some of the highest 299
populations in German-speaking Switzerland. Central Swiss cantons like Uri (N=89) or 300
Obwalden (N=128) have comparatively few respondents. Overall, there is an evident bias toward 301
urban, Midland regions with more respondents than Alpine or central Swiss localities. 302
303
@@@INSERT FIGURE 5 HERE@@@ 304
305
@@@INSERT FIGURE 6 HERE@@@ 306
307
2.5. Gender
308
Overall, 48.55% of the recordings were from women and 51.45% from men. Table 2 shows the 309
distribution of recordings by gender and canton. 310
311
@@@INSERT TABLE 2 HERE@@@ 312
313
The ratio of women to men differed between the cantons (X2=218, p<.0001***). Uri, for 314
example, supplied 21.35% recordings from women and 78.65% from men. Aargau, on the other 315
hand, demonstrate the opposite trend with 58.26% of recordings from women and 41.74% from 316
men. Figure 7 shows the relative percentage of recordings for each canton as % female. The five 317
categories are based on equidistant breaks. The majority of cantons feature a percentage of 43.5– 318
disproportionate numbers of female respondents (dark red). Uri and Nidwalden in Central 320
Switzerland demonstrate a lower proportion of female speakers (yellow or bright orange). 321
322
@@@INSERT FIGURE 7 HERE@@@ 323
324
2.6. Age
325
On average, speakers were 31.4 years old (SD=15.97); the median age was 28, with a range from 326
5 to 89 (upper quartile: 43; lower quartile: 18). Datasets with age indications below 5 or above 327
89 were not included; it is likely that these speakers were not felicitous when answering the 328
questionnaire. Figure 8 shows the distribution of ages. 329
330
@@@INSERT FIGURE 8 HERE@@@ 331
332
The relatively low age mean and median were expected, given that apps particularly target a 333
younger audience. 334
335
2.7. Procedure
336
Traditionally, speech rate has been assessed by measuring a given linguistic unit per second 337
(such as words, syllables, segments, consonantal intervals, and vocalic intervals; cf. Roach, 338
1998). Since the DÄ corpus contains words that exhibit cross-dialectal differences in syllable 339
structure (e.g. Abend: Bern German V.CV [ˈɑːb̥ ə] vs. Zurich German V.CVC [ˈɒːb̥ig̥], for 340
example, or Donnerstag: Bern German CVC.CCV [ˈd̥ ɔnʃt̥i], vs. Zurich German CVC.CCVC 341
syllables per second. Instead, we measured the temporal duration between the two vowel onsets 343
in these disyllabic words. P-Center theory motivates this choice of measure: Allen (1972) 344
examined the perceived location of stress in spontaneous speech by having subjects assess where 345
in the signal they perceived rhythmic beats. He found that stress beats were closely associated 346
with the onsets of vowels in stressed syllables, thus representing perceptually prominent syllable 347
centers. What Allen (1972) called ‘stress beats’, Morton, Marcus and Frankish (1976) deemed 348
‘P-centers’ – psychological moments of occurrence of a word. Both Allen (1972) and Morton, 349
Marcus and Frankish (1976) found that the perceived beat of a syllable was located near the 350
onset of voicing of the vowel in the stressed syllable. However, perception of the beat is pushed 351
earlier as a function of the length of the preceding onset consonant cluster (the longer the cluster, 352
the earlier the percept of the beat), and later as a function of the length of the syllable coda 353
(Cummins & Port, 1998). The measure applied here – the temporal distance between the vowel 354
onsets in disyllabic words – we call durVonVon (cf. Leemann, Kolly & Dellwo, 2014), duration
355
of vowel-onset-to-vowel-onset. Ideally, all of the six words used would have featured the same 356
consonants in the first syllable onset and the same consonants in the second syllable coda. For 357
practical reasons, this was not realistic. Figure 9 shows a schematic of the measurement 358
technique applied in the present study. 359
360
@@@INSERT FIGURE 9 HERE@@@ 361
362
Figure 9 shows the oscillogram of a Bern German speaker articulating fragen as [ˈfrɑːg̥ə] (see 1st 363
tier – play audio file #13 here). The 2nd tier shows the boundaries placed at the vowel onsets, and 364
two syllabic beats; the longer the measure, the slower the rate. Altogether there were 17,260 366
measurement points (34,520 boundaries). durVonVon was measured in Praat (Boersma & 367
Weenink, 2016). All labeling was carried out manually by trained phoneticians. 368
Data were analyzed using R (R Core Team, 2016) and the R packages lme4 (Bates & 369
Maechler, 2009) and languageR (Baayen, 2008, 2009). Unless indicated otherwise, we analyzed 370
data using linear mixed effect models. Normality was checked by visual inspection of quantile 371
plots. Effects were tested by model comparison between a full model, in which the factor in 372
question is entered as an effect, and a reduced model without this effect. We obtained p-values 373
by comparing the results from the two models using standard ANOVAs. Only p-values that are 374
considered significant at the α=0.05 level are reported. We used QGIS (QGIS, 2016) for the 375
spatial visualization of speech rate and count data. 376
377
3. RESULTS 378
Section 3.1 presents findings on the individual words, 3.2 on effects of gender, 3.3 on age, 3.4 on 379
the cantons, and 3.5 on individual localities. 380
381
3.1. Word 382
We ran a linear model that tested for the effect of WORD (six levels). The models were computed
383
as model_full<-lm(durvonvon ~ gender + canton + age + word, data=dataX); model_reduced<-384
lm(durvonvon ~ gender + canton + age, data=dataX). The differences between the two models, 385
as established by a simple ANOVA comparing the two models, was significant (p<.0001***). 386
The lowest estimated durVonVon (as retrieved from the model output of the full model) was 387
the default level, which is why we report the raw mean and standard deviation – raw 389
mean=0.3427, SD=0.0787), Augen (estimated mean=0.370, SE=0.0019), heben (estimated 390
mean=0.374, SE=0.0021), trinken (estimate=0.408, SE=0.002), and Donnerstag (estimate=0.45, 391
SE=0.0018). Table 3 shows the coefficients of the linear model, using WORD as a fixed factor.
392
393
@@@INSERT TABLE 3 HERE@@@ 394
395
3.2. Gender 396
We then tested for an effect of GENDER(two levels), using the model specified here:
397
model_full<-lmer(durvonvon ~ gender + canton + age + (1|word), data=dataX); 398
model_reduced<-lmer(durvonvon ~ canton + age + (1|word), data=dataX); i.e. with WORD as a
399
random effect. An ANOVA revealed significant differences between the two models. The 400
estimated mean for men was 0.374 (SE=0.001105), the raw mean of women 0.389 (SD=0.0863). 401
Women overall spoke significantly more slowly than men (see Table 3). 402
403
3.3 Age 404
We tested for an effect of AGE with the same full model used in 3.2. The comparison to the
405
reduced model (which excludes AGE as a fixed effect) revealed a significant effect (p=.00315**).
406
The scatterplot shown in Figure 10 shows durVonVon as a function of AGE; Table 3 shows the
407
coefficient obtained for the factor AGE.
408
409
@@@INSERT FIGURE 10 HERE@@@ 410
The regression line in Figure 10 suggest a marginal linear relationship between the two variables: 412
the older the speaker, the lower durVonVon, i.e. the slower the speech rate. 413
414
3.4 Canton 415
To test for an effect of CANTON (21 levels), we ran the same model used in 3.2. The comparison
416
to the reduced model (excluding CANTON as a fixed effect) was highly significant (p<.0001***).
417
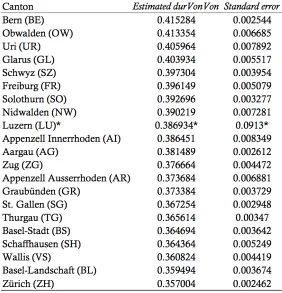
We interpret this as evidence of distinct variation in articulation rate between the cantons. Table 418
4 shows the estimated durVonVon scores and standard errors for each canton in descending 419
order, as retrieved from the full model output. We used the values of the canton of Lucerne as the 420
default level, as it exhibits a nearly balanced 50%/50% distribution of males and females in the 421
dataset (see Table 2). Therefore, the values for Lucerne in Table 4 are the raw mean durVonVon
422
and standard deviation (marked with ‘*’ in Table 4). 423
424
@@@INSERT TABLE 4 HERE@@@ 425
426
The canton of Bern exhibits the lowest speech rates (as indicated by the high estimated 427
durVonVon scores), followed by Obwalden, Uri, Glarus, and Schwyz. At the other end of the 428
spectrum is the canton of Zurich with the lowest scores (i.e. fastest speech rates), followed by 429
Basel-Landschaft, Valais, Schaffhausen, and Basel Stadt – as well as much of Eastern 430
Switzerland. Figure 11 shows the overall distribution of durVonVon by German-speaking 431
cantons (averaged over all recordings for each canton), using seven natural breaks (Jenks). The 432
effects). The bluer the canton, the faster the articulation rate; the greener the canton the slower 434
the articulation rate. 435
436
@@@INSERT FIGURE 11 HERE@@@ 437
438
3.5 Locality 439
In this section we turn to more localized articulation rate differences in Swiss German dialects. 440
Because AGE, GENDER,and WORD are all confounds in our analyses of the geographical
441
distribution of articulation rate, we again present estimated durVonVon values for the localities. 442
These values are adjusted for all the effects in the model, retrieved from model_full<-443
lmer(durVonVon ~ gender + city + age + (1|word), data=dataX). Figure 12 shows the estimated 444
durVonVon scores for each of the 452 localities, thus depicting more fine-grained differentiation 445
and spatial resolution for the individual localities than Figure 11. We used Voronoi polygons (10 446
buffer), showing eight natural breaks (Jenks). We applied a nearest neighbor normalization that 447
averages each estimated durVonVon with the ten geographically nearest neighbors (Blaxter, 448
2016). Cantons are shown to differ as to the homogeneity of rates in the individual localities: in 449
the canton of Zurich, for example, it seems that the localities examined uniformly exhibit 450
similarly fast articulation rates, as indicated by virtually all blue-colored polygons. In the western 451
canton of Aargau, however, we find a hybrid, with the East articulating much faster than the 452
West. The canton of Bern seems to be relatively homogeneous as well, though not as 453
homogenous as the canton of Zurich; the former, however, spans a much vaster area (5,959 km2, 454
vs. 1,729 km2 in the canton of Zurich). To show these local patterns in more detail, Figures 13 455
@@@INSERT FIGURE 12 HERE@@@ 457
458
@@@INSERT FIGURE 13 HERE@@@ 459
460
@@@INSERT FIGURE 14 HERE@@@ 461
462
Figure 13 reveals relatively fast articulation rates for Zurich across all the major sub-dialect 463
regions in Zurich (cf. Weber & Dieth, 1987): this includes city dialect speakers, including Zurich 464
city, Rümlang, Utikon, Stallikon, Zumikon, and Bassersdorf, as well as the Unterländer dialects 465
(Windlach, Glattfelden, Niederweningen) and Oberländer dialects (Pfäffikon, Bäretswil, 466
Fischenthal). The dialect regions around Winterthur also exhibit relatively fast articulation rates. 467
There are a few exceptions to this pattern: Neftenbach, Uster, and Maur exhibit somewhat slower 468
articulation rates. When looking at the adjacent canton, Aargau, it is noticeable that southwestern 469
localities (e.g. Oftringen, Zofingen, Safenwil, Brittnau) tend to have slower articulation rates 470
than, for example, places in the center or or east of the canton such as Birr, Niederrohrdorf, and 471
Würenlos. The geographical patterning of speech rate is much more heterogeneous than in 472
Zurich. Figure 14 reveals a less heterogenous pattern for the canton of Bern as well, though 473
speech rate seems to be somewhat more coherently distributed across the localities than in 474
Aargau: for localities such as Blumenstein, Ried, Thun, and Seftigen – towards the Bernese 475
Oberland – we find very slow articulation rates. Localities such as Köniz, Rosshäusern, or 476
Grindelwald reveal somewhat faster articulation rates. The northwest part of the canton in 477
general – including Bern – seems to exhibit somewhat slower rates than in the northeast or the 478
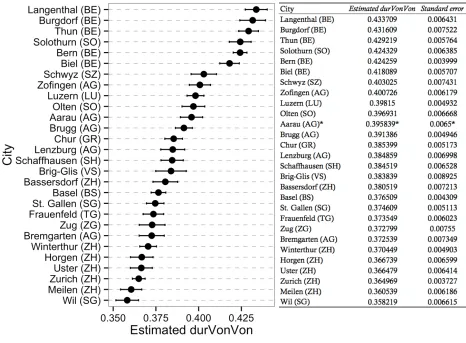
more closely investigate individual cities, Figure 15 and Table 5 show the estimated durVonVon
480
as well as standard errors for major cities in German-speaking Switzerland. For this data, no 481
nearest neighbor smoothing was applied. Only cities for which there were at least 100 recordings 482
are shown; Brig-Glis is included to represent Southwestern Switzerland despite having only 68 483
recordings in total. We used the values of Aarau as the default level, which is why we report raw 484
means and standard deviations in Table 5, not estimated means and the standard errors (marked 485
with ‘*’). The estimated means are shown in descending order, i.e. cities with the lowest 486
articulation rates appear on top and those with highest rates at the bottom. 487
488
@@@INSERT FIGURE 15 AND TABLE 5 HERE@@@ 489
490
The slowest articulation rates in cities with more than 100 recordings are found in Langenthal 491
(Bern), Burgdorf (Bern), Thun (Bern), and Solothurn (Solothurn), all of which exhibited 492
estimated means larger than in Bern (Bern) – i.e. with slower rates than the city of Bern. The 493
fastest articulation rates in major cities show up in Wil (St. Gallen), Meilen (Zurich), Zurich 494
(Zurich), and Uster (Zurich). All of these localities are in the canton of Zurich or St. Gallen. 495
Chur (Graubünden), in Southeastern Switzerland, is found to articulate neither especially slow or 496
especially fast. Brig-Glis (Valais) seems to have rather fast speech, but again does not lie at 497
either extreme. 498
499
4. DISCUSSION 500
Based on a controlled set of words spoken by a large number of speakers, the current study found 501
effect of WORD, GENDER, and AGE. Here we discuss the findings in the same sequence as
503
presented in Section 3. Because we used a new methodological paradigm of collecting speech as 504
a basis for analyzing the geographical distribution of articulation rate, a large bulk of this 505
discussion is devoted to critical reflection on this new methodology. 506
507
4.1. Word, gender, and age 508
In Section 3.1, we presented the effect of WORD; the highest estimated means of durVonVon were
509
found for Donnerstag, followed by trinken, heben, Augen, Abend, and fragen. This effect was 510
expected, as the number of consonants differed between the measured interval durations. Typical 511
realizations of the six words in question are shown below for Bern German, in descending order 512
of durVonVon. We also show the syllable structure of these prototypical realizations; affricates 513
and diphthongs are counted as two segments each. On the very right we present the number of 514
segments over which durVonVon – the interval duration of vowel onsets in disyllabic words 515
– spans. 516
517
Donnerstag [ˈd̥ ɔnʃt̥i] – CVC.CCV – 4 segments 518
trinken [ˈtrɪŋk͡xə] – CCVC.CCV – 4 segments 519
heben [ˈlʏp͡fə] – CV.CCV – 3 segments 520
Augen [ˈɔug̥ ə] – VV.CV – 3 segments 521
Abend [ˈɑːb̥ ə] – VV.CV – 3 segments 522
fragen [ˈfrɑːg̥ ə] – CCVV.CV – 3 segments 523
VC.CC sequences resulted in the highest scores of durVonVon, followed by V.CC and VV.C. 525
This adds to the growing body of literature that shows the sensitivity of speech rate not only to 526
different styles (such as in read vs. spontaneous speech, with read speech frequently showing 527
slower rates given fewer reductions; Crystal & House, 1982; Jacewicsz et al., 2009) but also to 528
speech material. Similarly, Quené (2008) has shown that articulation rate is strongly affected by 529
the length of the phrase in Dutch; speakers shorten syllables when they anticipate more syllables 530
in a phrase, a process known as anticipatory shortening. Because WORD was a confounding factor
531
when examining regional difference in articulation rate, we used estimated means when plotting 532
regional patterns in Sections 3.4 and 3.5. 533
Our results further revealed a robust effect of GENDER, with women overall exhibiting lower
534
articulation rates than men. A number of studies have shown similar trends in British English 535
(Whiteside, 1996) and American English dialects (Byrd, 1994; Jacewicz et al., 2009). Simpson 536
(1998) has also demonstrated that in German, the durations of women’s vowels are 537
systematically longer than men’s. This finding may be connected to the fact that women tend to 538
be more preoccupied with status, making greater use of social capital mediated through the 539
manipulation of socially marked features of speech (Trudgill, 1972). Women may be more likely 540
to attempt to avoid speaking quickly because they do not view speaking quickly as having overt 541
prestige. Our results in Section 3 further revealed an effect of AGE, with a relatively weak trend
542
of increased age suggesting a lower durVonVon score, i.e. speaking faster. This weak effect may 543
be an artifact of the large data set we are using (cf. Kilgarriff, 2005); it is not consistent with 544
previous findings, which have shown that elderly speakers tend to articulate more slowly than 545
younger speakers (Quené, 2008; Yuan, Cieri & Liberman, 2006). Given that both GENDER and
AGE revealed significant effects in the models calculated, we adjusted the means in the
547
geographical distribution of articulation rate accordingly in Figures 11–15. 548
549
4.2. Regional differences 550
Section 3 revealed distinct regional differences in articulation rate at both the canton and 551
individual locality scale. Given that durVonVon is a rather abstract measure of articulation rate, 552
let us extrapolate these results to a more realistic scenario for illustrative purposes: say, having 553
speakers from Bern, Zurich, Valais, Obwalden, and Basel-Landschaft German each read Aesop’s 554
fable ‘The North Wind and the Sun’. The fable consists of 129 syllables, i.e. 128 vowel-onset-to-555
vowel-onset intervals (if we take Zurich German as an example, cf. Fleischer & Schmid, 2006). 556
Based on the findings of the current study (as shown for each canton in Table 4), disregarding 557
contextual factors such as phrase-final lengthening, differences in style, between-speaker 558
differences in reading fluencies, pauses and so on, the Bern German speaker should take 53.15 559
seconds to read the text, the Obwalden speaker 52.9 seconds, the Valais speaker 46.18 seconds, 560
Basel-Landschaft 46.01 seconds, and Zurich only 45.69 seconds. The findings of the current 561
study reveal that the temporal information contained in a few isolated words alone is sufficient to 562
tell apart the dialects on a cantonal level. 563
These findings, however, need some form of quality control given the noisy nature of the 564
data. To scrutinize the validity of these results, we can compare them to those of previous studies 565
that have examined speech rate across a few Swiss German localities. As mentioned earlier, 566
based on the analyses of the spontaneous speech of ten speakers per locality, Leemann & 567
Siebenhaar (2007, 2010) and Leemann (2012) reported that speakers from Winterthur (Zurich) 568
5.0 syll./sec). They further found that speakers of Brig (Valais) articulated as quickly as Zurich 570
German speakers (5.8 syll./sec), with speakers from Chur (Graubünden) between these two 571
extremes (5.2 syll./sec). Our current data largely mirrors this trend for these four cantons. For 572
Graubünden, the present study does not reveal as slow articulation rates as reported in the 573
previous studies; however, overall, speech rates captured by the two methods thus seems to be 574
robustly related, underscoring the validity of the crowdsourcing method applied. 575
The strength of the current study is its very high, indeed unprecedented, spatial resolution for 576
the distribution of articulation rate across 452 localities. In sum, our results demonstrate three 577
previously unreported trends in the distribution of speech rates in Swiss German: 578
579
(a) An East/West divide: Eastern Swiss German dialects have quite rapid articulation 580
rates, from the North (Schaffhausen) down to Zurich, Thurgau, and St. Gallen; 581
speakers in St. Gallen demonstrate slower rates the further south in the canton. The 582
southeastern canton Graubünden overall exhibits somewhat slower articulation rates 583
long with much of the West; Basel and its urban areas as well as the western part of 584
Valais exhibit the fastest articulation rates in Western Switzerland. 585
586
(b) Aargau – lying in the crossover zone between the East and the West – is clearly 587
split into localities that speak more quickly in the East (bordering the canton of 588
Zurich) and localities in the West, particularly in the Southwest, that speak much 589
more slowly (bordering the canton of Bern). 590
(c) Not only Bern German exhibits particularly slow speech rates, but also speech in 592
a large number of central Swiss localities in Obwalden, Uri, Glarus, and Schwyz. 593
594
The East/West divide found in speech rate in the current dataset aligns with other linguistic 595
isoglosses separating the East from the West: phonetically, this divide is reflected in the degree 596
of opening in vowels – with more closed vowels in the East, e.g. [oː] (e.g. ‘bread’ Zurich 597
German [b̥roːt], Bern German [b̥rɔːt]), [ɛ] (‘to die’ Zurich German [ʃtɛrb̥ ə], Bern German 598
[ʃtærb̥ ə]), and [e] (‘bed’ Zurich German [b̥et], Bern German [b̥ ɛt]). The divide is also apparent in 599
morphological features: plural forms of verbs, for example, pattern homogeneously in the East, 600
while Western Swiss German dialects use a more differentiated plural system (Siebenhaar & 601
Wyler, 1997). This East/West contrast is frequently referred to as the Brünig-Napf-Reuss line, 602
reflecting not only linguistic but also cultural contrasts such as the use of different decks of 603
playing cards (French versions in the West, German in the East) (Weiss, 1947). The line cuts 604
through the canton of Aargau, almost exactly as found in our data. These differences between the 605
two dialect regions show the influence of the past 200–500 years of political history, especially 606
regarding the political and linguistic influence of Bern and Zurich on their hinterlands (Lötscher, 607
1983). Siebenhaar (2000) has robustly shown that Aarau, the capital city of Aargau, uses 608
phonetic features that are typical for Eastern and Western Swiss German dialects. 609
More generally, it has been claimed that speech rate may have urban/rural correlates (cf. 610
Hewlett & Rendall, 1998; Jacewicz et al., 2009). Hewelett and Rendall (1998) did not find a 611
robust effect of speech rate between their urban (Edinburgh) vs. rural (Orkney Islands) speakers, 612
failing to find evidence for the usual stereotype of faster urban speakers and slower rural 613
many in Valais in the Southwest and many Eastern Swiss German localities articulate 615
comparatively fast. The urban area around Bern, in turn, has quite slow speakers. Figure 15 616
demonstrates how urban centers can range from very slow (e.g. Langenthal, Burgdorf, and Thun) 617
to very quick articulation (as in Zurich, Meilen, and Wil). 618
As for potential linguistic explanations for the differences in speech rate, Leemann & 619
Siebenhaar (2010) speculated that the Bern/Zurich contrast may lie in differences in how 620
speakers behave in terms of phrase-final lengthening; they report Bern German speakers to 621
produce distinctly longer mean duration of vowels particularly in phrase-final position. However, 622
overall mean vowel durations were longer in Bern German as well. Potentially, in reading 623
isolated words out loud, speakers may have been treating the utterances as if they were isolated 624
sentences. In the future, more linguistically-driven analyses might better establish why the 625
dialects pattern geographically the way they do. Kohler (2001) notes, for example that the 626
realization particularly of unstressed syllables seems to heavily contribute to regional variation. 627
628
4.3. Methodological caveats 629
Given the novelty of our paradigm for crowdsourcing regional articulation rate distributions, a 630
number of methodological issues merit further discussion. Both the use of durVonVon as a 631
metric as well as the use of isolated words as speech material must be discussed further. In 632
addition, the user’s self-declared dialect serves as the basis for the analysis of speech rate, and 633
this is not without problems. Finally, some general methodological concerns in using mobile 634
applications to crowdsource speech data deserve further mention. 635
durVonVon is a metric that – to our knowledge – has not been used before except for the 636
comparisons to previous studies such as Leemann and Siebenhaar (2007, 2010) and Leemann 638
(2012) need to be taken with a grain of salt. The latter used the conventional measure of syllables 639
per second to quantify articulation rate despite the confound of syllable structures differing 640
between the Swiss German dialects examined (Keller, 2008). The durVonVon metric provides a 641
new approximation of speech rate in the examination of between-dialect differences, and is 642
especially useful if the dialects exhibit the same syllable structures for the words in question. For 643
the six words we examined, this is the case in the vast majority of dialects. There are a few 644
exceptions, however: in the word trinken, Bernese Oberland, Southern Fribourgeois localities, 645
the Valais, and a number of localities in the southeast of the canton of Graubünden would not use 646
[ˈtrɪŋk͡xə] (with dialect-specific alternations of vowel quality) but rather [ˈtrɛːxə] (again, with 647
dialect-specific alternations of the vowel). The elision of nasals before homorganic fricatives and 648
the lengthening or diphthongization of the preceding vowel is referred to as Staub’s Law (Staub, 649
1874). This phonological process triggers a change in syllable structure, which affects the Cs and 650
Vs captured by durVonVon: trinken without Staub’s law applied would be 651
[ˈtrɪŋk͡xə] – CCVC.CCV – with 4 segments, while trinken with Staub’s Law applied would be 652
[ˈtrɛːxə] – CCVV.CV – with 3 segments; the underlined Cs and Vs would be captured by 653
durVonVon (if affricates and diphthongs are again counted as two segments each). In a pilot 654
study, Werlen (2012) examined the effect of Staub’s Law on the temporal structure of words in 655
eight Swiss German dialects. He reported that the relative duration of the vowel + nasal (Staub’s 656
Law not applied) as a percentage of the word duration, i.e. normalized for speech rate, was not 657
significantly different in duration from the lengthened monophthong/diphthong (Staub’s Law 658
applied) as a percentage of the word duration. Not only is the use of durVonVon new, but also 659
never before been done. Using isolated words is unusual in the sense that normally, analyses of 661
speech rate involve spontaneous speech and/or read speech (see literature review). Reading 662
isolated words is, in a sense, situated between reading and spontaneously speaking: the word 663
appears on the screen and triggers an immediate articulation which does not involve a significant 664
amount of planning or cognitive performance as is required in reading. Traditional dialectology, 665
though, has long relied on the observation of single, isolated words in lists. 666
A second issue is the user’s self-declaration of dialect. As mentioned in Section 2.1 (Figure 2, 667
left panel), users manually indicated their age, gender, and dialect before recording the audio. 668
This self-declaration of dialect forces us to assume that users have an understanding of their own 669
linguistic origins (Leemann et al., 2016). It is conceivable, however, that users tried to imitate a 670
more ‘model’ target dialect when doing the audio recordings, perhaps because they felt it would 671
sound more prestigious. This, in turn, would cause speakers to be more homogeneous than is 672
really the case. Labov (1996) has shown that lay speakers have relatively poor intuitions about a 673
number of aspects of their own non-standard dialect use, however. The results presented here 674
need to be interpreted against the background of this limitation. 675
There are some more general limitations to using crowdsourced audio data that must be 676
further addressed. For one, speakers may have submitted audio recordings multiple times 677
(Birnbaum, 2004): app-based research allows for multiple submissions, and we as researchers do 678
not know whether a speaker used the app to participate repeatedly or used the app on multiple 679
smartphones. Reips (2002) found, though, that the rate of repeated participation does not seem to 680
pose a relevant threat to the trustworthiness of app-based research, given that it is <3% in the 681
studies investigated. Secondly, a sampling bias underlies the results of the current study: only 682
was deemed most useful as the vast majority of smartphone users were iOS users. Targeting 684
these users only, of course, means neglecting a potentially different social substratum who favor 685
devices running Android or other platforms. Thirdly, the audio recordings collected may feature 686
a response bias in that the order in which the words were presented was not randomized; the 687
word trinken appeared last in the 15 words presented to users. Since users are essentially reading 688
off a list of words (with each word shown on the screen in isolation), the dataset could possibly 689
feature particularly distinct vocalic lengthening of the /i/ of trinken. Finally, the trustworthiness 690
of participants in web or app-based crowdsourcing is often cited as a problem (McGraw, 2013). 691
How are researchers to know that they are being given meaningful responses from the crowd? 692
There are, however, clear benefits that – in our opinion – balance out the limitations. For 693
instance, subject recruitment involves very low costs; conducting this experiment with paid 694
researchers going to 452 localities to elicit several speakers per locality would have been very 695
expensive. 696
697
5. CONCLUSIONS 698
This study set out to determine articulation rate differences between dialects using a large, 699
crowdsourced audio database of roughly 3,000 speakers. The most obvious finding to emerge is 700
that Swiss German dialects exhibit distinct regional patterns in speech rate. Previous studies 701
examining only a handful of the dialects scrutinized here validate our results. The results of this 702
research thus support the idea that smartphone apps enabling audio recordings can provide a 703
valid alternative for collecting audio data. The principal strength of this approach is its high 704
spatial resolution; no other study has shown this degree of precision, using hundreds of localities, 705
countless possible speech prosody or phonetic variables for which a crowdsourcing approach can 707
provide new and useful insights. Indeed, the present region-wide DÄ corpus enables further 708
analyses of the spatial distribution of formant frequencies, intonation patterns, and speech 709
rhythm properties, to name just a few examples. Such phenomena can be explored multi-710
dimensionally, enabling us to test for effects of speaker, age, and gender in addition to 711
geographical distribution. Crowdsourcing applications for British English have just been released 712
for iOS and Android (Leemann, Kolly & Britain, 2016) inspired by the DÄ framework. Future 713
analyses with this corpus are planned, modeled on those done for DÄ. 714
715
6. REFERENCES 716
Allen, G. D. 1972. The location of rhythmic stress beats in English: An experimental study I. 717
Language and Speech 15. 72-100. 718
App Annie. 2013. http://www.appannie.com/ (19 April 2016). 719
Baayen, R. H. 2008. Analyzing Linguistic Data: A Practical Introduction to Statistics Using R. 720
Cambridge: Cambridge University Press 721
Baayen, R. H. 2009. languageR: Data sets and functions with “Analyzing Linguistic Data: A
722
practical introduction to statistics using R”. R package version 0.955. 723
Bates, D. M. & M. Maechler. 2009. lme4: Linear mixed-effects models using S4 classes. R 724
package version 0.999375-32. 725
Berthele, R. 2006. Wie sieht das Berndeutsche so ungefähr aus? Über den Nutzen von 726
Visualisierungen für die kognitive Laienlinguistik. In H. Klausmann (ed.), Raumstrukturen
727
im Alemannischen. Beiträge der 15. Arbeitstagung zur alemannischen Dialektologie,
728
Birnbaum, M. H. 2004. Human research and data collection via the Internet. Annual Review of
730
Psychology. 55. 803-832. 731
Blaxter, T. 2016. Geospatial temporal visualisation. Manuscript draft. Cambridge, UK: 732
University of Cambridge Ph.D. thesis. 733
Boersma, P. & D. Weenink. 2016. Praat: doing phonetics by computer. http://www.praat.org/
734
(19 April 2016). 735
Byrd, D. 1992. Preliminary results on speaker-dependent variation in the TIMIT database. 736
Journal of the Acoustical Society of America 92(1). 593-596. 737
Christen, H. 2004. Dialekt-Schreiben oder sorry ech hassä Text schribä. In E. Glaser, P. Ott & R. 738
Schwarzenbach (eds.), Alemannisch im Sprachvergleich: Beiträge zur 14. Arbeitstagung
739
für alemannische Dialektologie in Männedorf (Zürich) vom 16.–18.9.2002, 71-87. 740
Stuttgart: Franz Steiner. 741
Crystal, T. H. & A. S. House. 1982. Segmental durations in connected speech signals: 742
Preliminary results. Journal of the Acoustical Society of America 72. 705-716. 743
Cummins, F. & R. Port. 1998. Rhythmic constraints on stress timing in English. Journal of
744
Phonetics 26(2). 145-171. 745
De Decker, P. & J. Nycz. 2011. For the Record: Which Digital Media Can be Used for 746
Sociophonetic Analysis? University of Pennsylvania Working Papers in Linguistics 17(2). 747
51-59. 748
de Moiser, M. 2016. Ma! Iwaidja. https://itunes.apple.com/au/app/ma-749
iwaidja/id557824618?mt=8 (19 April 2016). 750
faberacoustical. 2009.
http://blog.faberacoustical.com/2009/ios/iphone/iphone-microphone-751
Federal Department of Statistics. 2016a. 753
http://www.bfs.admin.ch/bfs/portal/de/index/themen/01/05/blank/key/sprachen.html (19 754
April 2016). 755
Federal Department of Statistics. 2016b. 756
http://www.bfs.admin.ch/bfs/portal/de/index/dienstleistungen/geostat/datenbeschreibung/g
757
eneralisierte_gemeindegrenzen.html (19 April 2016). 758
Ferguson, C. 1959. Diglossia. Word 15. 325-340. 759
Fleischer, J. & S. Schmid. 2006. Zurich German. Journal of the International Phonetic
760
Association 36(2). 243-253. 761
Hahn, M.& B. Siebenhaar 2016. Sprechtempo und Reduktion im Deutschen (SpuRD). In O. 762
Jokisch (ed.) Elektronische Sprachsignalverarbeitung 2016, 198-205. Dresden: TUDpress. 763
Hewlett, N. & M. Rendall. 1998. Rural versus urban accent as an influence on the rate of speech. 764
Journal of the International Phonetic Association 28. 63-71. 765
Hughes, T., K. Nakajima, L. Ha, A, Vasu, P. Moreno & M. LeBeau. 2010. Building transcribed 766
speech corpora quickly and cheaply for many languages. Proceedings of Interspeech 2010. 767
1914-1917. 768
Jacewicz, E., R. A. Fox, C. O'Neill & J. Salmons. 2009. Articulation rate across dialect, age, and 769
gender. Language Variation and Change 21(2). 233-256. 770
Jacewicz, E., R. A. Fox & L. Wei. 2010. Between-speaker and within-speaker variation in 771
speech tempo of American English. The Journal of the Acoustical Society of America
772
128(2). 839-850. 773
Jessen, M. 2007. Forensic reference data on articulation rate in German. Science & Justice, 774
Keller, K. 2008. „Hützt’s z’Zuzwil?“ Zu den Silbenstrukturen des Schweizerdeutschen, 776
empirisch analysiert an zwei Dialekten. Lizentiatsarbeit am Institut für Sprachwissenschaft
777
der Universität Bern 2. Mai 2008.
778
Kilgarriff, A. 2005. Language is never, ever, ever, random. Corpus Linguistics and Linguistic
779
Theory 1(2). 263-276. 780
Kohler, K. J., K. Schafer, W. Thon & G. Timmermann. 1981. Sprechgeschwindigkeit in 781
Produktion und Perzeption. Arbeitsberichte Kiel 16. 137-205. 782
Kohler, K. J. 1982. Rhythmus im Deutschen in Experimentelle Untersuchungen von 783
Zeitstrukturen im Deutschen. Le rythme en allemand. Arbeitsberichte-Institut für Phonetik
784
19. 89-105. 785
Kohler, K. J. 2001. The investigation of connected speech processes. Theory, method, 786
hypotheses and empirical data. Arbeitsberichte des Instituts für Phonetik der Universität
787
Kiel 35. 1-32. 788
Kolly, M.-J., A. Leemann, V. Dellwo & P. Boula de Mareuil 2015. Speaker-idiosynrasy in 789
pausing behavior: evidence from a cross-linguistic study. Proceedings of ICPhS
790
(Glasgow). 791
Künzel, H. J. 1997. Some general phonetic and forensic aspects of speaking tempo. International
792
Journal of Speech Language and the Law 4(1). 48-83. 793
Labov W. 1996. When Intuitions Fail. Proceedings of the 32nd Regional Meeting of the Chicago
794
Linguistic Society 32. 77-106. 795
Leemann, A. 2012. Swiss German Intonation Patterns. Amsterdam: Benjamins. 796
Leemann, A. & M.-J. Kolly. 2013. Dialäkt Äpp. https://itunes.apple.com/ch/app/dialakt-797
Leemann, A., M.-J. Kolly, & D. Britain, D. 2016. English Dialects. 799
https://itunes.apple.com/gb/app/english-dialects/id882340404?mt=8, 800
https://play.google.com/store/apps/details?id=ch.uk_regional&hl=en_GB (19 April 2016).
801
Leemann, A., M.-J. Kolly & V. Dellwo. 2014. Crowdsourcing regional variation in speaking rate 802
through the iOS app ‘Dialäkt Äpp’. Speech Prosody 7: 217-221. 803
Leemann, A., M.-J. Kolly, J. P. Goldman, V. Dellwo, I. Hove, I. Almajai & D. Wanitsch. 2015. 804
Voice Äpp: a mobile app for crowdsourcing Swiss German dialect data. Proceedings of of
805
Interspeech 2015. 2804-2808. 806
Leemann, A., M. J. Kolly, R. Purves, D. Britain & E. Glaser 2016. Crowdsourcing Language 807
Change with Smartphone Applications. PloS ONE 11(1). e0143060. 808
Leemann, A. & B. Siebenhaar. 2007. Intonational and temporal features of Swiss German. 809
Proceedings of the ICPhS, Saarbrücken. 957-960. 810
Leemann, A. & B. Siebenhaar. 2010. Statistical Modeling of F0 and Timing of Swiss German 811
Dialects. Proceedings of Speech Prosody. 812
Lötscher, A. 1983. Schweizerdeutsch: Geschichte, Dialekt, Gebrauch. Frauenfeld: Huber. 813
McGraw, I. 2013. Collecting speech from crowds. In M. Eskenazi, G. A. Levow, H. Meng, G. 814
Parent & D. Suendermann (eds), Crowdsourcing for speech processing: Applications to
815
data collection, transcription and assessment, 38-71. Hoboken, NJ: John Wiley & Sons. 816
Merriam-Webster. 2016. Crowdsourcing.
http://www.merriam-817
webster.com/dictionary/crowdsourcing (19 April 2016). 818
Morton, J., S. Marcus & C. Frankish. 1976. Perceptual centers (P-centers). Psychological Review
819
Pfitzinger, H. R. 1998. Local Speech Rate as a Combination of Syllable and Phone Rate. 821
Proceedings of the ICSLP 3. 1087-1090. 822
Pfitzinger, H. R. 1999. Local speech rate perception in German speech. Proc. of the XIVth Int.
823
Congress of Phonetic Sciences 2. 893-896. 824
QGIS. 2016. QGIS Geographic Information System. Open Source Geospatial Foundation
825
Project.http://qgis.osgeo.org (19 April 2016). 826
Quené, H. 2008. Multilevel modeling of between-speaker and within-speaker variation in 827
spontaneous speech tempo. Journal of the Acoustical Society of America 123. 1104-1113. 828
R Core Team. 2016. R: A Language and Environment for Statistical Computing, version 3.0.0. R 829
Foundation for Statistical Computing. http://www.R-project.org (19 April 2016). 830
Ris, R. 1992. Innerethik der deutschen Schweiz. In P. Hugger (ed.) Handbuch der
831
schweizerischen Volkskultur, vol. 2, 749-766. Zürich: Offizin. 832
Reips, U. D. 2002. Standards for Internet-based experimenting. Experimental Psychology 49. 833
243-256. 834
Roach, P. 1998. Myth 18: Some languages are spoken more quickly than others. In L. Bauer & 835
P. Trudgill (eds.), Language Myths, 150-158. London: Penguin. 836
Robb, M. P., M. A. Maclagan & Y. Chen. 2004. Speaking rates of American and New Zealand 837
varieties of English. Clinical Linguistics & Phonetics 18(1). 1-15. 838
Schwab, S. & M. Avanzi. 2015. Regional variation and articulation rate in French. Journal of
839
Phonetics 48. 96-105. 840
Schwarzenbach, R. 1969. Die Stellung der Mundart in der deutschsprachigen Schweiz. Studien
841
Sieber, P. & H. Sitta. 1986. Mundart und Standardsprache als Problem der Schule. Aarau: 843
Sauerländer. 844
Siebenhaar, B. 2000. Sprachvariation, Sprachwandel und Einstellung. Der Dialekt der Stadt
845
Aarau in der Labilitätszone zwischen Zürcher und Berner Mundartraum. Stuttgart: Franz 846
Steiner Verlag. 847
Siebenhaar, B. & A. Wyler. 1997. Dialekt und Hochsprache in der deutschsprachigen Schweiz. 848
Zürich: Pro Helvetia. 849
Siebenhaar, B., B. Zellner Keller & E. Keller. 2001. Phonetic and timing considerations in a
850
Swiss High German TTS system. Improvements in Speech Synthesis, 165-175. Chichester: 851
John Wiley. 852
Simpson, A. P. 1998. Phonetische Datenbanken des Deutschen in der empirischen 853
Sprachforschung und der phonologischen Theoriebildung. Arbeitsberichte des Instituts für
854
Phonetik und digitale Sprachverarbeitung der Universität Kiel 33. 855
Sprachatlas der deutschen Schweiz. 1962–2003. Bern (I-VI), Basel (VII-VIII): Francke. 856
Staub, F. 1874. Die Vokalisierung des N bei den schweizerischen Alemannen. Halle 1874 (unter 857
dem Titel: Ein schweizerisch-alemannisches Lautgesetz auch in Deutsche Mundarten 7, 858
1877, S. 18–36, 191–207, 333–389). 859
Trouvain, J. 2003. Tempo variation in speech production. Implications for speech synthesis. 860
Saarbrücken, Germany: Universität des Saarlandes Ph.D. thesis. 861
Trouvain, J., J. Koreman, A. Erriquez & B. Braun. 2001. Articulation Rate Measures and Their 862
Relation to Phone Classification in Spontaneous and Read German Speech. Proceedings of
863