µFlow : A compact fluorescence detection system that uses a DVD pickup for the optical detection of beads
91
0
0
Full text
(2) 2.
(3) Abstract The fertility project started at BIOS, Lab on a Chip group, in 2007, aims at developing a high accuracy point of care semen analyzer that can be used at home, making the semen analysis more comfortable, easier, and cheaper. During a semen analysis the semen quality is to be determined by concentration, motility, morphology and vitality/viability of the sperm cells. At present the concentration and motility can be determined with a microfluidic chip using electrical conductivity measurements. To measure the remaining parameters, new detection methods may be developed and the first results thereof are described in this thesis. In this thesis, the use of fluorescence detection is described. Using a ‘Lab on a Chip’ and an optical pickup taken from a DVD player, a fluorescence detection apparatus, the ‘µflow’ has been designed and built. The optical pickup has a lot of integrated optical components that makes a compact, easy to use and cheap fluorescence detection system possible. A ‘Lab on a Chip’ consisting of three microfluidic channels and digital marks for position detection has been developed. Automatic guiding the optical pickup to find the three channels was successfully shown using –on chip- digital marks and an automatic focus system. The µflow fluorescence detection capabilities were tested using 6 µm and 2.5 µm fluorescent beads and real-time 2D visualisation of the beads in Labview was demonstrated. Beads were counted and the size, speed, transversal and vertical position of the individual beads in the fluidic channel were determined. The optical resolution is limited by the spot size of the laser and therefore only particles larger than 0.4 µm could be visualized. No experiments were performed using spermatozoa, but it is very likely that spermatozoa can be visualized with the same resolution as beads. If this succeeds for spermatozoa, the µflow would be able to determine the concentration and morphology parameters of the sperm cells (vitality/viability can be assessed using fluorescent dyes). The µflow was built in such a way that in a future project it may also be used for analyzing other biological relevant fluids such as blood.. 3.
(4) 4.
(5) Samenvatting In 2007 is bij BIOS, Lab on a Chip groep, een vruchtbaarheidsproject gestart. Het doel van dit project is het ontwikkelen van een sperma analyse apparaat voor thuisgebruik dat een sperma analyse nauwkeurig, comfortabel en goedkoop kan uitvoeren. Tijdens een analyse moet worden gekeken naar de concentratie, bewegelijkheid, vorm en vitaliteit van de sperma cellen. Momenteel kan de concentratie en beweeglijkheid worden gemeten door middel van een elektrische geleidbaarheidsmeting in een microfluïdische chip. Voor het meten van de overige parameters kunnen andere detectiemethodes mogelijk uitkomst bieden. In deze masteropdracht wordt een fluorescentie detectiemethode beschreven. Met behulp van een ‘Lab on a Chip’ en een optische pickup uit een dvd-speler is een fluorescentie detectie apparaat genaamd 'μflow' ontworpen en gebouwd. Een Lab on a Chip bestaande uit drie microfluïdische kanalen en digitale markeringen voor positiebepaling is hiervoor ontwikkeld. Omdat de pickup uit vele geïntegreerde optische onderdelen bestaat, is het mogelijk om een compact en goedkoop apparaat te ontwikkelen. Automatische sturing van de pickup zorgt voor een autonome herkenning van de drie kanalen door middel van digitale markeringen en een automatisch focus systeem. Het fluorescentie detectie vermogen van de μflow is getest met behulp van 6 µm en 2,5 µm fluorescerende bolletjes. Deze bolletjes worden in twee dimensies zichtbaar gemaakt in Labview. Het aantal bolletjes kan worden geteld, ook de snelheid, grootte en de verticale/transversale positie van de individuele bolletjes kan worden bepaald. De optische resolutie wordt beperkt door de puntgrootte van de laser, hierdoor kunnen alleen deeltjes groter dan 0,4 µm weergegeven worden. Op dit moment zijn er nog geen experimenten uitgevoerd met sperma cellen, maar het is zeer waarschijnlijk dat sperma cellen met dezelfde nauwkeurigheid kunnen worden weergegeven als de bolletjes. Mocht dezelfde nauwkeurigheid behaald worden met sperma cellen dan zou dit betekenen dat de concentratie en vorm van de sperma cellen gemeten kan worden, vitaliteit kan met behulp van fluorescerende markers zichtbaar gemaakt worden. De μflow is zodanig gebouwd dat in de toekomst ook andere biologisch relevante vloeistoffen zoals bloed geanalyseerd kunnen worden.. 5.
(6) 6.
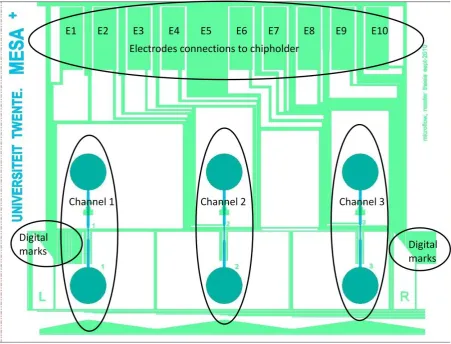
(7) Contents ABSTRACT ........................................................................................................................................................ 3 SAMENVATTING ............................................................................................................................................... 5 TERMINOLOGY ................................................................................................................................................. 9 1. INTRODUCTION...................................................................................................................................... 11 1.1 1.2 1.3. 2. BACKGROUND .......................................................................................................................................... 11 AIM OF THESIS ......................................................................................................................................... 11 REPORT OUTLINE ...................................................................................................................................... 12. THEORY .................................................................................................................................................. 15 2.1 HUMAN SEMEN ........................................................................................................................................ 15 2.1.1 Fertility ............................................................................................................................................ 15 2.1.2 Semen analysis ................................................................................................................................ 15 2.2 FLUORESCENCE ........................................................................................................................................ 16 2.2.1 Auto fluorescence ............................................................................................................................ 17 2.3 OPTICAL DETECTION OF PARTICLES AND CELLS INSIDE A MICROFLUIDIC CHANNEL .................................................... 18 2.3.1 Light scattering and light blocking .................................................................................................. 18 2.3.2 Fluorescence .................................................................................................................................... 19 2.4 µFLOW APPROACH .................................................................................................................................... 20. 3. OPTICAL PICKUP..................................................................................................................................... 21 3.1 3.2 3.3 3.4 3.5 3.6. 4. FOCUS SYSTEM ...................................................................................................................................... 27 4.1 4.2 4.3 4.4 4.5. 5. PHR-803T OPTICAL PICKUP ....................................................................................................................... 22 IDENTIFICATION OPTICAL PARTS ................................................................................................................... 22 OBJECTIVE LENS........................................................................................................................................ 24 FOCAL LENGTH ......................................................................................................................................... 25 RESOLUTION AND FOCAL DEPTH ................................................................................................................... 25 GAUSSIAN BEAM ...................................................................................................................................... 26. FOCUS DISTANCE MEASUREMENT ................................................................................................................. 27 MOVING LENS .......................................................................................................................................... 28 PID CONTROL .......................................................................................................................................... 29 MATLAB SIMULATION................................................................................................................................ 30 MICROCONTROLLER FOCUS CONTROLLER ....................................................................................................... 30. FLUORESCENCE DETECTION ................................................................................................................... 31 5.1 SETUP .................................................................................................................................................... 31 5.2 FLUORESCEIN ........................................................................................................................................... 32 5.2.1 Fluorescence power ......................................................................................................................... 32 5.3 BEADS .................................................................................................................................................... 33 5.4 DYES ...................................................................................................................................................... 34 5.4.1 Viability indicator ............................................................................................................................ 34 5.4.2 Vitality indicator .............................................................................................................................. 34 5.5 PHOTO DETECTOR ..................................................................................................................................... 35 5.5.1 Photodiode ...................................................................................................................................... 35 5.5.2 Avalanche photodiode ..................................................................................................................... 35 5.5.3 Photomultiplier ................................................................................................................................ 36. 7.
(8) 5.5.4 5.5.5 6. Fluorescence detector ..................................................................................................................... 36 Photon detection ........................................................................................................................... 38. FLUIDIC CHIP .......................................................................................................................................... 39 6.1 CHANNEL FINDING .................................................................................................................................... 40 6.1.1 Digital marks ................................................................................................................................... 41 6.2 IMPEDANCE SPECTROSCOPY ........................................................................................................................ 43. 7. SOFTWARE ............................................................................................................................................. 45 7.1 LABVIEW GUI .......................................................................................................................................... 45 7.2 MICROCONTROLLER .................................................................................................................................. 47 7.2.1 Main ................................................................................................................................................ 47. 8. ELECTRONICS ......................................................................................................................................... 49 8.1 8.2 8.3 8.4 8.5 8.6. 9. FUNCTIONAL TESTS ................................................................................................................................ 55 9.1 9.2 9.3. 10. PDIC ..................................................................................................................................................... 49 VCA DRIVER ............................................................................................................................................ 50 MICROCONTROLLER AND DAC .................................................................................................................... 52 SLIDE CONTROL ........................................................................................................................................ 52 MPPC ................................................................................................................................................... 52 IMPEDANCE SPECTROSCOPY ........................................................................................................................ 54. ILLUMINATION POWER ............................................................................................................................... 55 VOICE COIL ACTUATOR (VCA) ..................................................................................................................... 55 PDIC ..................................................................................................................................................... 58. RESULTS/DISCUSSION ............................................................................................................................ 59 10.1 FIND CHANNEL ......................................................................................................................................... 59 10.1.1 PDIC-response ............................................................................................................................. 59 10.1.2 Focus profile ................................................................................................................................ 61 10.1.3 Channel finding ........................................................................................................................... 62 10.2 DARK NOISE, ENVIRONMENTAL- AND LEAKING LIGHT ........................................................................................ 64 10.3 BEADS .................................................................................................................................................... 66 10.3.1 Non fluorescent beads ................................................................................................................ 69 10.3.2 Fluorescence absorbtion ............................................................................................................. 70 10.3.3 Maximum flow speed .................................................................................................................. 70. 11. CONCLUSION/RECOMMENDATIONS ...................................................................................................... 71 11.1 11.2. CONCLUSION ........................................................................................................................................... 71 RECOMMENDATIONS................................................................................................................................. 71. REFERENCES ................................................................................................................................................... 73 APPENDIX 1 SCHEMATICS ............................................................................................................................... 76 APPENDIX 2 PCB’S .......................................................................................................................................... 77 APPENDIX 3 MECHANICAL DRAWINGS ........................................................................................................... 78 APPENDIX 4 MICROCONTROLLER FLOWCHARTS ............................................................................................ 81 APPENDIX 5 WIRING ...................................................................................................................................... 89. 8.
(9) Terminology List of Acronyms: ADC = Analog to Digital Converter AM = Acetoxymethyl APD= Avalanche Photodiode BD = Blu-ray Disc CASA =Computer Assisted Semen Analysis CCD = Charge-Coupled Device CD = Compact Disc DAC = Digital to Analog Converter DAQ= Data Acquisition card DDS = Direct Digital Synthesis DOF = Depth Of Focus DVD = Digital Versatile Disc FES = Focus Error Signal GUI = Graphical User Interface HD-DVD = High-Definition/Density DVD kcps = kilo counts per seconds LASER = Light Amplification by Stimulated Emission of Radiation MPPC = Multi Pixel Photon Counter NA = Numerical Aperture OEM = Original Equipment Manufacturer Op-amp = Operational amplifier PCB = Printed Circuit Board PDE = Photon Detection Efficiency PDIC = Position Detector Integrated Circuit p.e. = photon energy PID = Proportional-Integral-Derivative PMT = Photomultiplier Tube PN = P-type and N-type RFN = negative FES: – (A + B+ C+D) RFP = positive FES: A + B+ C+D SNR = Signal to Noise Ratio SP = Set Point USART = Universal Asynchronous Receiver/Transmitter VCA = Voice Coil Actuator List of abbreviations: Kd = differential gain Ki = integral gain Kp = proportional gain µflow = Microflow Constants: h = 6.63 × 10⁻³⁴ [m2 kg / s] (Planck constant) v= 3.00× 10⁸ [m / s] (speed of light). 9.
(10) 10.
(11) 1 Introduction 1.1 Background Each year, one out of ten couples in the Netherlands remains involuntarily childlessness [R.J.Raterink 2008]. To find out what the problem is, several tests have to be performed. Often, one of the first tests is determining the fertility of the man by analyzing his semen. This test is relatively easy to perform and non invasive but is accompanied with some difficulties. The man needs to collect semen and bring this within one hour to the hospital. The semen is directly analyzed to determine the quality. Because of large variations between samples this test has to be repeated at least three times, resulting in three visits to the hospital [Segerink 2010]. To make this semen analysis more comfortable, reliable and easier, the test would have to take place in the patient’s home environment. This would require a point of care semen analyzer for home use that allows cheap tests with a low variation. For the realization of such an analyzer, the fertility project has been started at BIOS, Lab on a Chip group in 2007. In Segerink [2010] this was achieved by passing spermatozoa through a microchannel with a planar electrode pair that allows the detection of spermatozoa using electrical impedance measurements. It was shown that the change in electrical impedance was related to the size of cells passing the electrodes. This allows distinguishing between spermatozoa and other cells. The concentration of spermatozoa was determined using electrical impedance measurements in combination with a known concentration of beads. The concentration parameter can now be determined using a Lab on a Chip. However, for reliable sperm quality measurements motility, morphology and vitality/viability of the sperm cells should be taken into account. Most of these parameters can be determined using fluorescent dyes and a thoroughly analysis using a fluorescence microscope. But no automated solution for Lab on a Chip devices reported yet.. 1.2 Aim of thesis In this thesis a measurement system for fluorescence detection for Lab on a Chip devices will be developed. A device will be made that can perform fluorescence measurements on a Lab on a Chip device for the characterisation of beads. This device will eventually be used in a point of care semen analyzer and therefore it has to be easy to use, small, cheap and able to carry out quick measurements. The targets of the µflow (Microflow) are: Automatic positioning system for finding the on-chip microfluidic channels Counting cells/beads Position detection of cells/beads inside the microfluidic channel Distinguish bead/cell size Visualize the morphology of cells/beads Asses viability/vitality of cells by using fluorescent dyes Combined fluorescence and impedance measurement Position detection of cells/beads inside the microfluidic channel by using impedance. 11.
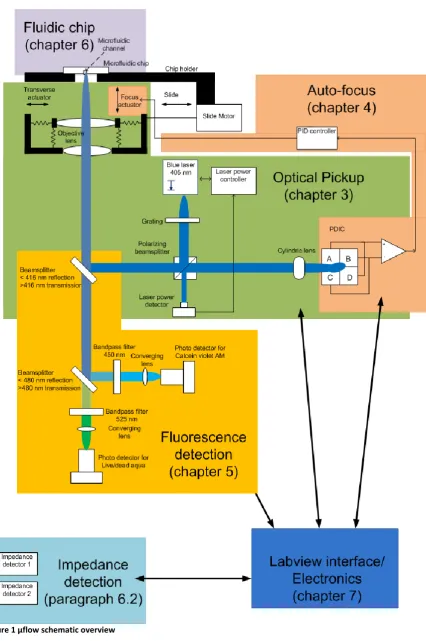
(12) 1.3 Report outline The theoretical aspects of the thesis are described in chapter 2: human semen and fluorescence are appointed and various techniques for particle detection in microfluidic channels are described. In paragraph 2.4 the µflow design approach is explained. In chapter 3, µflow’s optical heart -the optical pickup- is introduced. One of the important features of the µflow, the focus system is described and simulated in chapter 4. The fluorescence detection is explained in chapter 5: Fluorescein, beads and and fluorescent dyes are introduced. Next the fluorescence setup is shown and photo detectors are chosen. In chapter 6 the microfluidic chip design is discussed: the channel find algorithm and digital marks are explained, also a new electrodes configuration for impedance spectroscopy is described. The user interface of the µflow and the microcontroller program are described in chapter 7. The electronics and printed circuit board design are described in chapter 8. Functional test of the voice coils, laser diode and photon counter are described in chapter 9. Results and discussion in chapter 10, which starts with results of the channel finding and leaking light experiments. Subsequently, experiments were performed using fluorescent beads. Conclusions and recommendations can be found in chapter 11. An overview of the µflow with references to the relevant chapters is shown in Figure 1.. 12.
(13) Figure 1 µflow schematic overview. 13.
(14) 14.
(15) 2 Theory The theoretical aspects of the thesis are described in this chapter. First human semen and fertility are appointed, followed by fluorescence. Subsequently various optical techniques for particle and cell detection in a microfluidic channel are presented. In the end of the chapter one approach is chosen.. 2.1 Human semen The male reproductive cell is the sperm cell (spermatozoon). Depending on the chromosome (Y or X) it carries, the sperm give rise to male (XY) or female (XX) offspring. A schematic overview of the human sperm cell is shown in Figure 2. The front part is the head which measures 3 µm in diameter and 5 µm in length. The tail is about 50 µm long. Human semen does also consist of various other particles like: ions, sugars and proteins. In fact, for a fertile man the volume percentage of the sperm cells in human semen is only between the 0.1 % and 1 % [Segerink 2010].. Figure 2 human sperm cell [Villarreal]. 2.1.1 Fertility Sperm quality is determined by: concentration, motility, morphology and vitality of the spermatozoa. Concentration indicates the amount of sperm cells per volume (higher concentrations are better). Motility indicates the amount of motile sperm cells: motile sperm cells can swim faster and result in a higher sperm quality. Morphology is an indicator of the shape of the cell, accounting for defects in the cell (less defects is better). Vitality indicates the percentage of living cells. International guidelines for the quantification of sperm quality have been made by the World Health Organization, the lower reference limits are shown in Table 1. Table 1 lower reference limits for semen characteristics [WHO 2010]. Parameter Volume Concentration (per mL) Total motility Morphology (normal forms) Vitality (live spermatozoa). Lower limit 1.5 mL. reference. 40 % 4% 58 %. 2.1.2 Semen analysis The semen analysis in a hospital consists of manual counting the sperm cells using a microscope, which is called the “gold standard”. Also the motility, morphology and vitality are determined by counting this way. Most of these analysis are now performed (semi) automatically using a CASA (Computer Assisted Semen Analysis). This system is based on a microscope with image recognition for sperm counting, velocity and shape measurements. Semen can also be analyzed at home using sperm kits. Most of these kits use antibodies for colouring the sperm cells, concentration and motility can be determined [FertilityScore 2009]. Since the results are not analyzed by trained or skilled people, the accuracy and reproducibility of these test is questionable. Another disadvantage is that most of these home-tests only indicate if a certain sperm concentration is present, which gives only limited information. 15.
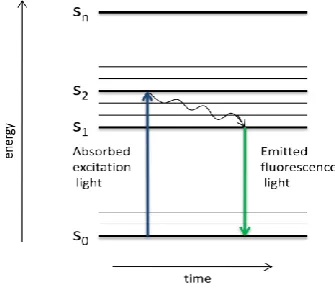
(16) 2.2 Fluorescence The process in which a molecule absorbs light and then emits light at a different (longer) wavelength is called fluorescence. In the biological and life sciences fluorescence is often used as a nondestructive method for analyzing cells. It allows highly sensitive measurements for characterization and distinguishing of (individual) cells. This can be done by labelling the cells with a fluorescent marker called a dye. This dye emits light at a specific wavelength and the cell can be traced. The dye can visualize particular characteristics of a cell, for example: vitality, viability or membrane integrity. This way, fluorescence has the capability to differentiate between two similar sized cells using different dyes. For on-chip semen quality measurements, fluorescent detection could be a promising detection technique. In this paragraph the theory behind fluorescence is explained. The process is explained using a Jablonski energy diagram of a fluorescent dye, shown in Figure 3.. Figure 3 Jablonski energy diagram. The energy diagram shows the various vibrational energy levels that are involved in the fluorescence process of a dye. In the absence of light, the dye is in the ground state (s0). When light with a sufficient energy strikes, a photon will be absorbed and the dye is in an excited state (s2). Vibrational energy is converted to heat and the dye’s energy will drop in the lower excited state (s1). The dye will stay in this state for several nanoseconds (this is by far the longest period in the fluorescence process, see time on the x-axis of Figure 3) before emitting a photon and relaxing in the ground state. In Figure 3, the absorption and emission process for one wavelength is shown. However, a normal light source radiates light with a wide spectrum of wavelengths. The dye’s absorption of a wide spectrum will generate different absorption transitions that populate different excited states. Each transition has its own probability. This wavelength dependent absorption is shown in Figure 4. From Figure 4 can be seen that the emission spectrum is wavelength dependent too. This is the result of the closely spaced energy levels of the ground state. The probability of each transition shapes the emission spectrum[Olympus 2010].. Figure 4 absorption and emission spectrum [Herman 2010]. 16.
(17) In Figure 4, a shift in wavelength between the absorption and emission spectrum is shown. This shift in wavelength is called the Stokes shift. This shift is caused by conversion of vibrational energy into heat: the emitted photons have a lower energy (longer wavelength) than the absorbed photon. The difference in photon-energy is equal to the Stokes shift[Olympus 2010]. The process of absorption and emission of photons is not everlasting. Depending on the chemical structure (bonds) of the dye, this process can be repeated several hundreds or thousands times before the dye permanently loses fluorescence, which is called photo bleaching. Overexposure during measurement and exposure of the dye to unwanted light sources should be prevented to minimize photo bleaching. An important parameter of a dye is the efficiency to emit a photon when a photon is absorbed; this is the Qe (quantum efficiency)[Olympus 2010]:. 2.2.1 Auto fluorescence Fluorescence detection of sperm cells can be implemented using fluorescent dyes attached to the cells. Apart from using fluorescent dyes, the auto fluorescence of the sperm cell could be used as label free fluorescence detection. “Auto fluorescence of sperm cells is particular strong in comparison to other mammalian cells. Most auto fluorescence is coming from various organelles such as mitochondria in the cytoplasm” [Hinterdorfer 2009]. “Acid Phosphatase (AP) is found in high levels in semen and originates from the epithelial cells where it is secreted into the prostate gland”. “The level of AP activity is 500 to 1000 times higher in human semen than in any other normal body fluids or secretions” [Gutmann 1941]. Therefore auto fluorescence can be used for differentiating between semen and other normal body fluids. In Stoilovic[1991] the emission and absorption spectra of untreated dry semen were analysed, these spectra are shown in Figure 5. The absorption spectrum of semen was analyzed from 300-480 nm, showing a peak at 400 nm. For two excitation wavelengths (350 nm and 450 nm, see Figure 5), emissions spectra were measured showing peaks at respectively 460 nm and 520 nm.. Figure 5 absorption and emission spectra of untreated dry semen [Stoilovic 1991]. For enabling auto fluorescent detection of semen in the µflow, the excitation light source (chapter 3) should be chosen around the absorption peak of 400 nm.. 17.
(18) 2.3 Optical detection of particles and cells inside a microfluidic channel In the literature several techniques are presented for particle and cell detection in a microfluidic channel using light. This paragraph reviews three techniques: light scattering, light blocking and fluorescence. 2.3.1 Light scattering and light blocking Light scattering and light blocking detectors are often used in applications where particle counting or size recognition is needed. Both techniques are shown in Figure 6 and require a light source for the illumination of the detection volume. When a particle enters the detection volume the scattering or obscuration of light is measured depending on which type of detector is used.. Figure 6 optical detection: light blocking detector (left), light scattering detector (right). In the light scattering detector the photo detector is positioned at an angle and the reflected light is measured. Bigger particles reflect more light, which makes size recognition possible. In the light blocking detector, the light source is directly focused on the photo detector. A particle in the detection volume will absorb and reflect part of the light away from the photo detector. However, diffuse light inside the blocking detector is reflected resulting in a lower sensitivity compared to the light scattering detector [Zhang 2009]. The sensitivity of both detectors is based on the particle’s surface area, not for volume effects as for example measured during impedance spectroscopy. Light blocking detectors are only used for the detection of large particles or concentrated particles however, light scattering detectors could be used for cell and particle detection inside a microchannel [Zhang 2009]. In Kummrow [2009] an on-chip flow-cytometer consisting of side scatter and fluorescence detection was built. The chip consists of a 3D microfluidic structure with integrated optical fibers, mirrors and electrodes and is used for blood cell analysis. Using 2D hydrodynamical focusing the cells are forced into a 5 µm stream with flow rates up to 3 m/s (for high throughput). Cells are characterised by measuring the pulse shape and pulse height of the scattering detectors. This enables them to distinguish between platelets and red blood cells. More advanced parameters were measured using the fluorescence detectors. The combination of scattering and fluorescence detection at extreme high flow rates is promising, however the complex chip design requires in depth knowledge of chip manufacturing and years of research. Another light scattering detector is shown in Kostner[2007]. A DVD optical pickup is focused on the microfluidic channel (50 µm width) of a glass chip. Hydrodynamical focussing, forces the particles or cells to move across the reflective surface at the bottom of the channel. Discrimination between cells and polystyrene bead was shown. Moreover yeast cells (3-4 µm) have been detected and counted. The only discrimination parameter is the maximum and minimum of the scattering signal. Since sperm cells have roughly the same dimensions as yeast cells, the setup could potentially be used for 18.
(19) the counting of sperm cells. Cell/bead counting allows for determining the spermatozoa concentration of spermatozoa [Segerink 2010]. Apart from the concentration parameter motility, morphology and vitality of the sperm cannot be determined using light scattering. Because of the low price, compact format and the simple shape selection parameters an optical pickup scattering detector could be integrated next to fluorescence detection (used for determining the other spermatozoa parameters). A reflective layer at the top of the channel is required for the light scattering detector. During the manufacturing of the microfluidic chip this requires an additional mask (compared to Segerink[2010]),the system as proposed by Kostner is therefore not chosen for the µflow. 2.3.2 Fluorescence In Kruger[2002] a miniaturized flow cytometer has been built for counting and sorting cells. The focus of this article is on the integration of active and passive optical components on a disposable chip. Fluorescence excitation was performed by on-chip prism coupling. For the fluorescence detection a band-pass filter and APD (Avalanche Photodiode, paragraph 5.5.2 ) was integrated onchip. Separation of 6 µm beads was shown at a rate of 200 beads/s using external valves and pumps. The integration of many optical parts inside a chip is a great achievement and the results are promising but at the moment this is only possible for experimental purposes. In Yang[2006] a cell counting/sorting system is presented. A 532 nm green laser is focused inside a microfluidic channel. An APD was used for the fluorescence detection. Counting >1 µm diameter cells at rates up to 120 cells/s was shown with a counting error <1.5 %. The size of the system is only 37x16x18 cm3. Hydrodynamical focussing results in a 12.5 µm width stream of cells, a micro flow switch with external pumps was used for the sorting. The system sensitivity and counting speed could be sufficient for the µflow; however the system is rather expensive and requires a complex (optical) setup. In Holmes[2005] dielectrophoretic particle focusing is combined with fluorescence detection. For fluorescence excitation a 633 nm red HeNe laser is used. A PMT (Photomultiplier Tube) is used for the fluorescent detection. Movement of the particles is simultaneously monitored using a high speed CCD (charged coupled device). Vertical and horizontal focusing of the particles is done by four electrodes (two electrodes on top of the channel, two at the bottom). Fluorescent beads in the micrometer range were counted at a rate up to 250 beads/s. Especially the dielectrophoretic particle focusing is interesting for the µflow, since minor modifications to the current chip design (chapter 6) would allow integration of particle focusing. Fluorescence detection in large diameter channels (300 µm) using an optical pickup is described in Shimomura [2008]. An external 532 nm laser is focused inside the microfluidic channel. The laser beam is moved in the vertical and horizontal direction to create a two-dimensional section of a microfluidic channel. For the fluorescence detection a PMT was used. Measurements with different concentrations of Resorufin were performed, a linear response was found for the range of 0.1-100 nM, the detection limit was 800 pM (chip to chip reproducibility 2.1 %). Another application where an optical pickup is used is in [Yim 2008]. The mixing pattern of two fluids is visualized using fluorescent dyes, A resolution of 1 µm was archived, combined with good results found for sensitivity and reproducibility. In Zhu[2010] a cell phone camera was used in combination with only a cost-effective colour filter, lens and illumination led’s. A spatial resolution of 10 µm was achieved with additional digital imaging processing.. 19.
(20) 2.4 µflow approach In paragraph 2.3.2 several approaches for the fluorescence detection of particles and cells inside a microfluidic channel have been presented. Some approaches result in a difficult optical setup that is both spacious and expensive [Kruger 2002], [Yang 2006]. Because of the limited amount of time to spend on this thesis and the need for a compact fluorescence detection system, another approach is necessary. To meet at the time pressure (part of) a ready-made optical system must be used. In this chapter the optical pickup approach and the cell phone camera of Zhu[2010]are analyzed in more depth. Eventually one option is chosen.. Figure 7 fluorescence detection in microfluidic channel: multiple pixels (left), single pixel (right). In Zhu[2010] a cell phone camera was used in combination with only a cost-effective colour filter/ lens and illumination led’s. The fluorescent stained cells are excited using a led light source. The led illuminates a large area of the microfluidic channel, the fluorescent emission from the entire area is collected by a CCD, shown in Figure 7 (left side). An image is captured after a certain time. Signal intensities from the individual pixels are converted into a digital image. A CCD can acquire a two dimensional image of the fluorescence light, which allows cell-shape recognition. However, the photo detectors inside the CCD are not designed for the detection of weak fluorescence light. The low sensitivity will therefore cause a loss of fluorescence information. In Zhu[2010] a spatial resolution of 10 µm was achieved with additional digital imaging processing. This is not enough for the detection of sperm cells. A higher resolution is possible using a more advanced CCD or better optics. The CCD camera option requires a high quality camera and a relative simple experimental setup. The focus will shift to image processing: finding smart algorithms for cell recognition and identification. Another option is to use an optical pickup from a DVD or CD player. In this approach a laser beam is scanned back and forth across the width of the microchannel. The excited area is representing one single pixel, see Figure 7 (right side). Using hydrodynamical focussing there is also the option to keep the laser beam static above the channel. By modifying the optical pickup, measurements with high sensitivity can be performed because the objective lens has a high NA (Numerical Aperture) and a beam diameter < 1 µm. The optical pickup has also the possibility to control the focus automatically. In combination with a transversal movement using voice coils this ensures high throughput measurements. The optical pickup sensitivity can be increased by adding a more sensitive photo detector with a small form factor [Kummrow 2009], [Yang 2006]. The optical pickup option does not focus on image processing like it is the case of Zhu[2010] and requires a more broad set of skills. Because of the many advantages listed above, the optical pickup was eventually chosen from the two options.. 20.
(21) 3 Optical pickup The optical pickup is µflow’s optical heart because it incorporates the most (important) optical features. In this chapter the principle of reading an optical disc is explained first. Subsequently the PHR-803T optical pickup is introduced and the optical parts are explained.. Figure 8 reading an optical disc. In Figure 8 the general reading principle of an optical disc (CD or DVD) is shown. A light beam is emitted by a laser diode and will first meet a collimating lens that creates a parallel beam. The polarizing beamsplitter reflects the beam and the quarter-wave plate creates a quarter-wavelength phase shift (only the shifted light will later be transmitted to the photo detectors). The beam is than focused on the data layer of the optical disc using the objective lens. Light is reflected back from the data layer and will pass through the objective lens onto the quarter-wave plate. The polarizing beamsplitter transmits the beam and an astigmatic lens (lens with two focal points) is focussing the beam at the photodiodes inside the PDIC (Position Detector Integrated Circuit). Photodiodes convert the optical data into electric pulses [Odgaard 2004]. For robust data transfer the distance between data layer of the optical disc and the objective should be kept constant and equal to the focal length of the objective lens. This is done by the focus system described in chapter 4. The focal length of the objective lens is changed by moving the lens in the vertical direction using a VCA (Voice Coil Actuator). Besides vertical displacements, the objective can also be moved in the transversal direction. This allows access to data nearby, since the data on an optical disc is positioned in several thousands of circular tracks. The working range of the transverseactuator (< 1 mm) is only a few hundred tracks, for large transversal displacements a slide motor changes the position of the entire optical pickup.. 21.
(22) 3.1 PHR-803T optical pickup The first distinction in between optical pickups is which optical format is supported: CD (Compact Disc), DVD (Digital Versatile Disc), HD-DVD (High Definition/Density DVD) or BD (Blu-ray Disc). For detecting auto fluorescence of semen (paragraph 2.2.1) a blue laserdiode is required and only HDDVD and BD optical pickups are equipped with this one. A blue laser can also archive higher resolutions because the wavelength of the light is smaller compared to the red and infrared laserdiodes used in respectively DVD and CD formats. Comparing HD-DVD and BD, the HD-DVD format is preferred because it provides a larger working distance compared to BD (paragraph 3.2), resulting in a simpler setup. Besides the HD-DVD format, optical pickups are often backwards compatible with DVD and CD. These multiple format optical pickups are preferred for use in the µflow because they incorporate multiple laser wavelengths. The more wavelengths are available the more different dyes can be used. Another important aspect is the obtainability: most optical pickups are produced for several years and will eventually become discarded. Therefore, the preference is given to a new and widely available optical pickup model. For the µflow, the PHR-803T optical pickup (Figure 9 and Figure 10) was chosen because it supports multiple formats including HD-DVD, incorporates autofocus, is easy to obtain and costs only 10 dollars. The PHR-803T is also used in the HD-DVD drive of the XBOX-360 game console. The supported formats are: CD, DVD and HD-DVD.. 3.2 Identification optical parts Unfortunately optical pickups are OEM (Original Equipment Manufacturer) devices and therefore undocumented. All information is classified and unobtainable, and the PHR-803T was no exception. Before the optical pickup could be used in the µflow all the parts had to be identified first. After days of reverse engineering, all parts could finally be identified. For example: to identify the PDIC, the optical pickup was inspected under a microscope: the part number was visible on the silicon wafer through the glazed window of the PDIC. The optical components of the PHR-803T pickup are numbered in Figure 9 and Figure 10 and a schematic overview is shown in Figure 11.. Figure 9 PHR-803T optical pickup side view: voice coil actuator (8), objective lens (9), laser power control (13) and slide connection (14). Figure 10 PHR-803T optical pickup bottom view: laser diode 405 nm (1), laser diode 660 nm and 780 nm (2), diffraction grating (3), beamsplitter (4,5), mirror (6), waveform aberration corrector (7), astigmatic lens (10), PDIC (11) and laser power detector (12). 22.
(23) For the HD-DVD format a 405 nm ultraviolet laser beam is emitted by the laser diode (1). For the DVD and CD format, respectively a 660 nm red laser beam and a 780 nm infrared laser beam are emitted by the dual emission laser diode (2). The laser beam will first meet diffraction grating1 (3). The beams of the two laser diodes are then multiplexed in a polarizing beamsplitter (4). Afterwards the laser beam is reflected by a second polarizing beamsplitter (5) and a mirror (6). It is eventually passed through a waveform aberration corrector 2(7) and focused on the data layer of the optical disk using a two lenses objective. Notable fact is that no collimating lens is used for collimating the laser beam, as a result much of the laser power is wasted. Most likely this was done to reduce costs. Transverse actuator Objective lens. Focus actuator. Red laser / IR laser. Objective lens Grating. Blue laser. Polarizing beamsplitter. Wavefront aberration corrector Polarizing beamsplitter. Cilindric lens. Mirror PDIC Laser power detector. Figure 11 schematic overview of: PHR-803T optical pickup. Specifications of the PHR-803T are not available, however this multiple format optical pickup should work conform the standards of both CD, DVD and HD-DVD format. In Table 2, these standards are shown. Table 2 standardized optical formats. CD. DVD. HD-DVD. (BD). λ [nm]. 780. 660. 405. 405. NA. 0.45. 0.6. 0.65. 0.85. 1. The diffraction grating creates sub-beams from the main beam. Using the method called ‘twin-spot radial detection’ the optical pickup can recognize the radial position and find the data tracks. The µflow uses only the main beam. 2 In between the mirror and objective a wavefront aberration corrector is placed. This is a miniature LCD screen that allows for correction of the wavefront. This results in a better focused beam. Wavefront correction is not necessary in the µflow, therefore the LCD screen will not be used. Moreover there is no information on how to control the LCD.. 23.
(24) The wavelength λ corresponds to the colour of the laser diode. The NA (numerical aperture) represents the resolving power of the objective lens and is defined as[Wikipedia 2009]:. Where θ is the maximum angle at which the objective lens can accept light. In Figure 12 a schematic drawing is shown, where F is the focal point, f the focal length and D the lens diameter.. Figure 12 NA of a lens [Wikipedia 2009]. 3.3 Objective lens Supporting three different NA’s at three different wavelengths requires a complex objective lens design; this design is shown in Figure 13.. Figure 13 objective lens top view (left), side view (right). The objective lens has a wavelength selective diameter; it consists of three interference filters. The inner and middle interference filters are separated at a diameter corresponding to a NA of 0.45 for transmitting 785 nm light (CD-format). The middle and outer interference filters are separated at a diameter corresponding to a NA of 0.6 for transmitting 660 nm light (DVD-format). The outer diameter (measuring 4mm) corresponds to a NA of 0.65 for transmitting 405 nm light (HD-DVDformat)[Katayama 2008]. The actual objective lens of the PHR-803T consists of two separate lenses, shown in Figure 11 (the two lenses combined give the objective lens as shown in Figure 13). The lower lens is fixed; the upper lens can be moved using voice coil actuators. Vertical movements of the upper lens are used for focussing and transversal movements for track finding can be made. Also the tilt of the upper lens can be adjusted.. 24.
(25) 3.4 Focal length The distance between the objective lens and the data layer of the optical disk is ideally equal to the focal length of the objective lens (at this point the data-layer of the disk is in focus). The focal length f of the objective lens can be found using Figure 12 and the NA equation (paragraph 3.2):. For the HD-DVD format the resulting focal length is 2.3 mm. If we would extrapolate this for a BDformat optical pickup (with a lens diameter of 4 mm) the focal length is only 1.2 mm. This small focal length of the BD-format is why this format is not chosen in the µflow. Besides that in the µflow the distance to the channel from the bottom of the microfluidic chip is 500 µm (chapter 6), an additional distance of 1 mm (chapter 6) is caused by the chip holder, meaning that a BD-format optical pickup cannot be placed at all. For the PHR-803T HD-DVD-format optical pickup 0.8 mm of space is left.. 3.5 Resolution and focal depth For an optical disk player, the smallest optical spot size that can be visualized in theory is determined by the diffraction limit (DL)[Olympus 2009]:. The small wavelength and high NA of the HD-DVD format result in a diffraction limit of 0.4 µm. This resolution allows the µflow to visualize even the smallest cells without any problem. Unfortunately, a trade off between resolution and DOF (Depth of Focus) exists: a high resolution leads to a small DOF. DOF is the range of distance from the focal point of the lens in which the image produced by the lens has a certain sharpness [Olympus 2009]. In the HD-DVD-format the DOF is small, meaning that for reliable data reading from the disk, the data layer should be close to the focal point of the lens. Inside an optical disk player the optical disk rotates at several thousand rotations per minute, for a reliable data transfer the position of the objective lens is adjusted constantly. The need for precise and fast corrections requires a sophisticated autofocus mechanism; this is explained in chapter 4. The importance of DOF for the µflow is explained next. For simplicity the fluorescent particles inside the microfluidic channel of the µflow are represented as a point source of fluorescence light. If the particles are at the focal length of the objective lens, the particles are in focus and maximal fluorescence signal is received by the objective lens. However, in the situation where the particles are at a distance unequal to the focal length, the fluorescent signal is much weaker because much of the light is diffracted away from the focal point of the objective lens.. 25.
(26) 3.6 Gaussian beam The laser inside the optical pickup generates a Gaussian light distribution [Wikipedia 2009]. Near the focal point a Gaussian beam has a characteristic hourglass shape, shown in Figure 14.. Figure 14 Gaussian beam[Wikipedia 2009]. Where ZR is the Rayleigh length: distance from the beam focal point (W0 = waist) where the radius is increased with and the area of the cross section is doubled, the optical intensity drops to of the value at the focal point [Wikipedia 2009].. The radius of the beam at distance z from the waist/ focal point is [Wikipedia 2009]:. This can be rewritten for Z(w) :. The calculated specifications for the PHR-803T optical pickup and a BD-format optical pickup example are shown in Table 3 Table 3 PHR 803T optical pickup specification and BD optical pickup example. CD. DVD. HD-DVD. (BD). λ [nm]. 780. 660. 405. 405. NA. 0.45. 0.6. 0.65. 0.85. Θ[°]. 27. 37. 41. 58. D [mm}. 4. 4. F [mm]. 2.3. 1.2. Space left for optical pickup In µflow [mm]. 0.8. -0.3. 0.4. 0.3. Smallest spot size [µm] Rayleigh length [µm]. 26. 1.1 4.9. 0.7 2.3. 1.2. 0.7.
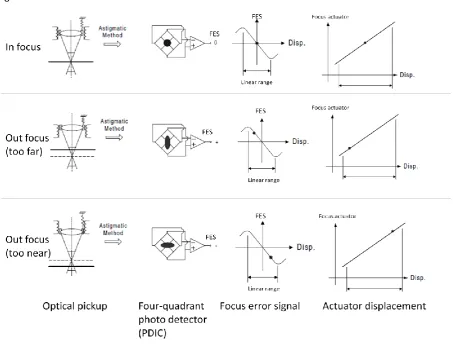
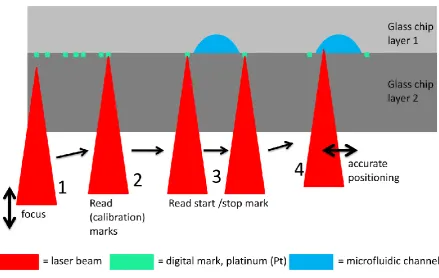
(27) 4 Focus system This chapter deals with the focus system. First the individual parts of the focus system are described. Subsequently a voice coil model is elaborated and simulated in Matlab. Next, the complete focus system including a PID (proportional-integral-derivative) controller is simulated in Matlab. At the end of the chapter the implementation of the PID controller in a microcontroller is described. For robust data transfer, the distance between the data layer of the optical disc and the objective should be kept constant and equal to the focal length of the objective lens (paragraph 3.5). However, during the reading of an optical disk, the distance between the data layer and objective lens will become disturbed. This disturbance is due to the rotating disk, external vibrations or surface defects (scratches, fingerprints, etc). An optical disc player uses a focus system to suppress these disturbances, hereby keeping the data layer continuously within the depth of focus (paragraph 3.5). In the µflow the focus system of the optical pickup is used to find the channels and digital marks (paragraph 6.1). When the particles are correctly focused, optimal detection of their fluorescence by the objective lens is guaranteed. It has to be mentioned that the detection of the objective lens only partly determines the fluorescence detection ability of the µflow. The fluorescence detection limit of the µflow as a whole is determined by the SNR (Signal-to-Noise Ratio):. Where Psignal is the average received fluorescence power and Pnoise is the average noise power; the SNR is depended on the bandwidth.. 4.1 Focus distance measurement Focus distance measurement in the optical pickup is performed using the astigmatic principle. The astigmatic principle uses a cylindrical lens (Figure 15) in front of the photo detectors of the PDIC (Figure 8). This lens has two focal points: one in front and one behind the photo detectors of the PDIC.. Figure 15 astigmatic principle [John 1993]. The photo detectors inside the PDIC have a four-quadrant configuration. The beam spot will produce a circular shape if an object is at the focal length of the objective lens. The cylindrical lens is designed in such a way that this point occurs in between the two focal points of the cylindrical lens. If the object is not at the focal length of the objective lens, the beam spot will have an elliptic shape, the aspect ratio of this ellipse changes as the objective distance increases from the focal length of the objective lens [Odgaard 2004]. This is indicated by the FES (focus error signal), given by [Odgaard 2004]:. 27.
(28) Where A, B, C and D are voltages corresponding to the incident light on the PDIC photo detectors A,B,C and D. The linear range and gain of the FES are determined in paragraph 10.1.1: the linear range corresponds to 6.8 µm, the gain in the linear range is 0.27 V/µm. The FES is also shown in Figure 16.. Figure 16 auto focus [Fan 2001]. 4.2 Moving lens The objective lens should be moved along the vertical axis (focus axis) to adjust the FES to zero (Figure 16). The objective lens is moved by the focus VCA which is a voltage controlled electromagnetic voice coil. The moving objective lens is connected to a damper with four springs, shown in Figure 17. Where m is the moving lens mass [kg], k the spring constant [N/m], C the viscous damping coefficient [N s/m], f (t) is the electromagnetic force of the voice coil actuator [N] and x(t) the displacement [m] of the objective lens. The moving lens system can be modelled as a second order dynamic system, the general form of a second order transfer function is [Torng 2006]:. Where K is the DC gain, ωn is the natural frequency and ζ is the damping ratio.. Figure 17 moving lens (left), dynamic model (right) [Torng 2006]. 28.
(29) Inserting the mass of the objective lens, spring constant and viscous damping coefficient in the transfer function [Torng 2006]:. The transfer function for both the focus and transverse actuator has been calculated in paragraph 9.2. From the transfer function the spring constant and viscous damping coefficients were determined.. 4.3 PID control The focus distance measurement and VCA are integrated in a feedback loop. An electronic controller determines the characteristics of the loop (bandwidth, gain, phase margin). In Figure 18 the complete focus system is schematically shown.. Figure 18 schematic overview of the focus system with transfer parameters. A PID controller was chosen because this controller can be simulated and tuned in Matlab(R2009b). The PID controller is implemented using a microcontroller and therefore an analog-to-digital converter (ADC) and a digital-to-analog converter (DAC) are needed for the data conversion. The output of the PID controller is amplified before it drives the focus VCA. The FES from the PDIC is subtracted from the desired focus error (setpoint = 0) and processed by the PID controller. The PID controller consists of three different blocks (shown in Figure 19). The proportional control amplifies the current error signal with Kp (proportional gain). There will always be a steady state error if only a proportional controller is used. To reduce the steady state error an Integral control part is added. This controller reduces the steady state error to zero.. Figure 19 PID controller [Wikipedia 2006]. The output of the PID controller is the sum of proportional, integral and differential part [Wikipedia 2006]:. 29.
(30) 4.4 Matlab Simulation The transfer function of the total focus system was determined using the transfer functions of the individual blocks: moving lens (paragraph 4.2), VCA driver (paragraph 8.2) PDIC amplifier (paragraph 8.1), PDIC (paragraph 10.1.1). All the transfer parameters are listed in Figure 18. The low-pass filter behind the PDIC results in a low bandwidth of the complete system. The automatic PID tuning function of Matlab recommends using an integral controller (Ki = 0.51). In Matlab the frequency response of the focus system including the integral controller was simulated, the step response (10 µm focus VCA displacement) was simulated in Matlab and is shown in Figure 20. The shape of response corresponds to a stable 2nd order system. The system has a a 13 dB gain margin (calculated by Matlab). Figure 20 focus system response (10 µm step). 4.5 Microcontroller focus controller The focus controller is implemented in a floating point microcontroller. The controller consists of two parts. The first part is looking for a PDIC-FES maximum to position the laser within the linear range of the PDIC focus distance measurement, the PDIC-FES is shown in Figure 21(1).. Figure 21 Microcontroller focus controller (PDIC-FES is shown). When the PDIC-FES linear range is found, the integral controller -tuned by Matlab- takes over (Figure 21 (2)). The PID controller is implemented using the following algorithm (only integral part is used)[Braunl 2008]: –. 30.
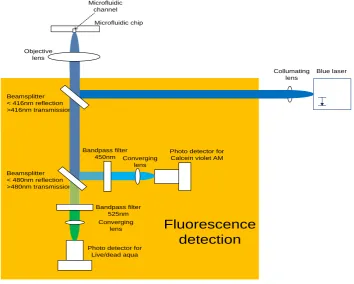
(31) 5 Fluorescence detection In this chapter the fluorescence detection of the µflow is discussed. First the fluorescence setup is shown. Next two different dyes, Fluorescein and fluorescent beads are introduced. The emitted fluorescent light is calculated and suitable photo detectors are chosen.. 5.1 Setup The fluorescence detection is schematically shown in Figure 22. The laser diode (405 nm) excites the fluorescent particles inside the microfluidic channel. Fluorescent light emitted from the microfluidic channel (> 416 nm) is transmitted by the first beamsplitter (Thorlabs MD416). A second beamsplitter (Thorlabs 480) splits the two fluorescence wavelengths: 450 nm is reflected and 525 nm light is transmitted. The reflected light passes a 450 nm bandpass filter (Thorlabs FB450-40), the passband is 40 nm, outside the passband the light transmission is < 0.001 %. After the bandpass filter the light is converged by a Plano-Convex lens (Edmund Sciences NT47-872-INK), an antireflection coating provides < 0.4 % reflectance. The focal spot of the lens is aligned at the active light sensitive areas of the photo detector (paragraph 5.5).The light that is transmitted by the second beamsplitter passes a 525 nm bandpass filter (Thorlabs MF525-39), the passband is 39 nm. After the bandpass filter the light is converged by a Plano-Convex lens (Edmund Sciences NT47-872-INK). Microfluidic channel Microfluidic chip. Objective lens Collumating lens. Blue laser. Beamsplitter < 416nm reflection >416nm transmission. Bandpass filter 450nm Converging lens. Photo detector for Calcein violet AM. Beamsplitter < 480nm reflection >480nm transmission. Bandpass filter 525nm Converging lens Photo detector for Live/dead aqua. Fluorescence detection. Figure 22 fluorescence detection. 31.
(32) 5.2 Fluorescein The first fluorescent experiments of the µflow are performed using Fluorescein sodium salt F6377 [Sigma-Aldrich]. Fluorescein is used as a fluorescent tracer, with an emission of 521 nm [Corkan 1998]. Fluorescein is dissolved in ethanol and the Qe is really sensitive to pH. 5.2.1 Fluorescence power The absorption (A) of light in a liquid is described by Lambert Beer [Banerjee 2008]:. Where ε(λ) is the molar absorptivity, (l) the cuvette length, (k) the volume concentration, (P0) the excitation power and (Pt) the transmitted power. The emitted fluorescence power is [Banerjee 2008]:. Where (Qe) is the quantum efficienty of the liquid (Pa) is the absorbed power (P0) is the excitation power, (Pt) is the transmitted power. Fluorescein ε(525 nm) = 18211 [M-1cm-1] , Qe = 0.8 [Corkan 1998], l= 1.2 µm (Rayleigh length of laser beam, paragraph 3.5), excitation power 1.5 mW (paragraph 10.1.1).. Not all the power will be received by the photo detector. Light will be attenuated by the optical parts in between the microfluidic channel and the photo detector. The light is first attenuated by the Borofloat glass of the microfluidic chip. The transmission of the Borofloat is 90 % (Figure 23).. Figure 23 Borofloat transmission [Valleydesign]. 32.
(33) The emitted light is radiated in all directions, therefore the light captured by the objective lens will depend on the distance of the lens to the channel and the size of the lens. The distance of the lens to the channel is equal to the focal length and was calculated in paragraph 3.4. The high NA of the objective lens results in a relative low attenuation:. After the objective lens, the light will have to pass one (or two) beamsplitter, a bandpass filter and a converging lens. Both the beamsplitters have a 90 % transmission, the bandpass filter will transmit > 90 % of the light within the passband and transmit only < 0.001 % of the light outside the passband. The total attenuation for the 525nm passband and the 405 nm laser band are calculated below.. The power at the photo detector (PD) is:. For different Fluorescein concentrations the 525 nm fluorescence light at the fluorescence photo detector is calculated:. The 405 nm laser power leaking into the fluorescence photo detector is:. Since the photo detector noise (paragraph 5.5) is neglectable compared to the leaking light noise: the leaking light restricts µflow’s limit of detection to , this concentration results in SNR = 1.3 (only leaking light contribution). For a lower limit of detection the 405 nm leaking light has to be filtered by an additional lowpass filter (placed after the first beamsplitter).. 5.3 Beads Handling cells and dyes can be difficult and time consuming. Because a limited time is available for experiments, fluorescent polystyrene beads are used first. The same photon detectors and optic filters will be used throughout all experiments, this requires the emission spectrum of the beads to be similar to the dyes (paragraph 5.4). The diameter of the bead should be comparable to the stained cells. Eventually two different diameter beads with an emission of 460 nm were chosen. The two different sizes (2.5 µm and 6 µm) can mimic the difference between spermatozoa and larger cells and allows size recognition experiments.. 33.
(34) The two beads specifications are listed below [Invitrogen 2001]: P12825 PeakFlow cytometry reference beads 2.5 µm diameter, 3 mL, . P12826 PeakFlow cytometry reference beads 6 µm diameter, 3 mL,. 5.4 Dyes For the fluorescent detection of cells, the cells have to be labelled with a fluorescent dye. In the µflow a 405 nm violet laser is used. This wavelength is relatively new and therefore only a limited amount of dyes is available. The company Invitrogen offers two violet excited dyes that can be used for the combined detection of viability and vitality of cells. These dyes do not required fixed cells. 5.4.1 Viability indicator The L34957 LIVE/DEAD Fixable Aqua Dead Cell dye kit [Invitrogen 2009] can be used for viability measures (membrane integrity). This dye kit uses a violet excitable dead cell dye with an emission of 526 nm. The fluorescent dye labels dead cells more brightly than living cells because the dye stains the cytoplasm of the cells that have lost membrane integrity (Figure 24).. Figure 24 principle of LIVE/DEAD Fixable Dead Cell dye kit. The dye only interacts on surface of living cells and yields low fluorescent (left). Dye reacts throughout volume of cell with compromised membrane, yielding highly fluorescent (right) [Invitrogen 2009].. 5.4.2 Vitality indicator The C34858 CellTrace calcein violet, AM (Acetoxymethyl) [Invitrogen 2006] can measure the enzyme activity of cells and is an indicator of vitality. This dye kit uses a violet excitable AM dye with an emission of 440 nm. The AM dye can indicate the level of intercellular esterase activity of a cell. This is determined by the enzymatic conversion of the non fluorescent AM ester to a fluorescent dye that is retained in the cell. Vital cells are yielding highly fluorescent because of their high intracellular esterase activity. The combination of the two dyes creates a robust violet excited live/dead assay. Viability and vitality of cells can be detected using only one violet laser.. 34.
(35) 5.5 Photo detector A photo detector is capable of converting light into an electric current. The three most common photo detectors are: the photodiode, APD and the PMT. 5.5.1 Photodiode The photodiode is a light sensitive semiconductor PN (P-type and N-type) junction. When light energy greater than the semiconductor material’s bandgap strikes the junction, it excites electrons and generates holes. In contrast to the avalanche photodiode (paragraph 5.5.2) and photomultiplier (paragraph 5.5.3) the photodiode has no internal gain. For the detection of low intensity light an external amplification (op-amp) is needed. This amplification adds noise and therefore photodiodes are only used for high intensity light levels where limited external amplification is needed. In the µflow photodiodes are used in the PDIC for focus distance measurements and channel recognition since these applications operate at high intensity light levels. For fluorescence detection, extremely low light levels have to be detected (paragraph 5.2.1), at these light levels the photodiode and amplifier performances result in unwanted low SNR’s(Figure 25). Therefore, photodiodes are not suitable for fluorescence detection [Kauffman 2000],[Kauffman 2005].. Figure 25 photo detectors SNR for different light powers, bandwidth 2 KHz (SNR of complete system including external op-amp amplification) [Kauffman 2005]. 5.5.2 Avalanche photodiode An APD consists just like a photodiode (paragraph 5.5.1) of a light sensitive semiconductor PN junction. By placing a reverse voltage on the PN junction, electrons are accelerated. Each time an electron collides with the crystal lattice an electron-hole pair is generated, this is called ‘avalanching’. The avalanche effect amplifies the initial signal by a factor > 50 [Kauffman 2000]. The avalanching effect creates more noise compared to a photodiode but less compared to an external amplifier. Therefore APD is used for low light levels where a photodiode in combination with an external amplifier produces too much noise. The use of an APD in the fluorescence detector of the µflow will result in a higher SNR compared to a photodiode (Figure 25). For extreme low light levels (photon counting) the APD’s SNR is slightly lower compared to a PMT (paragraph 5.5.2), for intermediate light levels the APD’s SNR can be higher compared to a PMT. Because of the high SNR at low light levels an APD would be suitable for fluorescence detection in the µflow [Kauffman 2000],[Kauffman 2005].. 35.
(36) 5.5.3 Photomultiplier For extreme sensitive light detection, a PMT can be used. The PMT is a vacuum tube that generates electron-hole pairs on light exposure. Plates inside the tube accelerate the electrons almost noise free, which results in an internal gain > 105. The PMT has a high dynamic range and high SNR’s for extreme weak light (Figure 25), however the quantum efficiency < 20 %, is low compared to (avalanche) photodiodes (quantum efficiency < 80 %). Because of the large size, high price and the need for sensitive handling, the PMT is not suitable for the µflow [Kauffman 2000]. Recently, new semiconductor photomultipliers have been developed. Compared to the PMT these devices have a higher quantum efficiency, smaller size, lower operating voltages and lower prices. The company Hamamatsu offers a MPPC (Multi Pixel Photon Counter). This is a semiconductor photomultiplier made of multiple APD’s that are operated at a reverse voltage higher than the breakdown voltage resulting in gains > 105. The APD’s are arranged in a matrix of 100 (pixels), each pixel outputs a pulse when it detects one photon. The MPPC output signal is the sum of all the individual pixel signals. This semiconductor photomultiplier is at many points superior compared to an APD (Table 4) and is therefore chosen as fluorescence detector in the µflow[Hamamatsu]. 5.5.4 Fluorescence detector For the fluorescence detector a semiconductor photomultiplier was chosen: Hamamatsu S10362-11100U. Specifications are shown in Table 4. For comparison and backup purposes an APD was bought: EG & G VACTEC C30902EH (Farnell: 1182339). This APD was bought because it was easy obtainable from the Farnell assortment. Specifications of both the MPPC and APC are shown in Table 4. Table 4 comparison of APD and semiconductor photomultiplier. Avalanche photodiode C30902EH Wavelength (peak sensitivity) [nm] Spectral response [nm] PDE (Photon Detection Efficiency) [%] Fill factor [%] Sensitivity Internal gain Active area [mm2] Bandwidth [MHz] Dark noise Operating voltage [V] Package Price [euro]. 830. 100 77 A/W ≈ 100 0.2 (0.5 mm diameter, round shape) 800 15 nA 200 TO-18 (5.3 mm can) 128. semiconductor photomultiplier S10362-11-100U 440 320 – 900 45 (440 nm) 61,5 240.000 1 (1 mm x 1 mm, squared shape) 10 800 kcps (0.5 p.e.) 70 TO-18 (5.3 mm can) 96. The peak sensitivity of the MPPC is closer to the wavelengths used for fluorescence detection in the µflow. Because of the high internal gain of the MPPC the sensitivity is more than 100 times higher compared to the APD and therefore less external amplification is required. Another important aspect is the active area of the sensor. The small active area of the APD makes alignment of the detector really difficult. APD’s with a large active area are available but prices are proportional to the active area. The MPPC has a five times larger active surface and a lower price compared to the APD. Bandwidth of both detectors is more than sufficient. Both the MPPC and the APD require a high voltage supply for the reverse bias voltage. The output signal of the MPPC is the sum of all the 100 APD pixels. When a photon is incident on one of the APD pixels a current pulse is generated. This current pulse is converted to a voltage pulse by a transimpedance amplifier (current to voltage amplifier). The shape and pulse height are the same for 36.
(37) every incident photon. By comparing the pulse with a threshold value of 50 % of the pulse height (notated as 0.5 p.e photon energy), the amount of incident photons can be counted with a comparator, these counts are usually notated as kcps (kilo counts per seconds). The pulse time is about 100 ns, during this time the MPPC pixels are not sensitive for any other incident photons. In case more than one of the APD pixels receives a photon instantaneously, the pulse height will increase proportional to the amount of activated pixels[Hamamatsu]. Just like any other semiconductor the MPPC generates noise due to thermal excitation, this noise is amplified by the reverse voltage. The MPPC cannot discriminate between pulses produced by photons or thermal noise. In Table 4 the thermal noise is called dark noise and is for the MPPC defined as the amount of pulses produced by thermal excitation. For higher light levels the dark noise can be reduced by choosing a higher comparator threshold of 1.5 or 2.5 p.e. At these comparator levels - that respectively count two or three activated pixels - dark noise is very unlikely and therefore the dark count will be lower. Dark noise measurement at different comparator thresholds are shown in paragraph 10.2. Dark noise can be further reduced by choosing a longer time span over which the photons are counted[Hamamatsu]. To speed up the experiments a MPPC module C10507-11-100U was bought. This module consists of: a MPPC photodiode, current to voltage converter, comparator circuit, high voltage power supply, temperature compensation circuit, counter and USB interface (Figure 26).. Figure 26 MPPC module [Hamamatsu]. The pulses generated by the MPPC are converted to a voltage by the transimpedance (current to voltage) amplifier. The voltage pulses are amplified, and the comparator compares the pulse height with a threshold voltage corresponding to one (two or three) incident photons. The amount of incident photons is counted and the counter values are sent to a computer via a USB interface. The MPPC gain is temperature and voltage dependent: when the temperature raises the gain at a fixed bias voltage decreases. To obtain a stable gain, the MPPC module is monitoring the temperature and adjusting the bias voltage continuously. The downside of this module is that it does not operate on Windows 7 and the module cannot be connected directly to a Labview program. The only way to connect the module to Labview is to use the digital counter output of the module. This digital output outputs the digital pulses from the comparator and can be connected to the Labview DAQ of the µflow (paragraph 7.1). Besides the MPPC module, electronics for operating two MPPC’s are built. These electronics are incorporated on the µflow’s PCB (paragraph 8.5) and consist of: a transimpedance amplifier, voltage amplifier, comparator and counter. These electronics allow simultaneous detection at two fluorescence wavelengths.. 37.
(38) 5.5.5 Photon detection The energy of a photon (e) depends on the Planck constant h [m2 kg / s |, speed of light c [m/s] and the wavelength λ *nm] [Wikipedia 2010].. The total number of incident photons at the MPPC (nd):. For a Fluorescein concentration of photons at the MPPC:. (paragraph 5.2.1) the total number of incident. The PDE (Table 4) indicates what percentage of the incident photons is detected by the MPPC. Each detected photon will result in one photon count:. 38.
Figure
+7


Outline
Related documents
First the Inca Kola ad shows a remarkable gender stereotype where women is the housewife and have to serve to her family, in this case the mother is serving to his husband and
However, this would likely give rise to much litigation to determine whether this was consistent with the MSFCMA and not an overly broad reading of section 1856(a)(3)(A) of that
Passed time until complete analysis result was obtained with regard to 4 separate isolation and identification methods which are discussed under this study is as
In Model I, we consider the impact of changes in exogenous density, D, and exogenous residential location, RL, on trip chaining, TC, activity space, AS, and travel demand,
[r]
Cap Types : Silktop cap (extra cost), Monocap (reduced cost), injected knots cap (extra cost) , Thin skin Cap(extra cost) Stretch lace, Adjustable Straps, Elastic Lace.
This study provides the first long term (15–17 years post- graduation) analysis of practice locations of nursing and a subset of allied health graduates after an undergraduate
By the 1920s and 1930s, kabuki was mainstream entertainment and the actors portrayed in the prints of Stars of the Tokyo stage were wildly popular for their exciting
