Original Article
Expression of Sirt1 and FoxP3 in classical Hodgkin
lymphoma and tumor infiltrating lymphocytes:
Implications for immune dysregulation,
prognosis and potential therapeutic targeting
Andrés E Quesada1, Binara Assylbekova1, Christine E Jabcuga2, Rongzhen Zhang1, Michael Covinsky1, Adan Rios3, Nghia D Nguyen1, Robert E Brown1
1Department of Pathology and Laboratory Medicine, UTHealth-Medical School at Houston, Houston, USA; 2Cunningham Pathology, Birmingham, Alabama, USA; 3Department of Internal Medicine, Division of Oncology, UTHealth-Medical School at Houston, Houston, USA
Received August 26, 2015; Accepted September 28, 2015; Epub October 1, 2015; Published October 15, 2015
Abstract:Background: Hodgkin Reed-Sternberg (HRS) cells may promote differentiation of CD4+ naïve T cells to-ward both FoxP3+ T regulatory (Treg) cells and TIA-1+ cytotoxic T lymphocytes (CTL). Previous studies suggest that an overabundance of cytotoxic TIA-1+ cells in relation to FoxP3+ T reg cells portends unfavorable outcomes in clas-sical Hodgkin lymphoma (cHL), raising the possibility that its pathogenesis may be related to immune dysregulation. Sirt1 deacetylates FoxP3 and leads to decreased Treg functionality. Our objective was to compare Sirt1 and FoxP3
expressions in Hodgkin lymphoma infiltrating lymphocytes (HLIL) and confirm Sirt1 expression in HRS cells. Design: Immunohistochemical staining of paraffin-embedded tissue with antibodies to Sirt1, FoxP3, TIA-1, and CD8 was
performed. Expression of Sirt1was assessed in both the HRS cells and in the HLILs in twenty-four cases. Adequate tissue was available in 13 cHL cases to permit the enumeration of FoxP3, TIA-1 and CD8 by giving their percent staining of HLILs. Results: In HLILs, nuclear expression of Sirt1 was 32-88% (mean 67%); FoxP3 expression was 9-40% (mean 23.9%); TIA-1 expression was 15-87% (mean 32%); and CD8 expression was 10-45% (mean = 31%). Sirt1 to FoxP3 ratio was 0.96-5.5 (mean 3.2). TIA-1 to FoxP3 ratio was 0.6-5.1 (mean 1.6). CD8 to FoxP3 ratio was 0.43-3.7 (mean 1.5). There was a difference of Sirt1 to FoxP3 ratios between remission and recurrence groups,
being significantly higher in the recurrence group (P = 0.005). Sirt1 demonstrated high nuclear expression in the
HRS cells of 21 out of 24 (88%) cases analyzed. Conclusion: The relative overexpression of Sirt1 to FoxP3 in HLILs may be considered possible targets for immune modulation. Histone deacetylase inhibitors may increase the
ef-ficacy of existing treatment regimens by downregulating SIRT1 gene mRNA/ Sirt1 protein function and together with rapamycin could expand the T regulatory/FoxP3 population and functionality and improve prognosis for remission in cHL. Targeting Sirt1 in the HRS cells may facilitate their ability to promote naïve T cell differentiation toward Treg cells over CTL.
Keywords: Sirt1, FoxP3, Hodgkin lymphoma, immune dysregulation, morphoproteomics
Introduction
Classical Hodgkin lymphoma (cHL) is com-posed of various non-neoplastic, reactive cells with only a minority of malignant cells (Reed-Sternberg cells and Hodgkin cells) [1, 2]. Existing evidence in most cases supports the notion that these malignant cells in cHL origi-nate from germinal center B cells [1-6]. The etiopathogenesis of cHL is still a subject of con-siderable investigation and debate. A role for
of Hodgkin lymphoma in 11 children, in one study [9]; and 4. An associated autoimmune disease was reported in 14 of 121 (11.5%) Hodgkin lymphoma patients in a report of a single center experience [10].
In support of immune dysregulation and/or autoimmunity in the pathogenesis of Hodgkin lymphoma, it is noteworthy that the presence of cytotoxic TIA-1+ cells was found to be an unfa-vorable prognostic factor of event-free survival and disease-free survival in Hodgkin lymphoma [11]. Also, activated cytotoxic T cells expressing granzyme B and associated with CD8+ cells had a shortened progression-free survival time in patients with Hodgkin’s lymphoma [12]. Additionally, a ratio of FoxP3 positive T regula-tory cells to activated cytotoxic T lymphocytes (identified by positive granzyme B stain) of 1 or less may predict a poor failure-free survival [13]. Alvaro and co-workers reported that a low infiltration of FoxP3+ cells in conjunction with a high infiltration of TIA-1+ cells may represent biological markers predicting an unfavorable outcome [14]. Conversely, the failure-free sur-vival in cHL statistically increased with a higher number of FoxP3+ tumor infiltrating lympho -cytes [14] and in another study, an increased number of tumor-infiltrating FoxP3+ cells over the receiver operating characteristic-deter-mined cut-offs positively influenced overall and failure-free survival in cHL [15].
If one accepts, for the sake of argument, this premise of an autoimmune component or immune dysregulation in the pathogenesis of Hodgkin disease, then expanding the T regula-tory cells and their functionality would be criti-cal in effecting a positive outcome for patients with this disease. Furthermore, identifying pathways and proteins that reduce the func-tionality of the T regulatory cells would be important in assessing the resistance signa-ture to conventional therapies, in correlating the clinical response to agents that reduce such inhibitory pathways and in designing future therapies intended to target proliferation while restoring proper immune regulation. Conceivably, an increase in the numbers of functional FoxP3 T regulatory cells could be accomplished by inhibition of Sirt1 (silent mat-ing type information regulation 2 homolog 1), a member of the histone deacetylase Sirtuin family which is known to downregulate FoxP3
[16-20]. To expand on this, FoxP3 expression and stabilization via acetylation is necessary for regulatory T cell differentiation and function-ality and Sirt1, as an NAD+ histone deacetylase can lead to destabilization. Inhibition of Sirt1 strengthens the suppressive action of Tregs [16-20]. Panobinostat is a pan-deacetylase inhibitor which was shown by Lemoine et al. to have activity against Hodgkin lymphoma de- rived cell lines, inducing cell death as well as inhibiting the Sirt1 pathway [21]. Similarly, the combinatorial use of niacinamide and vorino-stat, as sirtuin and pan-class I/II deacetylase (DAC) inhibitors, has been shown to result in a response rate of 24% in relapsed or refractory lymphoma patients with an additional 57% reportedly achieving stable disease [22]. Morphoproteomics is a technique which uses bright-field microscopy and immunohistochem -istry to study and understand the molecular cir-cuitry of tumors and their microenvironment by observing the expression and when applicable, activation of various protein analytes and their correlative expressions in order to define the biology of pathologic processes [23, 24]. Our study was designed to attempt to gain further understanding of the pathologic mechanisms which may be driving classical Hodgkin lympho-ma. We sought to confirm that the Hodgkin Reed-Sternberg cells express Sirt1 [25]. In addition, we proposed to analyze the ratios of Sirt1/FoxP3, CD8/FoxP3 and TIA-1/FoxP3 in the Hodgkin lymphoma infiltrating lymphocytes (HLIL) to characterize the T lymphocyte milieu, which may be contributing to tumorigenesis and prognosis. A better understanding of the tumoral microenviroment, particularly immuno-logically active T lymphocytes may allow favor-able interventions via promotion of growth or biological activity of subsets of T cells that leads to immune balance and that may be essential to the successful remission of Hodgkin disease.
Materials and methods
follow-CD8:FoxP3 and TIA-1:FoxP3 and of Sirt1: FoxP3 were calculated as a surrogate for the ratio of cytotoxic T cells:T regulatory tumor infil -trating lymphocytes in the case of the former and in the case of Sirt1:FoxP3, the potential for reduction in functionality of T regulatory tumor infiltrating lymphocytes. In addition, the per -cent of HRS cells expressing Sirt1 was com-pared to the percent of HLILs expressing Sirt1. The percent of HLILs expressing Sirt1 was esti-mated by two of the authors (AQ, BA). The val-ues obtained were averaged and compared to those cases of Hodgkin lymphoma which highly expressed Sirt1 (n = 21).
Statistical analysis was also performed using the Student’s t-test to compare the percent expression of Sirt1 in HRS versus HLILs. In addition, linear regression analysis of these two groups was conducted to obtain a correla-tion coefficient. Finally, statistical analysis to compare the mean ratios from the remission and recurrence groups was also accomplished using the Student’s t-test.
Results
Sirt1, TIA-1 and CD8 expressions and correla-tion with FoxP3
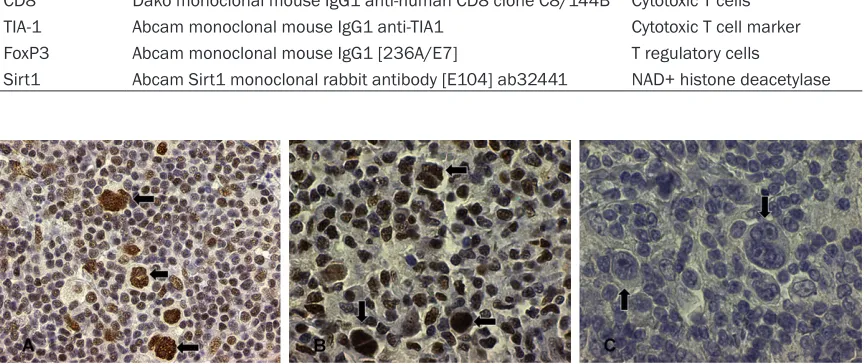
Sirt1 demonstrated high nuclear expression in 21 out of 24 (88%) classical Hodgkin
lympho-Table 1. Immunohistochemical protein markers and antibody specifics
Protein Analyte Antibody Specifics Represents CD8 Dako monoclonal mouse IgG1 anti-human CD8 clone C8/144B Cytotoxic T cells TIA-1 Abcam monoclonal mouse IgG1 anti-TIA1 Cytotoxic T cell marker FoxP3 Abcam monoclonal mouse IgG1 [236A/E7] T regulatory cells
[image:3.612.90.523.85.153.2]Sirt1 Abcam Sirt1 monoclonal rabbit antibody [E104] ab32441 NAD+ histone deacetylase
Figure 1. Sirt1 highly expressed in the nuclei of Hodgkin Reed-Sternberg cells by immunohistochemistry (A and B,
arrows HR-S) and variably in the tumor infiltrating lymphocytes (B) from two cases of cHL in our study, contrast with negative control in (C) (original magnification, ×400 A ×600 B and C).
up data were available for 10 cases. Seven patients achieved remission and three experi-enced a recurrence of disease. These patients were divided into remission (n = 7) and recur-rence groups (n = 3).
[image:3.612.91.525.105.287.2]ma cases analyzed (Figure 1). Three cases did not show high expression in the HRS cells. In addition, Sirt1 was also variably positive in the background tumor infiltrating lymphocytes with 16 of the 24 cases (67%) showing nuclear expression of Sirt1 in 50% or more cells (Figure 1).
The ratio between Sirt1 and FoxP3 positive lymphocytes was examined in thirteen cases.
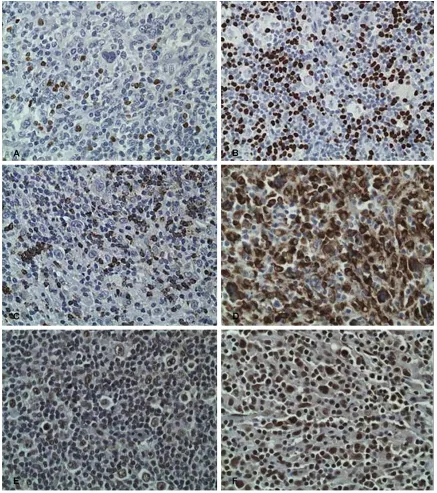
The nuclear expression of Sirt1 in HLILs was 32-88% (mean 67%), while FoxP3 expression was 9-40% (mean 23.9%) (Figure 2). The Sirt1 to Foxp3 ratio ranged from 0.96-5.5 (mean = 3.2). TIA-1 expression was 15-87% (mean = 32%). The TIA-1 to FoxP3 ratio ranged from 0.6-5.1 (mean = 1.6). The expression of CD8 was 10-50% (mean = 31%). The CD8 to FoxP3 ratio ranged from 0.43-3.7 (mean = 1.5) (Table 2
[image:4.612.88.525.71.564.2]and Figure 2).
Figure 2. HLIL expression of (A) FoxP3, labeled as 9% staining in case 7, (B) FoxP3, labeled as 40% in case 11, (C) TIA-1, 15% in Case 4, (D) TIA-1, 87% Case 10, (E) Sirt1, 50% in Case 6, (F) Sirt1, 88% Sirt1 in Case 10. Images for
Sirt1 expression in Hodgkin Reed-Sternberg cells versus Hodgkin lymphoma infiltrating lymphocytes
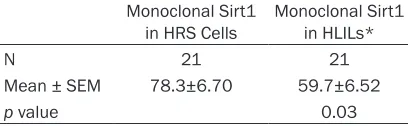
There were 21 cases of Hodgkin lymphoma which showed increased expression of Sirt1 within the HRS cells. Statistical analysis showed a significant difference between the mean per -cent expression within the HRS cells when com-pared to the mean percent expression within the HLILs (78.3±6.70 versus 59.7±6.52; P = 0.03) (Table 3). The correlation coefficient obtained by linear regression was r = 0.39.
Sirt1to FoxP3 and cytotoxic T lymphocyte to FoxP3 ratios and clinical outcomes
In the ten cases with follow-up data, seven patients obtained remission whereas three pa-
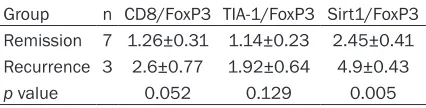
tients had recurrence at the time of the analy-sis. Statistical analysis revealed a significant difference (P < 0.005) of Sirt1:FoxP3 ratio between the remission and recurrence groups. There was also a trend towards significance in the CD8:FoxP3 ratio (P = 0.052) (Table 4).
Discussion
In this study, we documented the expression patterns of Sirt1 in HRS of cHL. We also sought to investigate the tumor milieu in the form of HLILs by determining the ratio of cytotoxic T lymphocytes to T regulatory lymphocytes. Any upregulated proteins in the tumor cells them-selves may provide supplemental targets with therapeutic intent, and a better understanding of the environment in which the tumor is grow-ing may provide greater insight into the patho-physiology of the disease. In addition, modify-ing this environment could suppress tumor growth.
[image:5.612.92.523.96.295.2]Our finding of high nuclear expression of Sirt1 in HRS cells in 88% of the cases of cHL reaf-firms the earlier report of Sirt1 expression in the Hodgkin Reed-Sternberg cells [25]. In this context, the observation that Reed-Sternberg cells, in an in vitro cell line study, have been shown to promote bidirectional differentiation of CD4+ naïve T cells toward both T regulatory and cytotoxic T cells [27] is relevant to the Sirt1 expression in HRS and in the HLIL. We found a statistical difference between the percent
Table 2. Thirteen cases of classical Hodgkin lymphoma with the percentage expression of FoxP3, TIA-1, CD8 and Sirt1 in HLILs and the ratios of CD8, TIA-1 and Sirt1 to FoxP3
Case FoxP3 TIA CD8 Sirt 1 in HLIL CD8/FoxP3 TIA-1/FoxP3 Sirt1/FoxP3
Case 1 30 20 33 57 1.1 0.66 1.9
Case 2 23 45 10 82 0.43 1.95 3.56 Case 3 33 40 25 32 0.75 1.21 0.96
Case 4 25 15 40 72 1.6 0.6 2.88
Case 5 27 30 50 70 1.85 1.11 2.59
Case 6 30 18 18 50 0.6 0.6 1.66
Case 7 9 23 33 50 3.66 2.55 5.55
Case 8 15 35 40 65 2.66 2.33 4.33
Case 9 18 33 45 65 2.5 1.83 3.61
Case 10 17 87 27 88 1.58 5.11 5.17 Case 11 40 25 20 82 0.5 0.62 2.05 Case12 27 33 40 77 1.48 1.22 2.85 Case 13 17 15 25 82 1.48 0.88 4.82 AVERAGE 23.92 32.23 31.23 67.08 1.55 1.59 3.23
Table 3. Comparison of the mean and standard error of the mean for percent expression of Sirt1 in Hodgkin Reed-Sternberg (HRS) cells versus Hodgkin lymphoma infiltrating lympho -cytes (HLIL)
Monoclonal Sirt1
in HRS Cells Monoclonal Sirt1 in HLILs*
N 21 21
Mean ± SEM 78.3±6.70 59.7±6.52
p value 0.03
[image:5.612.91.295.381.444.2]expression of Sirt1 in the HRS cells as com-pared to that in the HLILs. Interestingly, howev-er, there was a mild positive correlation between the two. While the HRS appears to express Sirt1 to a significantly greater extent than the surrounding HLILs, the expression of each seems to increase together.
As previously stated, one of the deacetylation targets of Sirt1 is known to be FoxP3, a tran-scription factor pivotal in the differentiation and function of T regulatory lymphocytes. Sirt1 deacetylation results in destabilization and enhanced degradation of FoxP3 promoting T regulatory cell decline and/or underactivity and inhibition of Sirt1 increases the suppressive action of Tregulatory cells [16-20]. Thus, Sirt1 inhibition may also allow HRS cells to promote the differentiation of CD4+ naïve T cells toward Tregs.
We suggest the possibility that immune dysreg-ulation may be playing a larger role in the patho-genesis of Hodgkin lymphoma than previously thought. The patients who suffered a recur-rence in this study had a statistically significant increase in the ratio of Sirt1 to FoxP3 as com-pared to the patients who were in remission. The skewed ratio implies a decrease in T-regulatory cells with a resultant imbalance relative to cytotoxic T-cells. In the ten cases with follow-up data, statistical analysis revealed a significant difference (P < 0.005) of Sirt1 to FoxP3 ratio between the remission and recur-rence groups. There was also a trend towards significance in the CD8 to FoxP3 ratio (P = 0.052). An analogy drawn from the commonali-ty of germinal center B-cell origins of cHL and germinal center-like diffuse large B-cell and fol-licular lymphomas is the correlation of high numbers of intratumoral FoxP3+ regulatory T cells and improved survival in both [1-6, 15]. The overexpression of Sirt1 in RS and the high mean ratios of Sirt1 and TIA-1 to FoxP3 in the HLILs may be amenable to modulation to influ
-ence clinical outcomes. Conceivably, histone deacetylase inhibitors (such as vorinostat [SAHA]) may increase the efficacy of existing treatment regimens by downregulating Sirt1 gene mRNA/Sirt1 protein function and reduc-ing Sirt1 deacetylase activity [28-30]. A dec- rease in Sirt1-related deacetylation of FoxP3 could reduce the negative modulation of the T regulatory (FoxP3+) cell population. Should immune dysregulation and/or auto-immunity play a contributing role in the pathogenesis of Hodgkin lymphoma, then the inhibition of the Sirt1 pathway could provide additional benefit by upregulating the expression of FoxP3. In turn, this would block the inhibitory modulation of T regulatory cells and potentially restore immune balance in the tumoral microenvi- ronment.
Proofs of concept of the possible role of inhibit-ing Sirt1 pathway and at the same time expand-ing the Tregulatory cells to restore immune bal-ance in cHL is contained in the recent report of a case of multiply recurrent Hodgkin lymphoma that experienced complete clinical remission with vorinostat and sirolimus. Morphoprote- omics and biomedical analytics, with a focus on the respective roles of vorinostat and siroli-mus in targeting Sirt1 and expanding the T reg-ulatory cells and downregulating CD8 cells pro-vided correlates of the response signature in this case [31]. A follow-up study with 28 heavily pretreated refractory cHL patients treated with vorinostat and sirolimus showed a complete response in 32% and a partial response in 25% [32].
[image:6.612.91.304.97.151.2]In summary, this study demonstrates that, in a limited number of patients with cHL, the remis-sion and relapse status can be correlated with the ratio of Sirtl and FoxP3 expression and therefore, carries prognostic implications. Our findings also provide a basis to relate the appar -ent clinical significance of the relative overex -pression of Sirtl vis-à-vis FoxP3 cells in the HLIL with dysregulation of the T cell ratios in the tumoral microenviroment and dys- immunity in cHL. Histone deacetylase inhibitors may inc- rease the efficacy of existing treatment regi -mens by downregulating SIRT1 gene mRNA/ Sirt1 protein function and together with rapamy-cin could expand the T regulatory/FoxP3 popu-lation and functionality and improve prognosis for remission in cHL [16-20, 28-31]. Targeting
Table 4. Statistical analysis of ratios comparing remission to recurrence groups
Group n CD8/FoxP3 TIA-1/FoxP3 Sirt1/FoxP3 Remission 7 1.26±0.31 1.14±0.23 2.45±0.41 Recurrence 3 2.6±0.77 1.92±0.64 4.9±0.43
Sirt1 in the HRS cells also may facilitate their ability to promote naïve T cell differentiation toward Treg cells over CTL [27]. Further exami-nation of this pathway and its relationship to T cell microenvironment and immune dysregula-tion in cHL is warranted, as it carries thera- peutic implications for improved patient out- comes.
Acknowledgements
The authors thank Pamela K. Johnston, HT (ASCP) for technical assistance and Ms. Bheravi Patel for secretarial and graphic support.
Disclosure of conflict of interest
None.
Address correspondences to: Dr. Robert E Brown, Department of Pathology and Laboratory Medicine, University of Texas Medical School at Houston, 6431 Fannin St, MSB, Houston TX 77030, USA. E-mail: [email protected]
References
[1] Kuppers R. Molecular biology of Hodgkin’s lym-phoma. Adv Cancer Res 2002; 84: 277-312. [2] Kuppers R, Hansmann ML. The Hodgkin and
Reed/Sternberg cell. Int J Biochem Cell Biol 2005; 37: 511-517.
[3] Hummel M, Ziemann K, Lammert H, Pileri S, Sabattini E, Stein H. Hodgkin’s disease with monoclonal and polyclonal populations of Reed-Sternberg cells. N Engl J Med 1995; 333: 901-906.
[4] Stein H, Hummel M. Cellular origin and clonal-ity of classic Hodgkin’s lymphoma: immuno-phenotypic and molecular studies. Semin He-matol 1999; 36: 233-241.
[5] Kuppers R. Identifying the precursors of Hodg-kin and Reed-Sternberg cells in HodgHodg-kin’s dis-ease: role of the germinal center in B-cell
lym-phomagenesis. J Acquir Immune Defic Syndr
1999; 21 Suppl 1: S74-79.
[6] Marafioti T, Hummel M, Foss HD, Laumen H,
Korbjuhn P, Anagnostopoulos I, Lammert H, Demel G, Theil J, Wirth T, Stein H. Hodgkin and reed-sternberg cells represent an expansion of a single clone originating from a germinal cen-ter B-cell with functional immunoglobulin gene rearrangements but defective immunoglobulin transcription. Blood 2000; 95: 1443-1450. [7] Landgren O, Engels EA, Pfeiffer RM, Gridley G,
Mellemkjaer L, Olsen JH, Kerstann KF, Wheeler W, Hemminki K, Linet MS, Goldin LR. Autoim-munity and susceptibility to Hodgkin
lympho-ma: a population-based case-control study in Scandinavia. J Natl Cancer Inst 2006; 98: 1321-1330.
[8] Bernatsky S, Ramsey-Goldman R, Isenberg D, Rahman A, Dooley MA, Sibley J, Boivin JF, Jo-seph L, Armitage J, Zoma A, Clarke A. Hodg-kin’s lymphoma in systemic lupus erythemato-sus. Rheumatology (Oxford) 2007; 46: 830- 832.
[9] Jarrasse C, Pagnier A, Edan C, Landman-Park-er J, Mazingue F, Mansuy L, BLandman-Park-ertrand Y, Pail-lard C, Pellier I, Margueritte G, Plantaz D. [Hodgkin disease and autoimmunity in chil-dren: 11 case reports]. Arch Pediatr 2011; 18: 376-382.
[10] Varoczy L, Payer E, Kadar Z, Gergely L, Miltényi Z, Magyari F, Szodoray P, Illés A. Malignant lym-phomas and autoimmunity-a single center ex-perience from Hungary. Clin Rheumatol 2012; 31: 219-224.
[11] Alvaro-Naranjo T, Lejeune M, Salvado-Usach MT, Bosch-Príncep R, Reverter-Branchat G,
Jaén-Martínez J, Pons-Ferré LE. Tumor-infiltrat -ing cells as a prognostic factor in Hodgkin’s lymphoma: a quantitative tissue microarray study in a large retrospective cohort of 267 pa-tients. Leuk Lymphoma 2005; 46: 1581-1591. [12] Oudejans JJ, Jiwa NM, Kummer JA, Ossenkop-pele GJ, van Heerde P, Baars JW, Kluin PM, Kluin-Nelemans JC, van Diest PJ, Middeldorp JM, Meijer CJ. Activated cytotoxic T cells as prognostic marker in Hodgkin’s disease. Blood 1997; 89: 1376-1382.
[13] Kelley TW, Pohlman B, Elson P, Hsi ED. The ra-tio of FOXP3+ regulatory T cells to granzyme B+ cytotoxic T/NK cells predicts prognosis in classical Hodgkin lymphoma and is indepen-dent of bcl-2 and MAL expression. Am J Clin Pathol 2007; 128: 958-965.
[14] Alvaro T, Lejeune M, Salvado MT, Bosch R, Gar-cía JF, Jaén J, Banham AH, Roncador G, Mon-talbán C, Piris MA. Outcome in Hodgkin’s lym-phoma can be predicted from the presence of accompanying cytotoxic and regulatory T cells. Clin Cancer Res 2005; 11: 1467-1473. [15] Tzankov A, Meier C, Hirschmann P, Went P,
Pileri SA, Dirnhofer S. Correlation of high num-bers of intratumoral FOXP3+ regulatory T cells with improved survival in germinal center-like diffuse large B-cell lymphoma, follicular lym-phoma and classical Hodgkin’s lymlym-phoma. Haematologica 2008; 93: 193-200.
[16] Beier UH, Akimova T, Liu Y, Wang L, Hancock WW. Histone/protein deacetylases control Foxp3 expression and the heat shock response of T-regulatory cells. Curr Opin Immunol 2011; 23: 670-678.
Foxp3+ T-regulatory cell function and prolongs allograft survival. Mol Cell Biol 2011; 31: 1022-1029.
[18] Beier UH, Wang L, Han R, Akimova T, Liu Y, Hancock WW. Histone deacetylases 6 and 9 and sirtuin-1 control Foxp3+ regulatory T cell
function through shared and isoform-specific
mechanisms. Sci Signal 2012; 5: ra45. [19] Kwon HS, Lim HW, Wu J, Schnolzer M, Verdin E,
Ott M. Three novel acetylation sites in the Foxp3 transcription factor regulate the sup-pressive activity of regulatory T cells. J Immu-nol 2012; 188: 2712-2721.
[20] van Loosdregt J, Vercoulen Y, Guichelaar T, Gent YY, Beekman JM, van Beekum O, Brenk-man AB, Hijnen DJ, Mutis T, Kalkhoven E, Prak-ken BJ, Coffer PJ. Regulation of Treg functional-ity by acetylation-mediated Foxp3 protein stabilization. Blood 2010; 115: 965-974. [21] Lemoine M, Derenzini E, Buglio D, Medeiros LJ,
Davis RE, Zhang J, Ji Y, Younes A. The pan-deacetylase inhibitor panobinostat induces cell death and synergizes with everolimus in Hodgkin lymphoma cell lines. Blood 2012; 119: 4017-4025.
[22] Amengual JE, Clark-Garvey S, Kalac M, Scotto L, Marchi E, Neylon E, Johannet P, Wei Y, Zain J, O’Connor OA. Sirtuin and pan-class I/II deacet-ylase (DAC) inhibition is synergistic in preclini-cal models and clinipreclini-cal studies of lymphoma. Blood 2013; 122: 2104-2113.
[23] Brown RE. Morphoproteomics: exposing pro-tein circuitries in tumors to identify potential therapeutic targets in cancer patients. Expert Rev Proteomics 2005; 2: 337-348.
[24] Brown RE. Morphogenomics and morphopro-teomics: a role for anatomic pathology in per-sonalized medicine. Arch Pathol Lab Med 2009; 133: 568-579.
[25] Frazzi R, Valli R, Tamagnini I, Casali B, Latruffe N, Merli F. Resveratrol-mediated apoptosis of hodgkin lymphoma cells involves SIRT1 inhibi-tion and FOXO3a hyperacetylainhibi-tion. Int J Cancer 2013; 132: 1013-1021.
[26] Quesada AE, Nguyen ND, Rios A, Brown RE.
Morphoproteomics identifies constitutive acti -vation of the mTORC2/Akt and NF-kappaB pathways and expressions of IGF-1R, Sirt1, COX-2, and FASN in peripheral T-cell lympho-mas: pathogenetic implications and therapeu-tic options. Int J Clin Exp Pathol 2014; 7: 8732-8739.
[27] Tanijiri T, Shimizu T, Uehira K, Yokoi T, Amuro H, Sugimoto H, Torii Y, Tajima K, Ito T, Amakawa R, Fukuhara S. Hodgkin’s reed-sternberg cell line (KM-H2) promotes a bidirectional differentia-tion of CD4+CD25+Foxp3+ T cells and CD4+ cytotoxic T lymphocytes from CD4+ naive T cells. J Leukoc Biol 2007; 82: 576-584. [28] Eades G, Yao Y, Yang M, Zhang Y, Chumsri S,
Zhou Q. miR-200a regulates SIRT1 expression and epithelial to mesenchymal transition (EMT)-like transformation in mammary epithe-lial cells. J Biol Chem 2011; 286: 25992-26002.
[29] Zhu Z, Jiang W, McGinley JN, Thompson HJ.
De-fining the role of histone deacetylases in the
inhibition of mammary carcinogenesis by di-etary energy restriction (DER): effects of sube-roylanilide hydroxamic acid (SAHA) and DER in a rat model. Cancer Prev Res (Phila) 2013; 6: 290-298.
[30] Kyrylenko S, Kyrylenko O, Suuronen T, Salmin-en A. DifferSalmin-ential regulation of the Sir2 histone deacetylase gene family by inhibitors of class I and II histone deacetylases. Cell Mol Life Sci 2003; 60: 1990-1997.
[31] Subbiah V, Brown RE, McGuire MF, Buryanek J, Janku F, Younes A, Hong D. A novel immuno-modulatory molecularly targeted strategy for refractory Hodgkin’s lymphoma. Oncotarget 2014; 5: 95-102.