Does Exposure to Nitrate in Drinking Water Contribute
Anything the Effect of Water Chlorination on Children
Methemoglobin Levels?
*
Mina Sadeq1, Redouane Abouqal2, Benaissa Attarassi3, Mohammed Lakranbi4, Rajae El Aouad1, Larbi Idrissi1
1Department of Toxicology, Industrial Hygiene and Environmental Health, National Institute of Hygiene, Rabat, Morocco; 2Laboratory of Biostatistics, Clinical Research and Epidemiology, Faculty of Medicine and Pharmacy, Rabat, Morocco; 3Department of Biology, Faculty of Science, Ibn Tofail University, Kenitra, Morocco; 4Sala El Jadida Health Center, Ministry of Health, Salé, Morocco.
Email: [email protected]
Received November 14th, 2011; revised December 16th, 2011; accepted January 6th, 2012
ABSTRACT
Previous studies showed contradictory findings regarding the relationship between nitrate in drinking well-water and abnormal methemoglobin (MetHb) level (>2%) among children. We studied the effect of water chlorination in this rela-tionship in children aged up to 7. 240 subclinical children participated in this cross-sectional study. Water nitrate was analyzed for each participant, and so was blood MetHb. Analysis of two water nitrate exposure levels (<50 and >50 mg/L as 3)-other extraneous factors (Breslow-Day-Test for interaction), bivariate and multivariate analyses were
performed. Abnormal MetHb levels (up to 7.9%) were associated (p-value = 0.020) with exposure to drinking water nitrate. Only water chlorination was an effect modifier. Among those who do not disinfect water, the prevalence of ab- normal MetHb for those with nitrate level >50 mg/L was 4.95 (p-value = 0.001, 95% CI = [1.92 - 12.79]) times the prevalence for those with nitrate level <50 mg/L. Whereas, among those who do disinfect water, the prevalence for those with high nitrate levels was only 1.38 (p-value = 0.435, 95% CI = [0.62 - 3.07]) times the prevalence of those with low nitrate levels. The biological plausibility of a relationship between waterborne microorganisms, drinking water nitrate, drinking water chlorination, and development of an abnormal MetHb level needs to be further explored.
NO
Keywords: Methemoglobin; Drinking Water; Nitrate; Chlorine; Children
1. Introduction
“The ferrous iron of hemoglobin (Hb) is continuously exposed to high concentrations of oxygen and, thereby, is oxidized slowly to methemoglobin (MetHb), a protein unable to carry oxygen. To restore Hb function, MetHb (ferrihemoglobin) must be reduced to Hb (ferrohemoglo- bin). Under physiological conditions, MetHb reduction is accomplished mainly by red cell NADH-cytochrome b5 reductase so efficiently that there are insignificant amounts of MetHb in the blood circulation” [1]. The normal Met- Hb level was set as 2% of total Hemoglobin (Hb) [2]. However, MetHb formation can be increased due to oxi- dant agents [1]such as drinking water nitrate [3], nitrate in some vegetables [1,4-6], nitrite used as food preserva- tive [4,7], some medications [5,8,9], or to some house- hold chemicals [1,5,6].
The health-based guideline value for nitrate in drink-
ing water of 50 mg/L as 3 is based on epidemiologi- cal evidence for methemoglobinemia in infants, which results from short-term exposure and is protective for bottled-fed infants and, consecutively, other part of the population [3]. However, private water systems in Mo- rocco and elsewhere are not required to meet this stan- dard. Furthermore, the effect of nitrate in infants is well known [3] but less is known about the effect of nitrate in drinking water on the development of abnormal MetHb levels in children particularly with chronic exposure and when no methemolobinemia-related clinical symptom has been detected.
NO
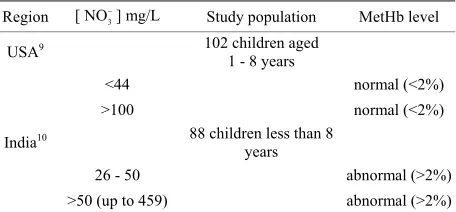
Previous available studies [10,11] related to MetHb levels in children showed contradictory findings (Table 1), suggesting the involvement of potential extraneous factors on the relationship between nitrate in drinking water and MetHb level. As well-waters in rural areas may be contaminated with both nitrate as a consequence of agricultural activities, and microorganisms particularly
Table 1. Contradictory findings related to drinking water nitrate—MetHb level relationship among children.
Region [NO3] mg/L
Study population MetHb level
USA9 102 children aged
1 - 8 years
<44 normal (<2%)
>100 normal (<2%)
India10 88 children less than 8
years
26 - 50 abnormal (>2%)
>50 (up to 459) abnormal (>2%)
from septic tanks, we wondered whether water disinfec- tion with chlorine contributes anything the effect of ex- posure to nitrate in drinking water on children MetHb levels. To our knowledge, this extraneous factor has not previously been investigated. This study aimed at inves- tigating into this, taking into consideration other extra- neous factors of methemoglobinemia.
2. Methods
2.1. Study Design and Population
A cross-sectional study was carried out in a semi-rural region that consists of four areas, and whose population (Total population = 8670 people) [12] uses well water for their daily needs. Housing and living conditions are si- milar. Some households have their own wells while others use communal wells that are actually private wells whose owners share with their close neighbors. Potential sour- ces of nitrate in water are chemical fertilizers (different types of urea and ammonium nitrate) that are widely used and septic tanks that are common in the area. Vegetables are provided from a local market. Some are grown lo- cally and sold at the same market. Two health centers provide medications, health care, and vaccination with- out charge to the source population.
The target population was infants and young children aged 1 - 7 years whose approximate total number was 1894 [12]. The calculated sample size [13] to detect 50% (the hypothesized frequency) of methemoglobinemia with 95% confidence was 320.
2.2. Approvals
This study was conducted with approvals of the Ministry of Health and the Home Office for ethic issues.
2.3. Selection and Recruitment
Three of the four study areas were small. All households, there, having children who were less than 7 years of age, were invited to participate. Selection was performed separately in each of the three study area to insure repre-
sentativeness. As to the forth remaining study area and due to the geographic spread, 37 wells were chosen at random and all households having children that used those wells for drinking water were invited to participate in the study. Parents who agreed to participate provided written informed consent.
2.4. Physical Examination
A study physician conducted physical examinations to screen for taken medications, use of herbs, and house- hold chemicals, that could affect MetHb level, acute di- arrhea (current and antecedent one) as infection that is thought to cause methemoglobinemia [14,15], hyperten- sion, heart disease, regular vitamin C intake which has a protective effect [16,17], weight, height, and signs (noise and tips of ears, around the month and eyes, and fingers can appear blue from lack of oxygen) and symptoms in-cluding cyanosis, headaches, fatigue and dizziness, that depend on MetHb level.
2.5. Interviews
At enrollment, we asked the parents (a preliminary inter- view) if their child was born and grew up in the study area or has lived outside the study area. Since we were interested in chronic exposure, children who were not born and/or did not grow up in the study areas were ex- cluded. The study participant’ age was then considered as a surrogate measure for the actual exposure to nitrate.
A detailed second questionnaire was administered to the study participants’ parents to collect information about water treatment with chlorine, boiling water, and storing it in containers—as indicators of microbial water qual- ity—and breast-feeding. Information about available foods consumed by the study population—mothers/fathers of the study children were shown a selected list of foods with potentially high nitrate levels, and were asked if their child consumed each item once or more per week— were also collected. The list consisted of vegetables that may contain nitrate (lettuce, cauliflowers, radish, celery, parsley, coriander) since they were irrigated with well- water, foods that may contain nitrite (cured meat), and foods that was frequently consumed in the study region (carrots, orange, fruits, fish, and cheese). Potential miss- ing information was completed when the study team vis- ited each participant’s house to collect well-water sam-ples.
2.6. Exposure Assessment
Water samples were collected directly from wells. Pumps were flushed for at least 15 minutes until pH and tem- perature were stabilized. Ph and temperature were mea- sured with portable meters (Orion model 230A. NY.US). After collection, well-waters sample polyethylene bottles were stored at 4˚C, and sent the same day to the labora- tory for analysis (Department of Toxicology, National Institute of Health. Rabat. Morocco). Beside nitrate, we were interested in other chemical water contamination indicators that may contribute to high nitrate levels in drinking water due to potential bacterial water contami- nation—typically, organic matters are first decomposed to give ammonia, which is then oxidized to nitrite and nitrate. Water was then tested for nitrate and nitrite using spectrophotometry methods (UV-Visible A160 Shimatzu spectrophotometer—Kyoto. Japan) [18,19]. Ammonium [20] and organic matters [18,21] were also measured. The limits of detection were 0.1 mg/L for nitrate and 0.005 mg/L as 2 for nitrite. The variation coeffi- cients were 6.68% for nitrate (inter-days), 2% for nitrite (same day), 0.4% for organic matters (inter-days and same day). Nitrate and nitrite levels in water samples were estimated against standard curves (correlation coef- ficients R2 were 0.9989 for nitrate and 0.9932 for nitrite). The precisions (% of error) were 0.8% for nitrate, 4.2% for nitrite, and less than 1% for organic matters.
NO
2.7. Outcome Assessment
The samples of total blood were collected by a single nurse, using vacutainers. Hemolyis was seen only in two blood samples that were excluded from further analysis. Blood sampling and analysis were completed within less than 1 hr since MetHb is not stable. After collection, the daily 20-heparinized blood samples were stored at 4˚C and sent immediately to the laboratory for immediate analysis (Department of Toxicology. National Institute of Hygiene. Rabat. Morocco). The blood analysis for Met- Hb was performed using the Evelyn and Malloy [22] mo- dified method and a UV-A160 Shimatzu spectropho- tometer. The limit of detection was 0.7%.
2.8. Statistical Analysis
Statistical analyses were carried out using the statistical software SPSS 13 for Windows (SPSS Inc., Chicago, IL, USA). Frequency of categorical variables was deter-mined for study population’s characteristics and practices. Age was grouped into five categories: infants aged less than 6 months, infants aged more than 6 months but less than one year, and the remaining categories were all with approximately equal age interval. The chi-square test or
the Fisher exact test (bivariate analysis) was first per-formed. Apart from age, all the variables were divided into two categories. All variables with a bivariate p-value < 0.25 were subject to a Breslow-Day test for interaction. Finally, logistic regression (multivariate analysis) was carried out.
3. Results
3.1. Descriptive Statistics
Respect for inclusion criteria and for ethical clause - some mothers were reluctant to have their infants parti- cipate in the study—downsized the sample size. Fur- thermore some families who use collective wells did not know whether or not the well-water is regularly disin- fected with chlorine. Data related to children from these families was not considered. A total of 240 participants had complete data and covariate information. We calcu- lated [13] the estimated power of this cross-sectional study, for the 240 participants, based on Normal appro- ximation with continuity correction. It was equal to 84.94%.
Of the 240 participants, 105 (43.8%) were females, 13 (5.4%) were 0 - 6 months old, 21 (8.8%) were 7 - 11 months old, 69 (28.8%) were 12 - 35 months old, and 64 (26.7%) were 60 months old or more (≥60 months). Overall, most children 211 (87.9%) experienced antece-dent acute diarrheas. 202 (84.2%) had received medica-tions to treat diarrhea or respiratory symptoms (cough or flu). Of these, 193 (95.5%) used antiseptics; no taken medications were known to affect MetHb level. Regular vitamin C intake was not frequent. The physical exami-nation did not indicate any sign/symptom related to me- themoglobinemia, or problems with hypertension or heart disease.
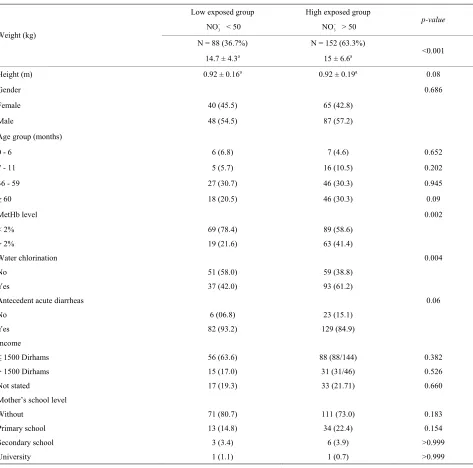
Comparing users of well-waters whose nitrate levels were higher than 50 mg/L with those of well-waters whose nitrate levels were lower than 50 mg/L (Table 2), similarity was seen in gender, height, antecedent acute diarrheas, family’s income, and mother’s school level whereas differences were seen in weight, abnormal Met- Hb levels, and water chlorination.
3.2. Water Contaminants
Bottled water use was not common among participants. Of the 240 participants, 152 (63.3%) were exposed to nitrate level above 50 mg/L as 3. Water contami- nants concentrations were measured in 65 wells. Their distribution is shown in Table 3. The well-waters tested had organic matter levels below the maximum acceptable value which is 5 mg O2/L [23], and nitrite levels below the guideline value set at 3 mg/L as for short term
NO
Table 2. Characteristics of the study population.
Low exposed group High exposed group
3
NO < 50
3
NO > 50 p-value
N = 88 (36.7%) N = 152 (63.3%)
Weight (kg)
14.7 ± 4.3a 15 ± 6.6a <0.001
Height (m) 0.92 ± 0.16a 0.92 ± 0.19a 0.08
Gender 0.686
Female 40 (45.5) 65 (42.8)
Male 48 (54.5) 87 (57.2)
Age group (months)
0 - 6 6 (6.8) 7 (4.6) 0.652
7 - 11 5 (5.7) 16 (10.5) 0.202
36 - 59 27 (30.7) 46 (30.3) 0.945
≥ 60 18 (20.5) 46 (30.3) 0.09
MetHb level 0.002
< 2% 69 (78.4) 89 (58.6)
> 2% 19 (21.6) 63 (41.4)
Water chlorination 0.004
No 51 (58.0) 59 (38.8)
Yes 37 (42.0) 93 (61.2)
Antecedent acute diarrheas 0.06
No 6 (06.8) 23 (15.1)
Yes 82 (93.2) 129 (84.9)
Income
≤ 1500 Dirhams 56 (63.6) 88 (88/144) 0.382
> 1500 Dirhams 15 (17.0) 31 (31/46) 0.526
Not stated 17 (19.3) 33 (21.71) 0.660
Mother’s school level
Without 71 (80.7) 111 (73.0) 0.183
Primary school 13 (14.8) 34 (22.4) 0.154
Secondary school 3 (3.4) 6 (3.9) >0.999
University 1 (1.1) 1 (0.7) >0.999
amean ± Standard deviation.
Table 3. Distribution of drinking water contaminants by exposure.
Low exposed group High exposed group
3
NO < 50
3
NO > 50
n = 21 n = 44
m ± SD Median Range m ± SD Median Range p-value
Nitrate 29.74 ± 11.03 28.04 15.39 - 49.52 111.60 ± 52.43 100.58 50.74 - 246.90 <10 - 7
Nitrite* 0.012 ± 0.008a 0.010a 0.006 - 0.029a 0.013 ± 0.008b 0.012b 0.006 - 0.029b 0.925
OM 0.49 ± 0.25 0.40 0.24 - 1.20 0.47 ± 0.25 0.40 0.24 - 1.20 0.963
[image:4.595.58.540.613.713.2]exposureor 0.2 mg/L as NO2
for chronic exposure [3].
Ammonium ion was not detected.
3.3. MetHb Levels
The mean MetHb level was 1.3% ± 0.9% (range 0.7% - 5.0%, median = 0.7%) for participants exposed to nitrate level below 50 mg/L as NO3, and 2% ± 1.5% (range
0.7% - 7.9%, median = 1.4%) for those exposed to ni-trate level above 50 mg/L as 3. The difference in means was statistically significant (p < 10–3).
NO
3.4. MetHb Level in Relationship with Covariates
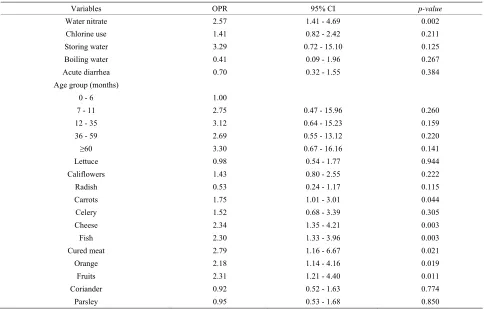
Abnormal MetHb level was significantly associated with higher nitrate level in both unadjusted and adjusted ana- lysis (Tables 4 and 6). When chlorine use was examined as a protective factor of abnormal MetHb in unadjusted analysis, it was not significantly associated with higher MetHb levels. We conducted covariates-stratified analy- ses on nitrate in drinking water and abnormal MetHb level. We did not retain neither covariates such as boiling drinking water, antecedent acute diarrheas, lettuce, celery, coriander, and parsley since they were not significantly associated with abnormal MetHb level (p-value > 0.25) nor age (a surrogate measure of the period of exposure to drinking water nitrate). Infants (0 - 6 months) were con-sidered as a reference group since breastfeeding protects from methemoglobinemia [17].However, the small num- ber of infants in the current study (13 participants: 9 were only breastfed; 4 were breastfed and also used formula) did not allow us to consider the age as a potential risk factor of abnormal MetHb level. Covariates-stratified ana- lyses revealed (results not shown except for chlorine use) that only water disinfection with chlorine (Table 5) was an effect modifier (p-value of BDT for interaction was 0.044). In those who do not disinfect water with chlorine, the prevalence of abnormal MetHb for those exposed to high nitrate levels (>50 mg/L as 3) was 4.95 (95% CI = 1.92 to 12.79) times the prevalence for those ex-posed to low nitrate level (≤50 mg/L as 3). However,
in those who use chlorine as disinfectant, the prevalence for those with high nitrate level was only 1.38 (95% CI = 0.62 to 3.07) times the prevalence of those with low ni-trate level. If chlorine use-stratified analysis was not conducted, chlorine use would misleadingly be referred to as “a risk factor” (Table 6).
NO
NO
In unadjusted analysis (Table 4), consumption of car-rots, cheese, fish, cured meat, orange, or fruits was pre- dictive of abnormal MetHb levels. This was no longer true under conditions of multivariate analysis that indi- cated a protective effect of consumption of radish (Table 6).
4. Discussion
The users of high nitrate levels in drinking water were more likely to disinfect water with chlorine (Table 2). The effects of both low and high nitrate levels were si- milar when chlorine was used. In its absence, the preva- lence of abnormal MetHb among the exposed to high nitrate levels in drinking water was about 5 times that among the exposed to low nitrate levels (Table 4). As wells in agricultural rural areas are often dug privately and may be too close to disposal points for human and animal excreta, the risk of pollution increases not only by nitrate but also by E. coli and other microorganisms; since chlorine is efficient in killing many microorgan- isms, we deduced that, while assessing children abnor- mal MetHb levels, the effect of nitrate is only realized when waterborne microorganisms are also present. In- deed, it is well known that although chemically unreac- tive, the nitrate ion (NO3) can be reduced by microbial action to nitrite ion (NO2) that oxidizes Fe2+ of Hb to
Fe3+. Furthermore, it has been found that some bacteria (E. coli, Salmonella typhimurium, and Klebsiella pneu- moniae) produce an iron chelator [24-28]. This com- pound, synthesized only under conditions of iron restric- tion, efficiently removes iron from the iron-binding pro- teins and delivers it into the bacterial cell [26,27,29], which stimulates bacteria proliferation. Storing water (up to 2 days in clean vessels) did not contribute anything the effects of drinking water nitrate to the development of abnormal MetHb levels, which may support the above deduction. Further epidemiologic and toxicological stud- ies are needed to better understand the relationship be- tween nitrates in drinking water, water chlorination, wa- terborne microorganisms, and abnormal MetHb levels. It might be more efficient and less expensive to disinfect water with chlorine than to remove nitrate from water to prevent abnormal MetHb level.
Although nitrate concentrations exceeding 50 mg/L are not unusual in many developing and developed coun- tries, few studies investigated into the effect of water chlorination on the relationship between nitrate in drink- ing water and development of abnormal MetHb levels in children. In India, Gupta et al. [11] (Table 1) found both low and high nitrate levels (26, 45, 95, 222, 459 mg/L as
3
Table 4. Bivariate analysis relative to water microbiological quality, age, and food consumption.
Variables OPR 95% CI p-value
Water nitrate 2.57 1.41 - 4.69 0.002
Chlorine use 1.41 0.82 - 2.42 0.211
Storing water 3.29 0.72 - 15.10 0.125
Boiling water 0.41 0.09 - 1.96 0.267
Acute diarrhea 0.70 0.32 - 1.55 0.384
Age group (months)
0 - 6 1.00
7 - 11 2.75 0.47 - 15.96 0.260
12 - 35 3.12 0.64 - 15.23 0.159
36 - 59 2.69 0.55 - 13.12 0.220
≥60 3.30 0.67 - 16.16 0.141
Lettuce 0.98 0.54 - 1.77 0.944
Califlowers 1.43 0.80 - 2.55 0.222
Radish 0.53 0.24 - 1.17 0.115
Carrots 1.75 1.01 - 3.01 0.044
Celery 1.52 0.68 - 3.39 0.305
Cheese 2.34 1.35 - 4.21 0.003
Fish 2.30 1.33 - 3.96 0.003
Cured meat 2.79 1.16 - 6.67 0.021
Orange 2.18 1.14 - 4.16 0.019
Fruits 2.31 1.21 - 4.40 0.011
Coriander 0.92 0.52 - 1.63 0.774
Parsley 0.95 0.53 - 1.68 0.850
[image:6.595.55.541.459.548.2]CI = Confidence Interval; OPR = Odds Prevalence Ratio.
Table 5. Abnormal MetHb and water nitrate exposure, stratified by chlorine use.
Crude (unadjusted) OPR = 2.57 95% CI = [1.41 - 4.69] p-value = 0.002
Covariate Water nitrate Stratum specific Chi-square for interaction
Exposed Not exposed OPR [95%CI] p-value
MetHb > 2% MetHb < 2%
Water chlorination (%) (%)
Yes 75.5 69.1 1.38 [0.62 - 3.07] 0.044
No 78.8 42.9 4.95 [1.92 - 11.79]
CI = Confidence Interval; OPR = Odds Prevalence Ratio.
Table 6. Multivariate analysis.
Variables OPR 95% CI p-value
Water nitrate 3.41 1.21 - 9.58 0.020
Chlorine use 3.31 1.07 - 10.24 0.037
Storing water 2.30 0.44 - 12.02 0.323
Califlowers 1.34 0.55 - 3.31 0.520
Radish 0.30 0.10 - 0.84 0.023
Carrots 1.24 0.52 - 2.97 0.621
Fish 1.40 0.55 - 3.52 0.480
Cheese 2.01 0.87 - 4.63 0.101
Cured meat 1.46 0.53 - 4.02 0.462
Orange 0.83 0.32 - 2.10 0.689
Fruits 1.61 0.60 - 4.32 0.342
[image:6.595.58.536.586.725.2]acceptable bacteriological quality according to WHO standards. In spite of this, MetHb levels were below the normal physiologic level of 2% (Table 1) in both low ni-trate exposed (mean MetHb level = 0.98% ± 0.18%) and high nitrate exposed (mean MetHb level = 1.13% ± 0.1%) (Table 1). There was no trend towards higher levels of MetHb level in young children using wells with greater bacterial contamination. No information was provided re- garding water treatment devices use (nitrate removal and others) which is a common occurrence in the USA.
The strengths of the current study include a larger sample size than in previous studies [10,11] and com- plete data and covariate information. The study power was sufficient (>20%) to determine a relationship be- tween exposure to nitrate and abnormal MetHb if it exists. Selection bias can be ruled out since no information on nitrate levels or MetHb levels was available to either the participants’ families or investigators prior to the study.
The present study shows that children exposed to high nitrate levels (>50 mg/L as 3) in drinking water had
higher MetHb levels (>2% of the total Hb) and vice versa. This finding was robust to adjustment for many extrane- ous factors (environmental, behavioral, and clinical fac- tors). Potential causes of methemoglobinemia other than drinking water nitrate were not identified. The air quality, the socio-economic status indicators (housing and living conditions, and family income), the frequented food-mar- kets, and the quality of health care provided by the two available health centers all were similar for both high and low exposed participants. Prescreening established that no participant in this study had been exposed to drugs (medicines or herbs) or household chemicals that may contain nitrate. Participants’ families’ practices such as boiling or storing water were also similar. Diarrhea is a common symptom associated with microorganisms and other factors. In the current study, the likely antecedent occurrences of acute diarrhoeas in the participants may be related to bacterial infection since only antiseptics were prescribed as efficient treatment and to sources other than drinking water since water chlorination was not statistically associated with antecedent acute diar-rheas.
NO
Our study has limitations. Chorine (Sodium Hypoch- lorite) is used in the well itself by hygiene service offi- cials; otherwise, it is used in the stored well water by the population. The chlorine bottle is available in the market; the Moroccan population is taught how to disinfect stored water: a tea glass or the bottle’s cup is used to measure the correct amount of disinfectant to add to the quantity of water in the water vessel. Residual chlorine levels were not tested in the current study. However, we asked for frequent continuous water chlorination use in many different ways at different occasions (during the
admin-istered questionnaire, during the interviews with local public health officials, and the households’ visits) to as-certain whether chlorine is or is not used.
5. Conclusion
Water chlorination is an effect modifier in the association: drinking well water nitrate-children methemoglobin lev- els. The biological plausibility of a relationship between waterborne microorganisms, nitrate exposure via drink- ing water, drinking water chlorination, and development of an abnormal MetHb level in childhood needs to be further explored.
6. Acknowledgements
The authors gratefully acknowledge C.L. Moe for com- ments, E. Ben Abbou for contributing to blood analyses, F. Benammi, and N. Nouari for assisting with laboratory water analyses.
REFERENCES
[1] A. Mansouri and A. A. Lurie, “Concise Review: Methe- moglobinemia,” American Journal of Hematology, Vol.
42, No. 1, 1993, pp. 7-12. doi:10.1002/ajh.2830420104 [2] J. P. Fréjaville, B. Christoforov, C. Bismuth, et al., “To-
xicologie Clinique et Analytique,” in French, 2nd Edition, Flammarion Médecine Sciences, Paris, 1971, pp. 63-64. [3] WHO, “Nitrate and Nitrite in Drinking Water,” Back-
ground Documents for Development of WHO Guidelines for Drinking-Water Quality, WHO/SDE/WSH/07.01/16, Geneva, 2007.
[4] G. L. Askew, L. Finelli, C. A. Genese, F. E. Sorhage, D. M. Sosin and K. C. Spitalny, “Boilerbaisse: An Outbreak of Methemoglobinemia in New Jersey in 1992,” Pediat- rics, Vol. 94, No. 3, 1994, pp. 381-384.
[5] L. M. Haddad and J. F. Winchester, “Clinical Manage- ment of Poisoning and Drug Overdose,” 2nd Edition, WB Sunders, Philadelphia, 1990, pp. 1419-1431.
[6] R. O. Wright, W. J. Lewander and A. D. Woolf, “Methe- moglobinemia: Ethiology, Pharmacology, and Clinical Management,” Annals of Emergency Medicine, Vol. 34, No. 3, 1999, pp. 646-656.
doi:10.1016/S0196-0644(99)70167-8
[7] A. Finan, P. Keenan, F. O’Donovan, P. Mayne and J. Murphy, “Methemoglobinemia Associated with Sodium Nitrite in Three Siblings,” BMJ, Vol. 317, 1998, pp. 1138- 1139. doi:10.1136/bmj.317.7166.1138
[8] R. Ash-Bernal, R. Wise and S. M. Wright, “Acquired Me- themoglobinemia: A Retrospective Series of 138 Cases at Two Teaching Hospitals,” Medicine (Baltimore), Vol. 83, No. 5, 2004, pp. 265-273.
doi:10.1097/01.md.0000141096.00377.3f
[10] G. F. Craun, D. G. Greathouse and D. H. Gunderson, “Methaemoglobin Levels in Young Children Consuming High Nitrate Well Water in the United States,” Interna- tional Journal of Epidemiology, Vol. 10, No. 4, 1981, pp.
309-317. doi:10.1093/ije/10.4.309
[11] S. K. Gupta, R. C. Gupta, A. K. Seth, A. B. Gupta, J. K. Bassin and A. Gupta, “Adaptation of Cytochrome-b5 Re- ductase Activity and Methaemoglobinaemia in Areas with a High Nitrate Concentration in Drinking Water,” Bulletin of the World Health Organization, Vol. 77, No. 9, 1999,
pp. 749-753.
[12] Maroc. HCP. CLAD. Haut Commissariat du Plan, Centre de la Lecture Automatique des Documents, “RGPH2004 en ligne,” in French, 2006. http://clad.hcp.ma
[13] A. Dean, K. Sullivan and M. M. Soe, “OpenEpi. Open Source Epidemiologic Statistics for Public Health,” 2004. http://openepi.com
[14] A. A. Avery, “Infantile Methemoglobinemia: Reexamin-ing the Role of DrinkReexamin-ing Water Nitrates,” Environmental Health Perspectives, Vol. 107, 1999, pp. 583-586.
doi:10.1289/ehp.99107583
[15] A. A. Avery, “Cause of Methemoglobinemia: Illness ver- sus Nitrate Exposure,” Environmental Health Perspec- tives, Vol. 109, 2001, pp. 12-14. doi:10.1289/ehp.109-a12
[16] M. H. Ward, T. M. deKok, P. Levallois, J. Brender, G. Gulis, B. T. Nolan and J. van Derslice “Workgroup Re- port: Drinking-Water Nitrate and Health—Recent Find- ings and Research Needs,” Environmental Health Pers- pectives, Vol. 113, 2005, pp.1607-1614.
doi:10.1289/ehp.8043
[17] C. L. Zeman, B. Kross and M. Vlad, “A Nested Case- Control Study of Methemoglobinemia. Risk Factors in Children of Transylvania, Romania,” Environmental Health Perspectives, Vol. 110, 2002, pp. 817-822.
doi:10.1289/ehp.02110817
[18] J. Rodier, “L’analyse de l’eau, Eaux Naturelles, Eaux Ré- siduelles, eau de mer: Chimie, Physico-Chimie, bacté Rio- logie, Biologie,” in French, Vol. 1, 5th Edition, Dunod, Paris, 1975, pp. 166-167,170-172,566-567.
[19] A. Aminot and M. Chaussepied, “Manuel des Analyses
Chimiques en Milieu Marin,” in French, CNEXO, Brest, 1983, pp. 119-124.
[20] J. Rodier, “L’Analyse Chimique et Physico-Chimique de l’eau. Eaux naturelles-Eaux Usées,” in French, 2nd Edi- tion, Dunod, Paris, 1960, pp. 78-79.
[21] D. Pradeau, “Analyse Pratique du méDicament,” in French, Lavoisier, Editions Médicales Internationales (EMI), Paris, 1992, pp. 362-364.
[22] I. Sunshine, “Methodology for Analytical Toxicology,” Vol. 1, CRC Press, Cleveland, 1975, pp. 245-246. [23] Maroc. SNIMA, “Norme Marocaine Homologuée: Qua-
lité des Eaux d’Alimentation Humaine, NM 03.7.001,” in French, Service de Normalisation Industrielle Marocaine, Rabat, 2006.
[24] I. G. O’Brien and F. Gibson, “The Structure of Entero- chelin and Related 2,3-Dihydroxy-N-Benzoylserine Con-jugates from Escherichia coli,” Biochimica & Biophysica Acta, Vol. 215, 1970, pp. 393-402.
[25] J. R. Pollack and J. B. Neilands, “Enterobactin, an Iron Transport Compound from Salmonella Typhimurium,”
Biochemical and Biophysical Research Communications,
Vol. 38, No. 6, 1970, pp. 989-992. doi:10.1016/0006-291X(70)90819-3
[26] H. J. Rogers, “Iron-Bonding Catechols and Virulence in
Escherichia coli,” Infection and Immunity, Vol. 7, No. 3,
1973, pp. 445-456.
[27] H. J. Rogers, C. Synge, B. Kimber and P. M. Bayley, “Production of Enterochelin by Escherichia coli O111,” Biochimica et Biophysica Acta, Vol. 497, No. 2, 1977, pp.
548-557.
[28] H. J. Rogers, “Role of Iron Chelators, Antibodies and Iron-Bonding Proteins in Infection,” In: D. Slessinger, Ed.
microbiology, American Society of Microbiology,
Wash-ington DC, 1983, pp. 334-337.
[29] C. J. Carrano and K. N. Raymond, “Ferric Ion Sequester-ing Agents: 2.Kenetics and Mechanisms of Iron Removal from Transferring by Enterochelin and Synthetic Tricate-chols,” Journal of the American Chemical Society, Vol.