Do Purpose-Designed Auditory Tasks Measure
General Speediness?
Ian T. Zajac1,2, Nicholas R. Burns1, Ted Nettelbeck1
1
School of Psychology, University of Adelaide, Adelaide, Australia
2
CSIRO Preventative Health Flagship, Adelaide, Australia. Email: [email protected]
Received January 4,2012; revised February 23, 2012; accepted March 1, 2012
ABSTRACT
This study was concerned with the measurement of General Speediness (Gs) using the auditory modality. Existing as well as purpose-developed auditory tasks that maintained the cognitive requirements of established visually presented Gs marker tests were completed by N = 80 university undergraduates. Analyses supported the results of our previous work [1] and auditory and visual tasks combined to define latent RT and Gs factors. Moreover, the analysis did not support the presence of modality-specific speed factors. Overall, this study provides further evidence suggesting that auditory tasks might successfully measure existing broad abilities defined in intelligence theories (i.e., Gf, Gc, etc.) pro- vided they maintain the same cognitive requirements as existing visual measures of such constructs.
Keywords: Auditory Intelligence; Auditory Abilities; Intelligence; Cognition; Speed of Processing
1. Introduction
The auditory perceptual domain is the second-most re- searched modality in the study of human intelligence [2]. Research has shown that auditory tasks combine to de- fine a broad auditory perceptual factor (Ga) thought to exist at the second stratum of intelligence hierarchies—
i.e., Gf Gc theory [3]—alongside other broad constructs including fluid reasoning (Gf) and crystallized ability (Gc). Although the existence of this broad perceptual factor is relatively well replicated, our understanding of auditory abilities and how they relate to other broad cog- nitive constructs remains poor. According to Roberts, Pallier and Goff [4], conclusions regarding the auditory modality have been drawn on the basis of only a handful of data sets, none of which offers a satisfactory account of this modality.
Stankov [5] was the first to test the hypothesis that audi- tory tasks would define a broad Ga factor and empirically validated its presence and importance in intelligence theo- ries. Carroll [6] noted however, that although the exis- tence of Ga was indubitable, defining the domain of audi- tory abilities was difficult because there had been “no trustworthy or extensive factor-analytic studies of musi- cal talent” (p. 364) and the majority of factor analytic studies of intelligence had “totally neglected the domain of auditory abilities” (p. 365). The need to distinguish between abilities that are and are not strictly auditory abilities was also stressed. In order to be considered an
auditory ability, Carroll (1993) requires there to be a re- liance on the characteristics of the auditory stimulus and the ability to recognize and discriminate those character- ristics. On the other hand, abilities such as speech com- prehension rely on the knowledge of language structure and reliance on audition specifically is incidental. Speech comprehension might only be considered an auditory ability when the speech is distorted or manipulated, and in which case increased attention is devoted to the proc- essing and discrimination of the incoming auditory sti- muli.
Stankov [7] suggests that mode of stimulus presenta- tion at the highest level of the hierarchy is incidental and has proposed that such thinking abilities should be mea- surable via all modalities. These higher-order abilities are thought to rely on cognitively central yet complex mecha- nisms. Rather unfortunately, as highlighted by Roberts, Stankov, Pallier and Bradley [9], an implicit assumption of many extant theories of intelligence is that no know- ledge of importance can be gained by employing tests of these complex abilities which utilize alternate modalities. Possibly as a result of this mindset, only a handful of studies have explored whether it is, in fact, possible to purposefully measure well established complex cognitive abilities—such as Gf and Gc etc.—via alternate modali-ties including audition, olfaction or tactile-kinesthesia.
One study of olfactory abilities [10] and two of tactile kinesthetic abilities [2,9] appear to have addressed this issue yet have provided somewhat mixed results. More specifically, Danthiir et al. [10] developed a single ol- factory task for each of Gf, Gc, Short-term memory (SAR) and long-term memory (TSR) constructs. For the most part, these broad factors emerged from factor analysis of a test battery inclusive of validated visual marker tests but not all of the olfactory measures loaded as predicted. Only Olfactory Swaps and Multiple Choice Smell Identification loaded as hypothesised on Gf and Gc, respectively. Open Ended Smell Identification and Odor Memory did not load on Tertiary Storage and Re- trieval (TSR) and Short Term Memory as expected (TSR did not emerge during factor analysis at all). On the other hand, Roberts et al.’s [9] and Stankov et al.’s [2] studies of tactile-kinesthetic abilities do suggest that tasks pre- sented in these modalities can index constructs including Gf and broad visualization (Gv). Roberts et al. [9] pro- posed that the tactile-kinesthetic tasks in their study were cognitively complex and therefore they would relate to Gf and Gv more so than to Gc. Factor analysis of their data confirmed this: tactile-kinesthetic measures loaded on Gv rather than a modality specific factor. Stankov et
al. [2] replicated this finding and reported that complex tactile-kinesthetic tasks were again difficult to differenti- ate from Gv. Interestingly, Stankov et al.’s study also included “cognitively simpler” (p. 25) tactile-kinesthetic tasks and these were found to define modality specific factors analogous to broad Ga.
When considering the auditory modality, there does not appear to have been any studies specifically con- cerned with the extent to which auditory tasks might in- dex established constructs like Gf and Gc. Some of Stankov and Horn’s studies [11-13] have found relation- ships between particular auditory tasks and broad second stratum constructs. For instance, listening verbal com- prehension does appear to correlate moderately with Gc [12] and tonal series and chord series have been found to
relate to Gf [14]. In the case of tonal series and chord series, however, these tasks usually share more variance with broad Ga than Gf when sufficient auditory measures are present for Ga to be defined. This is not surprising given these latter tasks depend primarily on the ability to make tonal comparisons whilst listening comprehension relies on prior knowledge of language. Findings such as these appear to support Carroll’s (1993) classification of auditory abilities noted above.
Recently, Zajac and colleagues [1] considered the idea that broad cognitive abilities could be measured via dif- ferent modalities by examining whether it was possible to purpose-develop auditory tasks to measure the specific, established broad cognitive ability, General Speediness (Gs). To achieve this, they compiled a battery of auditory tasks, some of which were developed so as to be analo- gous to existing visual Gs marker tests including Digit Symbol [22], Number Comparisons [23] and Findings As [24]. During task development the important characteris- tics of speed tasks were recognised and maintained. For example, it is particularly important that items be rela- tively easy to complete and that item difficulty be main- tained within each task to ensure that performance re- flects only the speed with which participants complete the items [see 6].
Zajac et al. [1] reported that the auditory and visual tasks in their test battery combined to define moderately related factors termed Reaction Time (RT) and Gs. RT was loaded on by the visual and auditory RT tasks whilst Gs subsumed the new auditory speed tasks. Zajac et al. [1] suggested that the latent factors might not reflect modality specific functions because both visual and auditory speed tasks loaded comparably and moderately on these factors. This would not be expected if modality specific processes underpinned these latent constructs.
Despite Zajac et al.’s [1] study providing some in- teresting preliminary data a number of limitations render them tentative only. In particular, although the auditory and visual tasks combined to define two related speed factors only three visual tasks had been measured as part of the test battery. Therefore, the visual modality was under-represented and this may have precluded the ex- traction of modality specific speed factors. The purpose of the present study then was to address this limitation. To achieve this aim, the study sought to assess perfor- mance on an increased number of visual Gs marker tests as well as the auditory tests previously designed [1]. Us-ing factor analytic techniques, we could then examine the extent to which modality specific speed factors may un-derpin performance on the visual and auditory speed tasks in order to assess whether or not Gs is being relia- bly measured by the new auditory tasks.
2. Methods
2.1. ParticipantsParticipants were N = 80 undergraduate psychology stu- dents of the University of Adelaide. There were N = 53 females and N = 27 males with a mean age of 21.0 years (SD = 3.6 years). All participated as part of their first year psychology course requirements.
2.2. Apparatus
The presentation of all tasks and recording of responses
was controlled by one of three identical Pentium 4 class computers. Visual stimuli were presented on 17 inch LCDs. Auditory stimuli were presented via Sony MDR-XD100 stereo headphones. All auditory tones were calibrated prior to the study using a Radio Shack 33-4050 Sound Level Meter.
2.3. Materials
2.3.1. Reaction Time Tasks
Simple Auditory Reaction Time (ART). To begin each trial, the participant pressed the number “5” key in the numeric keypad of the keyboard. After 300 ms a cue- tone (100 ms at 880 Hz) was presented followed, after a silent interval of variable duration (1300 ms, 1700 ms, 2100 ms or 2500 ms), by the target tone; a 500 ms “bell” sound centered on a frequency of 800 Hz. Participants lifted their finger off the number “5” key and pressed the number “8” key as quickly and as accurately as possible. Participants were required to complete 10 correct trials out of 10 before they proceeded to the test. The outcome measure was mean RT-time between on-set of target and pressing of response key—calculated after the removal of outliers (± 3 SD) and errors.
Two-Choice Auditory Reaction Time (ART2). The tar-
get tone in this task was presented to the left or right ear only. Participants responded by pressing the number ‘4’ key if the target tone was played to the left ear, or num- ber “6” if it was played to the right ear. All other aspects of the task were identical to ART.
Three-Choice Auditory Reaction Time (ART3). During
this task the target tone was presented to the left ear only, both ears, or right ear only. Participants responded by pressing the number “4” key in the numeric keypad for the left ear, number “8” if it was played to both ears, or number “6” for the right ear. All other aspects of the task were identical to ART.
Visual Reaction Time (VRT). This task was function- ally equivalent to ART but required participants to re- spond upon the illumination of an empty circle, 4 cm in diameter, presented against the black background of the computer screen. The white outline of the circle was pre- sented at the onset of each trial and acted as a cue, and the circle illuminated red after a variable duration of 1300 ms, 1700 ms, 2100 ms, or 2500 ms.
Two-Choice Visual Reaction Time (VRT2). This task
was the same as VRT but used two circles presented side by side, and with a space of 12 mm between them. Par- ticipants responded by pressing the number “4” key if the left circle illuminated, or the number “6” key if it was the right circle.
Three-Choice Visual Reaction Time (VRT3). This task
red, the number “8” key if the centre circle illuminated, or the number “6” key if it was the right circle.
2.3.2. Speed of Processing Tasks
Symbol Digit (SD). A computerised coding task was em- ployed as a measure of Gs [see 22]. A code table was presented at the top of the computer screen throughout the task. This comprised nine symbols arranged horizon- tally, to which nine digits, presented directly beneath them, were paired. For each item, one symbol was pre- sented in the centre of the computer screen and partici- pants responded by left clicking the mouse on its corre- sponding digit in a 3 × 3 numerical grid positioned at the bottom of the screen. Subsequent items did not com- mence until a correct response was registered. Partici- pants were required to complete two practice trials cor- rectly before they proceeded to the test. The outcome measure was the number of items correctly completed in 2 minutes.
Audio Code (AC). This task was developed to be an auditory analogue of the symbol digit task described above. A code table is displayed at the top of the com- puter screen for the duration of the task, comprising of pictures of eight musical instruments arranged horizon- tally, to which one of the numbers one through eight was paired. The instruments include a snare drum, trumpet, guitar, cymbals, piano, bell, harp and violin. For each item, the sound of one of the instruments was presented via headphones at an intensity of 65 db. Participants re- sponded by left clicking the mouse on its corresponding digit in a 2 x 4 numerical response grid positioned at the bottom of the screen. Subsequent items commenced after a response was registered. Participants completed two familiarization phases: in the first, instrument names were presented and participants clicked on the correspond- ing instrument (2 trials each); in the second, instrument sounds were presented instead of text (2 trials each). Following this, participants were required to complete four test trials for each instrument correctly before they could proceed to the test phase. The outcome measure was the number of items correctly completed in 2 mi- nutes.
Chasing Digits Visual (CDv). This was designed to be
similar to the Digit-Digit task used by McPherson and Burns [22], which was found to share substantial va- riance with Gs marker tests. It incorporated a 3 × 3 nu- merical response grid positioned in the centre of the computer screen against a black background. For each item, one of the digits one through nine illuminated green; trial order was pseudo-randomised with the restriction that no digit could be presented successively. The par- ticipants responded as quickly and accurately as possible by left clicking the mouse on the corresponding number in the response grid. Subsequent items commenced 200
ms following the response. Participants were required to complete ten correct trials out of ten before they pro- ceeded to the test. The outcome measure was the number of items correctly completed in 1 minute.
Chasing Digits Auditory (CDa). This task was
devel-oped to be an auditory analogue of, and was functionally equivalent to, CDv. However, for each item one of the
digits one through nine was presented auditorily to par-ticipants via headphones at an intensity of 65 dB. To re-spond, participants clicked the corresponding number in the response grid.
Number Comparisons (NC). This task was based on the test with the same name, from the ETS Factor Refer-ence Kit [23]. Trials consisted of two digit-strings of equal length (3 to 12 digits long) presented side by side and with a 6 cm space between them. Participants clicked the on-screen response button “Yes”, if they thought the strings were identical, or “No” if they were different. Participants were required to complete five correct trials out of five before they proceeded to the test. The out-come measure was the number of items correctly com-pleted in 90 seconds.
Tone Comparisons (TC). This task was developed to be an auditory analogue of NC and was functionally equivalent to it. Trials consisted of two sequentially pre- sented tones which were identical, or differed by either a semi-tone or tone. Tones were presented at intensity of 65 dB and participants clicked the on-screen response button “Yes”, if they thought the tones were identical, or “No” if they were different.
Finding As (FAs). There exist numerous variations of
this search task [24,25]. In this version, stimuli were two nouns, five to eight letters in length. All words had a con- creteness-of-imagery value of 600 or over, on a scale ranging from 100 to 700: the lowest value indicated maxi- mum abstractness and the highest maximum concreteness. Fifteen of the 60 words contained the letter A. Words were presented pseudorandomly—one at a time—and participants were to press the onscreen button “yes”, if the word contained an “A” and the “no” key if it did not. Participants were required to complete five correct trials out of five before they proceeded to the test, and practice trials used different stimuli to the test phase. The out- come measure was the number of items correctly com- pleted in 90 seconds.
Hearing As (HAs). This task was an auditory version of
in the case of silent “A”. Participants were informed of this restriction.
Visual Inspection Time (VIT). The vertical lines in- spection time task was used to estimate VIT. Stimuli were presented on a video monitor at a viewing distance of approximately 60 cm. Preceding the target figure was a warning cue of approximately 520 ms; the cue was a small white plus (+) sign measuring 6 × 6 mm, presented in the centre of the computer screen. The target figure consisted of two vertical lines; one measured 15 mm and the other 30 mm. These were joined at the top by a hori-zontal line of approximately 18 mm. A “flash mask” [26] of 375 ms immediately replaced the target figure and consisted of two vertical lines 35 mm in length, shaped as lightning bolts. The shorter line appeared on either side of the target figure equiprobably. Participants indi- cated on which side the short line appeared by clicking either the left or right mouse button, respectively.
2.4. Procedure
Upon arriving at the testing session participants were seated in a cubicle in a quiet laboratory and they were guided through the test battery automatically by the computer. Detailed instructions and practice phases were presented prior to the onset of each task, and the first author was present to answer any questions. Participants completed the tasks in the following order: VRT; VRT2;
VRT3; ART; ART2; ART3; CDA; CDV; SD; AC; HAS;
FAS; TC; SC; and VIT. Simple and two-choice RT tasks
consisted of 32 trials whilst the three-choice tasks con- sisted of 36 trials.
For the VIT task, the instructions emphasised accuracy rather than speed of responding. Practice trials required 10 correct trials out of 10 with SOA of approximately 835 ms; 10 correct trials out of 10 with SOA approxi- mately 420 ms; and nine correct trials out of 10 with SOA approximately 250 ms. The estimation process began with SOA approximately 250 ms and followed an adaptive staircase algorithm [27]. The average SOA was calculated over eight reversals of direction on the stair- case, giving an estimate of the SOA with an associated probability of 79% of making a correct response.
2.5. Data Preparation
Outliers (± 3 SD) and errors were removed from indi-vidual RT data files and the average number of trials used to calculate RT scores was: ART (M = 31.2, SD = 1.0); ART2 (M = 31.2, SD = 0.9); ART3 (M = 34.5, SD =
1.3); VRT (M = 31.2, SD = 0.6); VRT2 (M = 31.4, SD =
0.6); and VRT3 (M = 35.0, SD = 0.9). Following this the
data for all tasks were collated and assessed for outliers (i.e., ±3 SD) and missing values. No missing values were present, but 7 outliers were found randomly distributed
across six variables. These values were replaced using the Expectation Maximization (EM) imputation proce-dure in SPSS v.17.
[image:5.595.307.538.439.653.2]3. Results
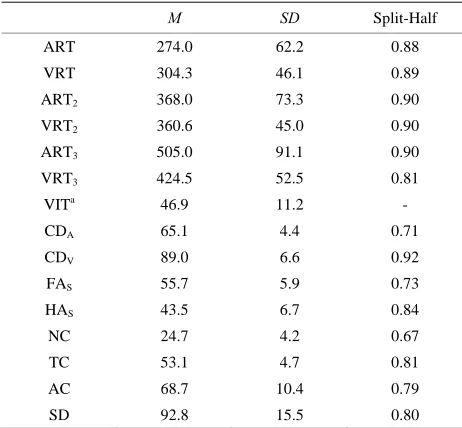
Table 1 presents descriptive statistics for all measures and split half reliability estimates for APM and the speed measures. As can be seen, all reliabilities are acceptable. Regarding means, it is interesting to note that simple ARTs are faster than for VRT [t(79) = 5.99, p < 0.001] yet this pattern alters as the number of alternatives in- creases, with VRT3 performance becoming better than
for ART3 [t(79) = 9.99, p < 0.001]. Furthermore, for the
Gs tasks, the number of completed items is generally higher for the visually presented tasks except for NC, where the average is lower than for TC.
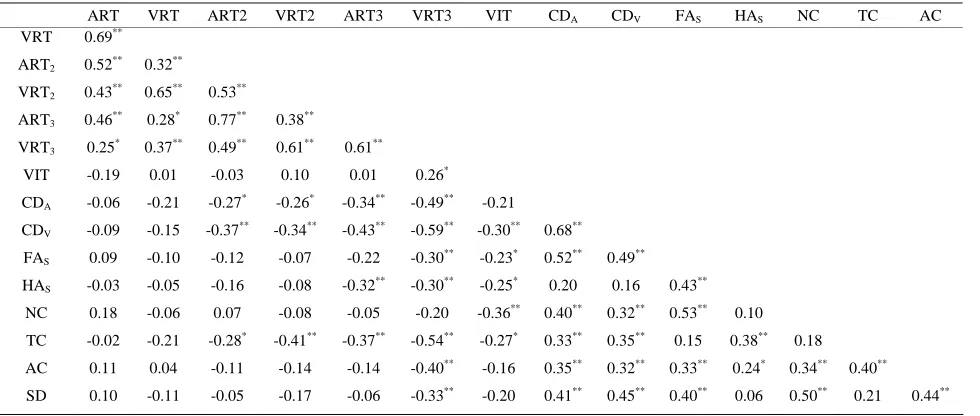
Presented in Table 2 are the correlations between the tasks. As expected, the RT tasks relate moderate to strong with each other, suggesting they all tap a similar con- struct. The Gs measures correlate well with one another also and the auditory measures correlate well with their visual analogues except for NC and TC, which do not correlate significantly. This may partly reflect differences in the complexities of these tasks, which would also ex- plain the marked difference between the average num- bers of items completed in each, as already noted.
Table 1. Descriptive statistics and split-half reliabilities for all cognitive tests.
M SD Split-Half
ART 274.0 62.2 0.88
VRT 304.3 46.1 0.89
ART2 368.0 73.3 0.90
VRT2 360.6 45.0 0.90
ART3 505.0 91.1 0.90
VRT3 424.5 52.5 0.81
VITa 46.9 11.2 -
CDA 65.1 4.4 0.71
CDV 89.0 6.6 0.92
FAS 55.7 5.9 0.73
HAS 43.5 6.7 0.84
NC 24.7 4.2 0.67
TC 53.1 4.7 0.81
AC 68.7 10.4 0.79
SD 92.8 15.5 0.80
Table 2. Correlations between cognitive tests.
ART VRT ART2 VRT2 ART3 VRT3 VIT CDA CDV FAS HAS NC TC AC
VRT 0.69**
ART2 0.52** 0.32**
VRT2 0.43** 0.65** 0.53**
ART3 0.46** 0.28* 0.77** 0.38**
VRT3 0.25* 0.37** 0.49** 0.61** 0.61**
VIT -0.19 0.01 -0.03 0.10 0.01 0.26*
CDA -0.06 -0.21 -0.27* -0.26* -0.34** -0.49** -0.21
CDV -0.09 -0.15 -0.37** -0.34** -0.43** -0.59** -0.30** 0.68**
FAS 0.09 -0.10 -0.12 -0.07 -0.22 -0.30** -0.23* 0.52** 0.49**
HAS -0.03 -0.05 -0.16 -0.08 -0.32** -0.30** -0.25* 0.20 0.16 0.43**
NC 0.18 -0.06 0.07 -0.08 -0.05 -0.20 -0.36** 0.40** 0.32** 0.53** 0.10
TC -0.02 -0.21 -0.28*
-0.41** -0.37** -0.54** -0.27* 0.33** 0.35** 0.15 0.38** 0.18
AC 0.11 0.04 -0.11 -0.14 -0.14 -0.40** -0.16 0.35** 0.32** 0.33** 0.24* 0.34** 0.40**
SD 0.10 -0.11 -0.05 -0.17 -0.06 -0.33** -0.20 0.41** 0.45** 0.40** 0.06 0.50** 0.21 0.44**
**
Correlation is significant at the 0.01 level (2-tailed). *Correlation is significant at the 0.05 level (2-tailed). ART, Simple Auditory Reaction Time; VRT, Visual Reaction Time; ART2, Two-Choice Auditory Reaction Time; VRT2, Two-Choice Visual Reaction Time; ART3, Three-Choice Auditory Reaction Time; VRT3, Three-Choice Visual Reaction Time; VIT, Visual Inspection Time; CDA, Chasing Digits Auditory; CDV, Chasing Digits Visual; FAS, Finding As; HAS, Hearing As; NC, Number Comparisons; TC, Tone Comparisons; AC, Audio Code; SD, Symbol Digit.
In order to explore the latent factors underpinning per- formance across the speed tasks, we generated eigen- values and a scree plot using principle components analy-sis. There were four components with eigenvalues greater than 1, accounting for 33.3%, 18.5%, 8.4% and 7.1% of the variance, respectively. Inspection of the scree plot suggested, however, that there were two dominant factors and possibly a third, with the scree commencing after this. Therefore, we performed exploratory structural equation modeling using maximum likelihood (ML) estimation in MPlus version 5.0 [2]. We modeled three related factors and allowed the tasks to load freely across them. The model terminated but the residual covariance matrix was not positive definite due to VRT having a loading of r = 1.30 on a factor that was otherwise unrelated to the re-maining visual and auditory tasks (average loading of r = 0.07). Therefore, we decided to remove VRT from sub- sequent models as well as ART, given it was its auditory analogue. We also reduced the number of latent factors to two given the third was clearly defined by VRT only.
Following these modifications the model was re-esti- mated and it terminated successfully. The fit of the model was considered quite acceptable given that no paths were constrained [χ2(53) = 115.66, p < 0.001; CFI = 0.84; RMSEA = 0.12; SRMR = 0.06], resulting in a large num- ber of near zero factor loadings. The first factor was iden- tified as an RT factor having strong loadings from both visual and auditory RT tasks, and weak but significant loadings from CDA, CDV and TC. The second factor was
interpreted as a Gs factor, defined by generally moderate loadings from the other tasks, and with a weak loading
from VRT3. The correlation between the latent factors
was weak but significant (r = –0.31, p = 0.01).
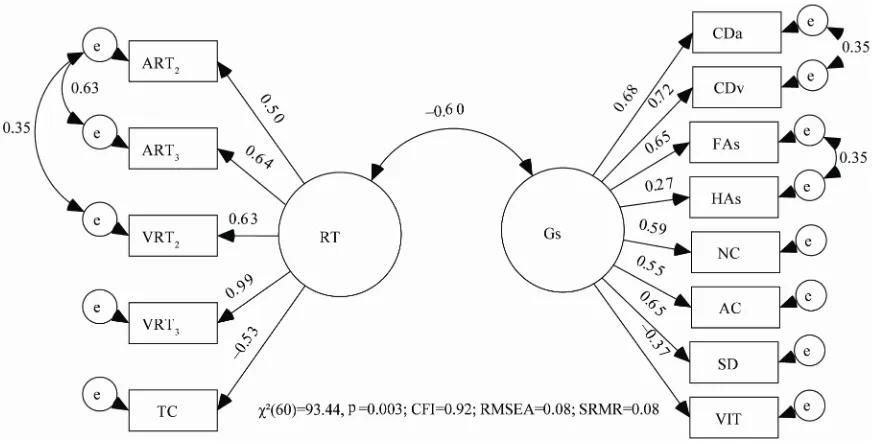
We modified this two factor model by constraining the non-significant paths to zero. Then, based on statistical significance of loadings and modification indices the model went through several permutations to achieve ade- quate fit. The final model is presented as Figure 1 and as can be seen the two factors of RT and Gs remain distinct and the fit of the model is adequate [χ2(60) = 93.44, p = 0.003; CFI = 0.92; RMSEA = 0.08; SRMR = 0.08]. It was possible to achieve better fit through correlating the residuals of RT measures and other auditory/visual pairs (e.g., SD and AC), but in the interest of parsimony we chose this more restrictive model. The one discrepancy noted is that although TC was envisaged as a marker of Gs, it was better placed as an indicator of the RT factor as it shared more variance with this latent construct.
Although the factors resulting from ESEM herein con- form well to those found in our earlier paper [1] we chose to specifically test the possibility of modality specific speed factors using confirmatory modeling. We altered the model shown in Figure 1 to include four latent vari- ables: auditory RT, visual RT, auditory Gs and visual Gs. We also allowed TC to define auditory Gs rather than auditory RT given it was developed to be an auditory ana- logue of NC.
Figure 1. Latent structure of auditory and visual speed tasks.
Gs and auditory Gs (r = 1.09). Therefore, we modified the model to include only modality specific RT factors, and a single latent Gs defined by tasks of both modalities. This subsequent model terminated successfully and all tasks loaded moderately and significantly on their respect- tive factors. Moreover, the relationship between latent factors RTA and RTV was significant and strong (r =
0.74), and the relationship of Gs to each of these factors was moderate and significant also (r = 0.42 and r = 0.67, respectively). The fit of this model, however, was again not adequate [χ2(87) = 242.99, p < 0.001; CFI = 0.69; RMSEA = 0.15; SRMR = 0.11]. Short of correlating the residuals of most indicator variables, we could not get this model to fit adequately. Thus, this analysis generally supports the model shown in Figure 1 because adequate fit is only obtained when latent auditory and visual RT factors are combined.
4. Discussions
The purpose of the present study was to replicate and ex- tend the findings of our earlier research concerning whether broad Gs could be measured auditorily [1]. The same purpose-developed auditory tasks were employed again and in line with our previous findings we expected to find relationships between the visual and auditory Gs tasks. Furthermore, by including more visually presented tasks in this study we sought to establish whether their absence precluded the identification of modality-specific latent speed constructs.
Overall, findings from the present study support those of our earlier investigation. The auditory tasks generally correlated well with their visual analogues except for Tone Comparisons (TC) and Number Comparisons (NC),
which correlated weakly. It is probable that this finding reflects the marked differences in the difficulty of each of these tasks. Whilst TC involves a comparison of two relatively simple successive stimuli (single tones of dif- ferent frequency) the stimuli in NC are complex, involv- ing up to 12 digits in each. Thus, comparing the two digit strings is arguably more complex than comparing two simple tones. It would be interesting to correlate per- formance on TC and NC inclusive only of the simpler three-digit strings. Unfortunately, given the format of our tests our data do not allow this.
The inclusion of more visual marker tests in this study has answered an important question. Specifically, we were concerned that the dominance of auditory tasks in the previous study [1] may have prevented the appea- rance of distinct auditory and visual speed factors. In contrast to our earlier study in which we tested confir-matory structural models based on a-priori hypotheses, we this time undertook exploratory analysis in order to allow the latent factors to be naturally defined. This dis-tinction is important because with CFA several different factorial solutions can achieve acceptable fit yet not adequately represent the latent structure. Despite the dif-ferences in approach between the analyses herein and that used previously [1], the models derived in both studies are generally congruent. Distinct Gs and RT fac-tors emerged again in the present study and they were moderately related, sharing about 36% of their variance.
employed herein. If this were the case, then these moda- lity factors should have emerged naturally in the explora- tory analysis undertaken. Restricting auditory and visual tasks to define modality specific Gs factors using con-firmatory modeling provides further support for their absence. The correlation between latent visual and audi-tory Gs was r = 1.09 demonstrating their perfect linear dependence. Evidence for a single latent RT factor is less convincing because it was possible to define distinct auditory and visual RT factors. However, it was not pos- sible to achieve adequate fit statistics for this model without correlating most residuals—with many resulting correlations not being theoretically sensible—and the resulting model would certainly not have been parsimo- nious. Moreover, the correlation between the modality specific factors was high (r = 0.74) and they shared ap- proximately 55% of their variance. It can be concluded at this time that it is at least possible that there exists dis- tinct auditory and visual RT factors, but that they are strongly related.
This and our previous [1] study fill an important gap in intelligence research. We have sought to test Stankov’s [7] hypothesis that higher-order thinking abilities, other- wise referred to as broad cognitive abilities, can be in- dexed regardless of stimulus modality. Until now, this hypothesis had not been explicitly tested from an audi- tory perspective. However, it appears that broad Gs can be measured via both visual and auditory pathways and this has been replicated twice-over. Additionally, despite allowing for modality specific speed factors in our pre- sent analysis and study design, we do not find evidence to support this notion.
As Roberts et al. [9] have noted, an implicit assump- tion of modern intelligence theories is that no knowledge of importance can be gained through employing tests of complex abilities which utilise alternate modalities. In- deed this might be the case, and we have found no evi-dence that latent Gs as measured by visual and auditory tasks respectively, differs. However, regardless of whether more information is gained by broadening intelligence models and subsequently intelligence tests to encompass measurement of complex abilities via alternate modali- ties, it is the case that in doing so the measurement of cognition itself becomes more ecologically valid. People touch, smell, listen and visualise their environment. The persistent neglect of alternate modalities needs to be overcome and intelligence measures should be broadened to include multiple modalities. Only when this happens can we claim to have achieved ‘truly balanced’ measures of intelligence [29].
REFERENCES
[1] I. T. Zajac, N. R. Burns and V. Danthiir, “Developing
Auditory Measures of General Speediness,” SAGE Open, Vol. 1, No. 3, 2011, pp. 1-8.
doi:10.1177/2158244011429333
[2] L. Stankov, T. Seizova-Cajic and R. D. Roberts, “Tactile and Kinesthetic Perceptual Processes within the Taxon-omy of Human Cognitive Abilities,” Intelligence, Vol. 29, No. 1, 2001, pp. 1-29.
doi:10.1016/S0160-2896(00)00038-6
[3] J. L. Horn and J. Noll, “A System for Understanding Cognitive Capabilities: A Theory and the Evidence on Which It Is Based,” In: D. K. Detterman, Ed., Human
In-telligence: Theories of Intelligence, Ablex, Norwood, 1994, pp. 151-203.
[4] R. D. Roberts, G. Pallier and G. N. Goff, “Sensory Proc-esses within the Structure of Human Cognitive Abilities,” In: P. L. Ackerman, P. C. Kyllonen and R. D. Roberts, Eds., Learning and Individual Differences: Process, Trait,
and Content Determinants, American Psychological As-sociation, Washington DC, 1999, pp. 339-368.
doi:10.1037/10315-015
[5] L. Stankov, “Hierarchical Structure of Auditory Abilities and Relationship between Auditory and Visual Modali-ties,” University of Denver, Denver, 1971.
[6] J. B. Carroll, “Human Cognitive Abilities: A Survey of Factor-Analytic Studies,” Cambridge University Press, Cambridge, 1993. doi:10.1017/CBO9780511571312 [7] L. Stankov, “Auditory Abilities,” In: R. J. Sternberg, Ed.,
Encyclopedia of Human Intelligence, Macmillan, New York, 1994, pp. 157-162.
[8] K. Seidel, “Assesment of Social and Auditory Intelli-gence: New Persepctives and Approaches,” Pabst Science Publishers, Lengerich, 2008.
[9] R. D. Roberts, et al., “Charting the Cognitive Sphere: Tactile-Kinesthetic Performance within the Structure of Intelligence,” Intelligence, 1997, Vol. 25, pp. 111-148.
[10] V. Danthiir, et al., “What the Nose Knows Olfaction and Cognitive Abilities,” Intelligence, Vol. 29, No. 4, 2001, pp. 337-361. doi:10.1016/S0160-2896(01)00061-7 [11] L. Stankov and J. L. Horn, “Human Abilities Revealed
through Auditory Tests,” Journal of Educational
Psy-chology, Vol. 72, No. 1, 1980, pp. 21-44. doi:10.1037/0022-0663.72.1.21
[12] J. L. Horn and L. Stankov, “Auditory and Visual Factors of Intelligence,” Intelligence, Vol. 62, No. 2, 1982, pp. 165-185. doi:10.1016/0160-2896(82)90012-5
[13] L. Stankov, “Fluid and Crystallized Intelligence and Broad Perceptual Factors among 11 to 12 Year Olds,”
Journal of Educational Psychology, Vol. 70, No. 3, 1978, pp. 324-334. doi:10.1037/0022-0663.70.3.324
[14] L. Stankov, J. L. Horn and T. Roy, “On the Relationship between Gf/Gc Theory and Jensen’s Level I/Level II The-ory,” Journal of Educational Psychology, Vol. 72, No. 6, 1980, pp. 796-809. doi:10.1037/0022-0663.72.6.796 [15] N. R. Burns and T. Nettelbeck, “Inspection Time in the
Structure of Cognitive Abilities: Where Does IT Fit?” In-telligence, Vol. 31, No. 3, 2003, pp. 237-255.
doi:10.1016/S0160-2896(02)00120-4
Time,” In: H. J. Eysenck and M. Berger, Eds., A Model
for Intelligence, Springer-Verlag, Berlin, 1982, pp. 133- 148.
[17] H. Olsson, et al., “Auditory Inspection Time: On the Im-portance of Selecting the Appropriate Continuum,”
Per-sonality and Individual Differences, Vol. 25, No. 4, 1998, pp. 627-634. doi:10.1016/S0191-8869(98)00061-0 [18] D. M. Parker, J. R. Crawford and E. Stephen, “Auditory
Inspection Time and Intelligence: A New Spatial Loca- lisation Task,” Intelligence, Vol. 27, No. 2, 1999, pp. 131-139. doi:10.1016/S0160-2896(99)00011-2
[19] C. McCrory and C. Cooper, “The Relationship between Three Auditory Inspection Time Tasks and General Intel-ligence,” Personality and Individual Differences, Vol. 38, No. 8, 2005, pp. 1835-1845.
doi:10.1016/j.paid.2004.11.012
[20] I. T. Zajac and N. R. Burns, “Measuring Auditory Inspec-tion Time in Primary School Children,” Journal of Indi-vidual Differences, Vol. 28, No. 1, 2007, pp. 45-52. doi:10.1027/1614-0001.28.1.45
[21] I. T. Zajac and N. R. Burns, “Relationships between Three Auditory Inspection Time Tasks and Processing Speed,” Australian Journal of Psychology, Vol. 63, No. 3, 2011, pp. 163-172.
doi:10.1111/j.1742-9536.2011.00020.x
[22] J. McPherson and N. R. Burns, “A Speeded Coding Task Using a Computer-Based Mouse Response,” Behavior
Research Methods, Vol. 37, No. 3, 2005, pp. 538-544. doi:10.3758/BF03192725
[23] R. B. Ekstrom, et al., “Kit of Factor-Referenced Cogni-tive Tests,” Educational Testing Service, Princeton, 1976.
[24] V. Danthiir, et al., “Factor Structure and Validity of Pa-per-and-Pencil Measures of Mental Speed: Evidence for a Higher-Order Model?” Intelligence, Vol. 33, No. 5, 2005, pp. 491-514. doi:10.1016/j.intell.2005.03.003
[25] R. D. Roberts and L. Stankov, “Individual Differences in Speed of Mental Processing and Human Cognitive Abili-ties: Toward a Taxonomic Model,” Learning and
Indi-vidual Differences, Vol. 11, No. 1, 1999, pp. 1-120. doi:10.1016/S1041-6080(00)80007-2
[26] G. Evans and T. Nettelbeck, “Inspection Time: A Flash Mask to Reduce Apparent Movement Effects,” Persona-
lity and Individual Differences, Vol. 15, No. 1, 1993, pp. 91-94. doi:10.1016/0191-8869(93)90045-5
[27] G. B. Wetherill and H. Levitt, “Sequential Estimation of Points on a Psychometric Function,” British Journal of
Mathematical and Statistical Psychology, Vol. 18, No. 1, 1965, pp. 1-10. doi:10.1111/j.2044-8317.1965.tb00689.x [28] L. K. Muthen and B. O. Muthen, “Mplus User’s Guide,”
5th Edition, Muthen and Muthen, Los Angeles, 2007.