WSN BASED SENSOR NODE DEPLOYMENT FOR LPG GAS LEAKAGE
DETECTION AND CONTROLLING
1
Mujawar, T. H.,
1Bachuwar, V.D.
1
Department of Electronic Science, School of Physical Sciences, Solapur University, Solapur,
2
Department of Applied Geology, School of Earth Sciences, Solapur University, So
3
Department of Electronic Science, University of
ARTICLE INFO ABSTRACT
Wireless Sensor Networks (WSN) has recently been applied in
including hazardous gases detection. In this paper we present a WSN for hazardous gases detection with a special emphasis given on its monitoring and controlling for home safety. LPG leak can happen, though rarely, inside a
this gas is dangerous as it enhances the risk of explosion. Therefore, systems should be developed that can monitor the level of LPG gas in the vicinity of the firefighters and generate appro
levels of such gases exceed the prescribed safe levels, sending SMS on user mobile phone and turning off the gas supply valve as a primary safety measure. The system more like a First Aid, automatically uses a normally closed solenoid valv
visual display and audible alarm to those within the environment. For the purpose, we propose to set up wireless sensor nodes to monitor the leakage area by measuring the Received Signal Stren Indicator (RSSI) values received by these sensor motes strategically placed at different locations.
Copyright © 2016,Mujawar et al.This is an open access article distributed under the Creative Commons Att distribution, and reproduction in any medium, provided the original work is properly cited.
INTRODUCTION
Wireless networking and distributed data
embedded sensing / actuating nodes under tight energy constraints demand new approaches to the protocol design and hardware / software integration. The wireless sensor network (WSN), is emerging as a powerful platform for distributed embedded computing and data management (
2000). It therefore, plays a vital role for real time applications. The main aim of the wireless sensor network is to collect data from densely deployed WSN nodes in the homogeneous or heterogeneous way (Fraiwan et al., 2011).As the sensor nodes are battery operated, rendering energy must be wisely managed in order to extend the lifetime of the network. The sensor node was designed to detect the leakage of the gas. Thus, the response of the gas leakage detection can be obtained immediately and managed to obtain data from a scene of accident and display it on the monitoring system.
*Corresponding author: Deshmukh, L.P.
Department of Electronic Science, School of Physical Sciences, Solapur University, Solapur, 413 255, M.S, India.
ISSN: 0975-833X
Article History:
Received 24th December, 2015
Received in revised form 27th January, 2016
Accepted 29th February, 2016
Published online 31st March,2016
Key words:
WSN, Solenoid valve, RSSI, Range testing, LPG, LabVIEW,
Internet control.
Citation: Mujawar, T.H., Bachuwar, V.D., Kasbe, M.S., Prabhakar, P., Shaligram, A.D. and Deshmukh, L.P. deployment for LPG gas leakage detection and controlling
RESEARCH ARTICLE
WSN BASED SENSOR NODE DEPLOYMENT FOR LPG GAS LEAKAGE
DETECTION AND CONTROLLING
Bachuwar, V.D.,
1Kasbe, M. S.,
2Prabhakar, P.,
3Shaligram, A.
and
*,1Deshmukh, L. P.
Department of Electronic Science, School of Physical Sciences, Solapur University, Solapur,
413 255, M.S, India
Department of Applied Geology, School of Earth Sciences, Solapur University, So
M.S, India
Department of Electronic Science, University of Pune, Pune-411 007, M.S., India
ABSTRACT
Wireless Sensor Networks (WSN) has recently been applied in
including hazardous gases detection. In this paper we present a WSN for hazardous gases detection with a special emphasis given on its monitoring and controlling for home safety. LPG leak can happen, though rarely, inside a home, commercial premises or in gas powered vehicles. Leakage of this gas is dangerous as it enhances the risk of explosion. Therefore, systems should be developed that can monitor the level of LPG gas in the vicinity of the firefighters and generate appro
levels of such gases exceed the prescribed safe levels, sending SMS on user mobile phone and turning off the gas supply valve as a primary safety measure. The system more like a First Aid, automatically uses a normally closed solenoid valve for shutting off of the gas valve before calling for help via visual display and audible alarm to those within the environment. For the purpose, we propose to set up wireless sensor nodes to monitor the leakage area by measuring the Received Signal Stren Indicator (RSSI) values received by these sensor motes strategically placed at different locations.
is an open access article distributed under the Creative Commons Attribution License, which distribution, and reproduction in any medium, provided the original work is properly cited.
Wireless networking and distributed data processing of the embedded sensing / actuating nodes under tight energy constraints demand new approaches to the protocol design and hardware / software integration. The wireless sensor network (WSN), is emerging as a powerful platform for distributed dded computing and data management (Mokashi et al., . It therefore, plays a vital role for real time applications. The main aim of the wireless sensor network is to collect data from densely deployed WSN nodes in the homogeneous or ., 2011).As the sensor nodes are battery operated, rendering energy must be wisely managed in order to extend the lifetime of the network. The sensor node was designed to detect the leakage of the gas. Thus, the ection can be obtained immediately and managed to obtain data from a scene of accident and display it on the monitoring system.
Department of Electronic Science, School of Physical Sciences,
The present system used a LabVIEW tool to monitor the leakage of gases. Also, GUI created using LabVIEW tool is more interactive, facile and effective (Mujawar
Through our wireless gas sensing system, we built a single XBee network with several XBee wireless nodes where each node consists of an XBee module and an Arduino microcontroller. The arduino consists of a simple open hardware design for a single
embedded I/O support and a standard programming
C/C++, which is the main programming language of the Arduino (Margolis et al., 2011)
modules is done either via an Arduino or via an USB dongle, which is connected to a computer. For a successful deployment of wireless network, we need to evaluate some basic performance parameters such as radio performance (e.g., received signal strength, coverage ranges and link failure probability), packet delays and
focus on the measurement of received signal strength indicator (RSSI). The range test consisted of the effect of the distance, power emitted and disturbance effect of different electronic devices and barriers on the receptio
Many instruments were used in these tests. Some of the tests
International Journal of Current Research
Vol. 8, Issue, 03, pp. 28373-28379, March, 2016
INTERNATIONAL
Mujawar, T.H., Bachuwar, V.D., Kasbe, M.S., Prabhakar, P., Shaligram, A.D. and Deshmukh, L.P. leakage detection and controlling”, International Journal of Current Research, 8, (03), 28373-283
WSN BASED SENSOR NODE DEPLOYMENT FOR LPG GAS LEAKAGE
Shaligram, A. D.
Department of Electronic Science, School of Physical Sciences, Solapur University, Solapur,
Department of Applied Geology, School of Earth Sciences, Solapur University, Solapur413 255,
411 007, M.S., India
Wireless Sensor Networks (WSN) has recently been applied in various monitoring applications including hazardous gases detection. In this paper we present a WSN for hazardous gases detection with a special emphasis given on its monitoring and controlling for home safety. LPG leak can home, commercial premises or in gas powered vehicles. Leakage of this gas is dangerous as it enhances the risk of explosion. Therefore, systems should be developed that can monitor the level of LPG gas in the vicinity of the firefighters and generate appropriate alarms if levels of such gases exceed the prescribed safe levels, sending SMS on user mobile phone and turning off the gas supply valve as a primary safety measure. The system more like a First Aid, automatically e for shutting off of the gas valve before calling for help via visual display and audible alarm to those within the environment. For the purpose, we propose to set up wireless sensor nodes to monitor the leakage area by measuring the Received Signal Strength Indicator (RSSI) values received by these sensor motes strategically placed at different locations.
ribution License, which permits unrestricted use,
The present system used a LabVIEW tool to monitor the Also, GUI created using LabVIEW tool is more interactive, facile and effective (Mujawar et al., 2015). Through our wireless gas sensing system, we built a single-hop XBee network with several XBee wireless nodes where each node consists of an XBee module and an Arduino microcontroller. The arduino consists of a simple open hardware design for a single-board microcontroller with embedded I/O support and a standard programming language; C/C++, which is the main programming language of the ., 2011). Communication with XBee modules is done either via an Arduino or via an USB dongle, is connected to a computer. For a successful deployment of wireless network, we need to evaluate some basic performance parameters such as radio performance (e.g., received signal strength, coverage ranges and link failure probability), packet delays and throughputs. For our system, we focus on the measurement of received signal strength indicator (RSSI). The range test consisted of the effect of the distance, power emitted and disturbance effect of different electronic devices and barriers on the reception of the XBee modules. Many instruments were used in these tests. Some of the tests
INTERNATIONAL JOURNAL OF CURRENT RESEARCH
are repeated to ensure the reproducibility and reliability of the results. Tools used in testing the range were an Arduino XBee module programmed to send back a message t
from a computer using X-CTU. Different configurations and environments were chosen. A loop back test was performed for the range test (Ni et al., 2004).
Experimental arrangements and measurements
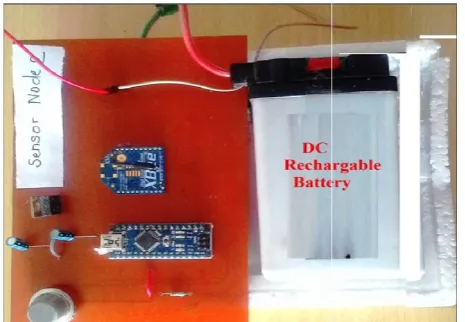
[image:2.595.317.554.134.319.2]The experimental arrangement involved hardware with its control circuit to control the leakage level.
Fig. 1. Sensor node prototype
The control unit circuit diagram
The control unit receives a signal from the gas detector sensor and then sends it to the solenoid valve drive unit and activates an alarm. It also displays the status of the gas concentration on GUI and on the web browser (Mujawar et al
(a) the control unit circuit diagram using solenoid valve is shown. From the circuit diagram, the control circuit is implemented with an Arduino UNO microcontroller which acts as a co-ordinator node. The signals from the MQ
are received from various sensor nodes to the co
[image:2.595.50.280.183.552.2]node. The arduino pins 11, 12, and 13 were used to drive the solenoid valve drive control, exhaust fan and the buzzer alarm, respectively. When the concentration of gas rises above that of threshold level in the microcontroller, the microcontroller sends
Fig. 2. Co-ordinator node set up
28374 Mujawar et al. WSN based sensor node deployment for LPG gas
are repeated to ensure the reproducibility and reliability of the results. Tools used in testing the range were an Arduino – XBee module programmed to send back a message that is send CTU. Different configurations and environments were chosen. A loop back test was performed for
Experimental arrangements and measurements
The experimental arrangement involved hardware for nodes with its control circuit to control the leakage level.
Sensor node prototype
The control unit receives a signal from the gas detector sensor and then sends it to the solenoid valve drive unit and activates an alarm. It also displays the status of the gas concentration on et al., 2015). In fig.3 (a) the control unit circuit diagram using solenoid valve is From the circuit diagram, the control circuit is implemented with an Arduino UNO microcontroller which acts ordinator node. The signals from the MQ-6 gas sensors are received from various sensor nodes to the co-ordinator node. The arduino pins 11, 12, and 13 were used to drive the solenoid valve drive control, exhaust fan and the buzzer alarm, respectively. When the concentration of gas rises above that of ld level in the microcontroller, the microcontroller sends
a signal to the solenoid valve drive unit to close the solenoid valve so as to shut OFF the gas supply and also activate an alarm to alert that there is gas leakage and exhaust fan turns ON (Fig.3 (b)) emitting the gas outside leading to rarification of the gas. The signal from the arduino UNO (co
node) is applied to the base of BJT transistors Q1.
Fig. 3. (a) Control unit circuit diagram using: solenoid valve
Fig. 3. b). Using
The resistance R1 is current limiting resistor. The design values
are selected from the datasheets of SL100 as shown in (b).
Control using solenoid valve
The solenoid valve has two key parts
It is the electromagnetic valve for gas control by stopping or running the current through it by means of which opens or closes the valve. The solenoid valve drive unit controls the opening and closing of the solenoid valve which controls the flow of gas from the supply to the point where the gas is being used. The solenoid valve drive receives signal from the control unit and carries out the appropriate action. Fig. 4 is a solenoid valve drive circuit diagram.
ordinator node set up
WSN based sensor node deployment for LPG gas leakage detection and controlling
a signal to the solenoid valve drive unit to close the solenoid valve so as to shut OFF the gas supply and also activate an alarm to alert that there is gas leakage and exhaust fan turns (b)) emitting the gas outside leading to rarification of the gas. The signal from the arduino UNO (co-ordinator node) is applied to the base of BJT transistors Q1.
Fig. 3. (a) Control unit circuit diagram using: solenoid valve
Using exhaust fan
is current limiting resistor. The design values are selected from the datasheets of SL100 as shown in Fig.3
The solenoid valve has two key parts – a solenoid and a valve. It is the electromagnetic valve for gas control by stopping or running the current through it by means of which opens or The solenoid valve drive unit controls the closing of the solenoid valve which controls the flow of gas from the supply to the point where the gas is being used. The solenoid valve drive receives signal from the control unit and carries out the appropriate action. Fig. 4 is a solenoid circuit diagram. Using arduino to control the
[image:2.595.49.282.191.352.2] [image:2.595.312.557.352.550.2]solenoid valve is simply a case of setting a pin high for the appropriate. Both the arduino and the solenoid work at different voltages, so we cannot directly connect the two. In this case, a
BC547 transistor is used as a bridge. The signal from arduino
Pin 11 is applied to the base of BJT transistors Q1. Resistor R is current limiting resistor which is used to bias the base current of transistor Q1. At the maximum rating of the BC547 (from
datasheet) i.e .Ic = 100mA, hfe = 700, VBE max = 0.9, R
[image:3.595.45.281.183.356.2]determined according to equations (1) and (2) as: 2010; Theraja and Theraja, 2002).
[image:3.595.50.280.355.511.2]Fig. 4. Solenoid valve drive circuit
Fig. 5. An Arduino programming for solenoid valve
R3= V-VBE / IB
IB=IC/ hfe.
From eqn. (2)
IB = 142.857 μA.
For the safe operation of the transistor, four times the value of the current for biasing is required. Thus,
R3= 7.2 kΩ.
Therefore 10 kΩ was chosen in our case. was done by using an arduino IDE as shown in (
Control using fan
Exhaust fan is a means of ventilating an interior by drawing air from the interior and expelling it outside. This system needs a system combination with exhaust fan as the precaution step solenoid valve is simply a case of setting a pin high for the appropriate. Both the arduino and the solenoid work at different voltages, so we cannot directly connect the two. In this case, a The signal from arduino
Pin 11 is applied to the base of BJT transistors Q1. Resistor R3
is current limiting resistor which is used to bias the base current of transistor Q1. At the maximum rating of the BC547 (from
max = 0.9, R3=R4 is
determined according to equations (1) and (2) as: (Apeh et al.,
4. Solenoid valve drive circuit
for solenoid valve
………. (1)
……….. (2)
For the safe operation of the transistor, four times the operating value of the current for biasing is required. Thus,
The programming was done by using an arduino IDE as shown in (Fig. 5).
Exhaust fan is a means of ventilating an interior by drawing air from the interior and expelling it outside. This system needs a system combination with exhaust fan as the precaution step
before entering the dangerous level. It will suck out all the air inside the room or building that had been installed with the system to the outside of the building. Therefore, the air quality inside the building will be maintained in the safe air quality limit. It was established in such a way that, when the gas concentration is below 500 ppm, the exhaust fan is in OFF condition. When the gas leakage level increases beyond the explosive level, the exhaust fan turns ON.
Range test measurements
In this section, we are presenting the data collected at our laboratory with and without barriers.
a) Inside the laboratory- no barrier
In this experiment, we have measured the RSSI level when the distance between two XBee modules changes. We used a non line-of-sight (NLOS) setting in the School of Physical Sciences by placing the coordinator node in front of the door and th remote node inside the room (
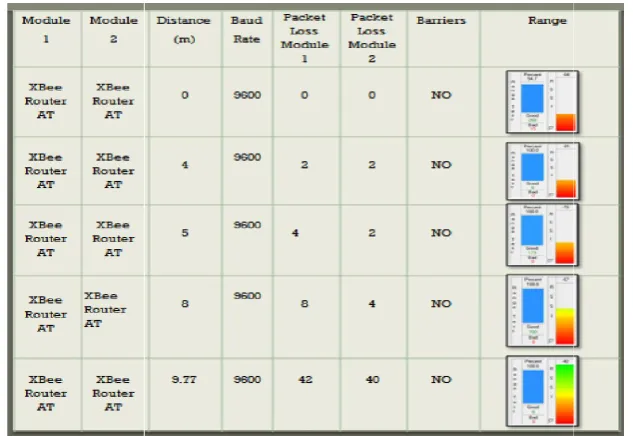
The distance from coordinator was increased and RSSI value was measured. Table 1 shows the range test for two XBee end devices, when there were no bar
experiment, the factors which may affect the strength of the signal (such as the Wi-Fi routers and cordless phones) were not considered (Seongpeng et al., 2011).
only up to 9.77 m and for further inc
packet loss. The signal strength indication of XBee series 2 was tested using USB to UART convertor connected to it and tested on condition such that they are inside the room. Table 2 shows the actual value obtained from the X
the signal strength indicator for XBee modules.
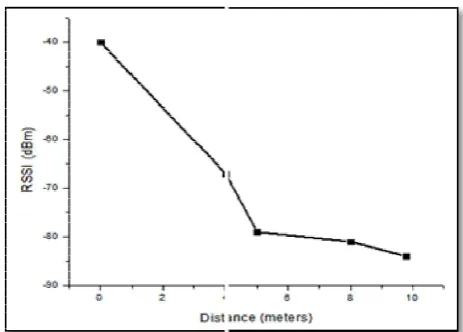
shows a plot of RSSI values in dBm versus distance in meters (X-CTU view). The longest detect range for XBee is up to 9.77 m and captured RSSI value is
increased, signal strength of XBee decreased. Fig. 7 RSSI indication of XBee module in
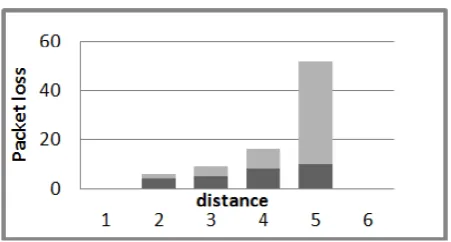
[image:3.595.316.548.557.723.2]is perfect environment for testing the XBee range since we can see the effect of various parameters on the reception. All these effects have been seen for indoor measurement (no barrier) in Fig.7. The effect of varying distance on packet loss and range at constant baud rate of 9600 are displayed in
Fig. 6. A plot of RSSI (dBm) vs distance
before entering the dangerous level. It will suck out all the air side the room or building that had been installed with the system to the outside of the building. Therefore, the air quality inside the building will be maintained in the safe air quality It was established in such a way that, when the gas tion is below 500 ppm, the exhaust fan is in OFF condition. When the gas leakage level increases beyond the explosive level, the exhaust fan turns ON.
In this section, we are presenting the data collected at our and without barriers.
no barrier
In this experiment, we have measured the RSSI level when the distance between two XBee modules changes. We used a
non-sight (NLOS) setting in the School of Physical Sciences coordinator node in front of the door and the remote node inside the room (at the back wall of the room). The distance from coordinator was increased and RSSI value was measured. Table 1 shows the range test for two XBee end devices, when there were no barrier in between them. In this experiment, the factors which may affect the strength of the Fi routers and cordless phones) were not ., 2011). As can be seen, it is safe only up to 9.77 m and for further increase in distance results in packet loss. The signal strength indication of XBee series 2 was tested using USB to UART convertor connected to it and tested on condition such that they are inside the room. Table 2 shows the actual value obtained from the X-CTU software on testing the signal strength indicator for XBee modules. The Fig.6 shows a plot of RSSI values in dBm versus distance in meters CTU view). The longest detect range for XBee is up to 9.77 m and captured RSSI value is -84 dBm. As the distance is increased, signal strength of XBee decreased. Fig. 7 shows on of XBee module in X-CTU view. The X-CTU is perfect environment for testing the XBee range since we can see the effect of various parameters on the reception. All these effects have been seen for indoor measurement (no barrier) in rying distance on packet loss and range at constant baud rate of 9600 are displayed in Table 3.
Module 1
Module 2
Distance
XBee Router in AT Mode
[image:4.595.80.517.67.138.2]XBee Router in AT Mode
[image:4.595.216.381.166.229.2]Table 2. Observations of RSSI
[image:4.595.143.460.252.470.2]Table 3. Range test
Table 4.
Module 1 Module 2
XBee Router in AT Mode
XBee Router in AT Mode
Fig. 7. X
28376 Mujawar et al. WSN based sensor node deployment for LPG gas
Table 1. Range test-AT configuration
Distance (m)
Baud Rate
Packet Loss Module 1
Packet Loss Module 2
Barriers
0 9600 0 0 No
4 9600 2 2 No
5 9600 4 2 No
8 9600 8 4 No
9.77 9600 42 40 No
Table 2. Observations of RSSI vs. indoor distance for XBee modules
Distance (meters) RSSI (dBm)
0 -40
4 -67
5 -79
8 -81
9.77 -84
[image:4.595.130.465.494.771.2]Table 3. Range test-AT configurations (without barrier)
Table 4. Range test –AT configuration (with barriers)
Module 2 Distance (cm) Baud Rate Barriers Signal Strength
XBee Router in AT Mode
100 9600 Wall
300 9600 Wall and doors
700 9600 Wall
900 9600 Wall
7. X-CTU screen for indoor measurement of RSSI value
WSN based sensor node deployment for LPG gas leakage detection and controlling
Barriers Signal Strength (dBm)
No 100%
No 65%
No 60%
No 50%
No 40%
Signal Strength 63% 52% 50% 45%
Table 5. Range test with barriers between the two XBee - AT configurations
[image:5.595.192.418.410.531.2][image:5.595.162.449.560.766.2]
Fig. 8. Effect of distance (in m) on the reception
Fig. 9. Effect of distance (in m) on the lost packet
It is observed that, for a constant baud rate of 9600, when packet loss increases the RSSI decreases.
b) Range test with barrier between the two XBee
modules-AT configurations
The Tables 4 and 5 represent the same results, but in table 5 the X-CTU is shown. It appears that signal strength de
63% to 45% when the distance was increased from 100cm to 900 cm.
RESULTS
For the Range test measurement, most of the collected data are based on AT mode. The API mode was not possible to use in the range test because it is complicated, re
computers and more observations and also arduino works just fine in the AT mode. The fact that the module’s sender is consuming the same amount of power in sending one byte in different modes makes it sure that the results collected from AT mode could be used in understanding API Mode also. The sender hardware is a separate part of the XBee that works always in the same way. There is only one configuration which makes a difference in sending, that configuration is the power send by the module. The only difference is that, when and how long the microcontroller inside the XBee module uses the sender part of the XBee hardware? A range test is affected by many parameters; from the simplest configuration to the complex conditions. This section will make a comparison between each result to find out the best environment and configuration for XBee communication. It aims to find ou reliable communication between the different XBee modules.
Maximum range reception
We used different distances depending on the environment and XBee module’s position. This is represented in fig.8 when no barrier is isolating the two XBee modules.
Internet Control of Lab View
Recently there has been an enormous interest in the development of gas monitoring systems for application in the gas leaks, detection of harmful gases in the mines, home safety and exhausts gas monitoring, etc. In all these
matter is the need of the flexible and practical virtual instruments, a way to easily expose the gas sensors to hazardous levels of gas concentration. A conceptual architecture for a versatile, flexible, cost efficient and portable system for monitoring the gas presence in the air is described elegantly using a LabVIEW tool. The software platform in terms of virtual instruments is developed under LabVIEW programming environment for internet connectivity to cover a large monitoring area
TESTING AND RESULTS
Testing was carried out by incorporating the LPG into the room wherein sensors were placed. The designed system detected the gas leakage and monitored the same by shutting OFF the
28378 Mujawar et al. WSN based sensor node deployment for LPG gas
baud rate of 9600, when
Range test with barrier between the two XBee
The Tables 4 and 5 represent the same results, but in table 5 the It appears that signal strength decreased from 63% to 45% when the distance was increased from 100cm to
For the Range test measurement, most of the collected data are based on AT mode. The API mode was not possible to use in the range test because it is complicated, requires more computers and more observations and also arduino works just The fact that the module’s sender is consuming the same amount of power in sending one byte in different modes makes it sure that the results collected from AT mode could be used in understanding API Mode also. The sender hardware is a separate part of the XBee that works ay. There is only one configuration which makes a difference in sending, that configuration is the power by the module. The only difference is that, when and how long the microcontroller inside the XBee module uses the A range test is affected by many parameters; from the simplest configuration to the complex conditions. This section will make a comparison between each result to find out the best environment and configuration for XBee communication. It aims to find out a reliable communication between the different XBee modules.
We used different distances depending on the environment and XBee module’s position. This is represented in fig.8 when no
Recently there has been an enormous interest in the development of gas monitoring systems for application in the gas leaks, detection of harmful gases in the mines, home safety and exhausts gas monitoring, etc. In all these fields, a key matter is the need of the flexible and practical virtual instruments, a way to easily expose the gas sensors to hazardous levels of gas concentration. A conceptual architecture for a versatile, flexible, cost efficient and portable monitoring the gas presence in the air is described elegantly using a LabVIEW tool. The software platform in terms of virtual instruments is developed under LabVIEW programming environment for internet connectivity to cover a
Testing was carried out by incorporating the LPG into the room wherein sensors were placed. The designed system detected the gas leakage and monitored the same by shutting OFF the
supply automatically through the gas valve and sounded an alarm. The data are then sending to the Lab
VISA. Figs. 12 and 13 show system response on Lab
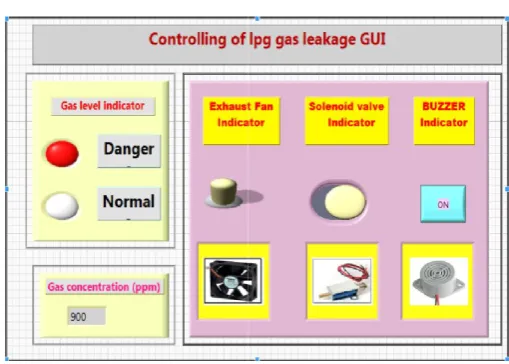
[image:6.595.313.555.132.298.2]results are displayed on GUI. The display of controlling the gas leakage on web browser is as follows. The html file window and URL window are shown in the following snapshots.
Fig. 12. Normal level indicator using Lab View
[image:6.595.310.559.334.515.2]Fig. 13. Explosive level indicator using Lab View Fig. 11. The data monitoring system in the internet browser WSN based sensor node deployment for LPG gas leakage detection and controlling
supply automatically through the gas valve and sounded an rm. The data are then sending to the Lab view through VISA. Figs. 12 and 13 show system response on Lab view and The display of controlling the gas leakage on web browser is as follows. The html file window
shown in the following snapshots.
indicator using Lab View
Fig. 13. Explosive level indicator using Lab View 11. The data monitoring system in the internet browser
[image:6.595.306.561.539.721.2]The webpage for controlling the LPG gas leakage is displayed below. Now with the right button of the mouse placed onto the published VI, choose Request Control of VI. Now press the run continuously button in Lab View and also virtual button in the VI. The control circuit connected to arduino UNO through VISA is now working.
Conclusion
Detection of LPG and it’s monitoring system is made feasible. When a small leak occurs (400 ppm- 600 ppm), the system detects and sends the alert SMS to the end user and activates the alarm and the protection circuitry (Exhaust fan) to control the knob of the cylinder using solenoid valve. When there is a large leakage (> 800 ppm), precautionary measures (such as activation of the buzzer, exhaust fan, etc.) are taken by the system only.
The VISA is interfaced to Lab View and the data monitoring system is interfaced to the internet server. The loopback test is an excellent means of testing communication and various configurations. The XBee has a multitude of configuration settings to deal with addressing, interfacing and input and output controls. Using X-CTU, interface allows range testing with loopback, modem configuration and a terminal window for communication, testing and configuration. A relationship between the measured RSSI and distance for a point-to-point link in non-line-of-sight (NLOS) environment showed the secured range to be about 9.77m without loss of the packets.
Acknowledgements
Authors are thankful to Prof. L.P. Deshmukh, Director School of Physical Sciences, Solapur University, Solapur for providing the facilities to carry out the work. Discussion and encouragement by our T.F. and SSR group (Physics) is highly acknowledged.
REFERENCES
Apeh S.T, Erameh K.B and Iruansi U. Design and Development of Kitchen Gas Leakage Detection and Automatic Gas Shut off System, 5(2014) 222-228.
Fraiwan, L., Lweesy, K., Salma, A.B., Mani, N., A Wireless home safety gas leakage detection system, First Middle East Conference on Biomedical Engineering (MECBME-2011). Margolis, Michael, Arduino Cookbook, Ed. 1, O’REILLY®
Media, Inc., March 2011, pp. 81-213.
Mokashi, M. and Alvi, A.S. 2013. Data management in Wireless Sensor Network: A Survey, International Journal of Advance Research in Computer and Communication Engineering, 2 (2013) 1380-1383.
Mujawar, T.H., Bachuwar, V.D., Kasbe, M.S., Shaligram, A.D. and Deshmukh L.P. 2015, Development of wireless sensor network system for LPG gas leakage detection System, International Journal of Scientific & Engineering Research, 6(2015) 558-563.
Mujawar, T.H., Bachuwar, V.D., Kasbe, M.S., Shaligram, A.D. and Deshmukh L.P., Wireless sensor network system: gas leakage detection and monitoring, International Journal of Current, 7(2015), 18445-18450.
Ni, L., Liu, Y., Lau, Y. and Patil, A., LANDMARC: Indoor location sensing using active RFID, Wireless Networks, 10 2004.
Seongpeng, L. and Yeap, G. H. 2011. Centralized Smart Home Control System via XBee Transceivers, ISBN: 978-1-4673-0020-9, IEEE 2011.