An Improved Signal Segmentation Using Moving Average
and Savitzky-Golay Filter
Hamed Azami, Karim Mohammadi, Behzad Bozorgtabar
Department of Electrical Engineering, Iran University of Science and Technology, Tehran, Iran. Email: [email protected],[email protected], [email protected]
Received October 9th,2011; revised November 13th, 2011; accepted November 22nd, 2011
ABSTRACT
Analysis of long-term EEG signals needs that it be segmented into pseudo stationary epochs. That work is done by re-garding to statistical characteristics of a signal such as amplitude and frequency. Time series measured in real world is frequently non-stationary and to extract important information from the measured time series it is significant to utilize a filter or smoother as a pre-processing step. In the proposed approach, the signal is initially filtered by Moving Average (MA) or Savitzky-Golay filter to attenuate its short-term variations. Then, changes of the amplitude or frequency of the signal is calculated by Modified Varri method which is an acceptable algorithm for segmenting a signal. By using syn-thetic and real EEG data, the proposed methods are compared with original approach (simple Modified Varri). The simulation results indicate the absolute advantage of the proposed methods.
Keywords: Non-Stationary Signal; Adaptive Segmentation; Modified Varri; Moving Average (MA) Filter;
Savitzky-Golay Filter
1. Introduction
Biomedical signals such as electroencephalogram (EEG) and electrocardiogram (ECG) are usually known as non- stationary signal i.e. its statistical characteristics change over the time [1]. The purpose of the segmentation signal is dividing a signal to several epochs with the same sta- tistical characteristics such as amplitude and frequency [2, 3]. Since Analysis of stationary signal is easier than non- stationary signal, signal segmentation is usually applied as pre-processing step for non-stationary signal analysis.
There are two kinds of signal segmentation, namely, constant segmentation and adaptive segmentation. In constant segmentation signal is segmented to fixed ep- ochs [4]. Although constant segmentation is simple and easy in case of implementation, this method has small reliability. Inasmuch as the duration of the signal seg- ments isn’t usually equal, today signal segmentation is performed automatically that it is named adaptive seg- mentation [1]. In [5-11] different methods of adaptive segmentation can be seen.
In Modified Varri method two sliding windows are used. This method is based on combination of a fre- quency measure estimated by the sum of the difference of consecutive signal samples and an amplitude values of the signal in the relevant windows as follows [1]:
1
l
dif k k
A x
(1)1 1
l
dif k k k
F x x
(2)where l and xk are the window length and the kth signal
point, respectively. Thus, the measure difference function (G) is defined as below:
1 1
1 m m 1 m
m dif dif dif dif
G A A A F F F m (3)
where m is the number of the window; A1 and F1 are
constant coefficients which change in various applica- tions. Local maxima in the G function, above a threshold that is defined before, specify boundaries of the segments [1].
Real data usually contains noise. When data is noisy, in many applications such as signal segmentation may not be completely analyzed correctly. Therefore, decrea- sing noise in experimental time series is an important issue. This issue has become increasingly important in health sciences, systems biology, nano-sciences, infor- mation systems, and physical sciences [12]. Filters and smoothers not only can reduce destructive noise and short-term components of a signal, but also these can in- crease the speed of the simulation.
An Improved Signal Segmentation Using Moving Average and Savitzky-Golay Filter 40
random noise. The Savitzky-Golay filter is an effective tool for de-noising and smoothing a signal. The obtained outputs of Savitzky-Golay filter demonstrate the filtered signal contains less noise than the original signal and ex- hibits less distortion than moving average filtering tech- nique of the same order [13-15]. In this paper in order to increase the accuracy of Modified Varri, MA and Savitzky- Golay filter are used. After filtering the signal, Modified Varri which is a powerful method for segmenting a sig- nal is applied.
This paper is organized as follows. Next section ex- plains MA and Savitzky-Golay filters. In the third section the proposed method is described briefly. The perfor- mance of the suggested method is evaluated by synthetic data and real EEG signal which is represented in Section 4. Finally, Section 5 provides conclusion.
2. Background Knowledge for the Proposed
Method
2.1. Moving Average Filter
One of the most common tools for smoothing data is the MA filter, often used to try to capture important trends in repeated statistical surveys. This approach that is known as a type of Finite Impulse Response (FIR) filter is ap-plied to a set of data points by creating an average of different subsets of the full data set. In this paper MA is defined for samples as follows:
2
1
1
5
x n x n x n x n x n
x n 2
(4) where x(n) is the original signal.
2.2. Savitzky-Golay Filter
The Savitzky-Golay filter is a powerful tool for smooth- ing a signal that was proposed by Savitzky and Golay in 1964. The filter is defined as a weighted moving average with weightening given as a polynomial of specific de- gree [13-15]. The coefficients of a Savitzky-Golay filter, when applied to a signal, perform a polynomial P of the degree k, is fitted to points of the sig- nal, where N describes window size. Nr and Nl are signal
points in the right and signal points in the left of a current signal point, respectively [13-15]. One of the best advan- tages of this filter is that it tends to keep features of the distribution such as relative with, maxima and minima which are often flattened by other smoothing techniques such as MA [13-15].
1
r l
NN N
3. Proposed Method
Proposed method is a three-stage procedure that is des- cribed below:
1) First the original signal is filtered by MA or Savitzky-Golay filter to represent the important under- lying unadulterated from of the time series by attenuating its short-term variations. The MA is very fast and it can be implemented simply. The main advantage of Savitzky- Golay filter is that it tries to preserve the features of time series such as its relative minima and maxima, which it is very important issue in segmentation a signal. Unlike wavelet, these filters don’t have shifting effect after fil- tering the signal which is very important characteristic to detect true boundaries of epochs. Mathematically, these filters described in Section 2.1 and 2.2, respectively.
2) As mentioned before, two sliding windows move along the signal and for each window G is determined to find the boundaries of the signal segments. the G vari- ations are computed as follows:
1 1
1 m m 1 m
m dif dif dif dif
G A A A F F F
m (5)
where m is the number of the window; A1 and F1 are
con-stant coefficients which change in various applications. 3) Local maxima in the G function, above a threshold, the mean value in the distribution of the G defined before, identify the boundaries of the segments.
4. Performance Evaluation
The following methods were implemented using MAT- LAB R2009a from Math Works. The performance and efficiency of these methods were evaluated using 50 syn- thetic multi-component data, and real EEG data.
4.1. Synthetic Signal
For assessing the performance of the suggested methods, these algorithms are applied on a set of synthetic multi- component signals which each epoch is selected as a sta- tionary signal. One piece of these signals includes the following seven epochs:
Epoch 1: 0.5cos(πt) + 1.5cos(4πt) + 4cos(5πt), Epoch 2: 0.7cos(πt) + 2.1cos(4πt) + 5.6cos(5πt), Epoch 3: 1.5cos(2πt) + 4cos(8πt),
Epoch 4: 1.5cos(πt) + 4cos(4πt),
Epoch 5: 0.5cos(πt) + 1.7cos(2πt) + 3.7cos(5πt), Epoch 6: 2.3cos(3πt) + 7.8cos(8πt),
Epoch 7: 0.8cos(πt) + cos(3πt) + 3cos(5πt).
Figures 1(a) and (b) show 50 seconds of original
sig-nal and the result of applying simple Modified Varri, respectively. Figure 1(b) dedicates that this algorithm
Figure 1. Signal segmentation in synthetic signal. (a) Original signal; (b) Output of the simple Modified Varri (window length = 2 s, A1 = 7 and F1 = 1).
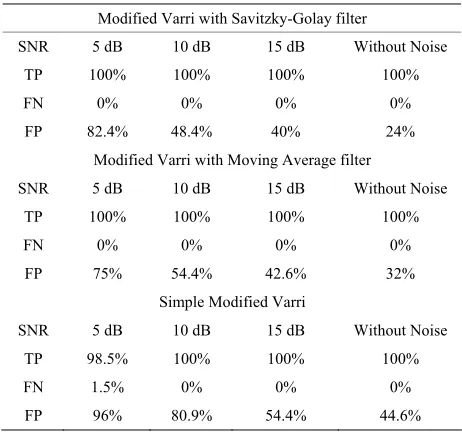
Table 1. Effect of applying proposed methods and existing methods on set of synthetic data.
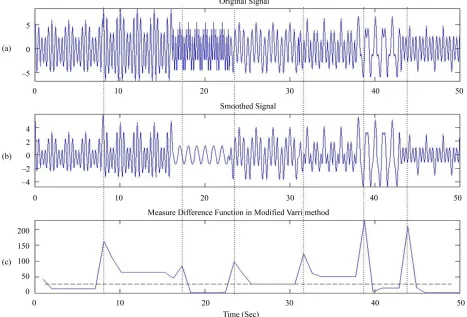
The signal in Figure 1(a) is also segmented using
Modified Varri with MA as a pre-processing step (Fig- ure 2). Also in Figure 3, Savitzky-Golay filter is ap-
plied as a pre-processing step. In this paper, for synthetic data, we have used an order 3 polynomial Savitzky- Golay filter and the frame size of 9 samples. As can be seen in Figures 2(c) and 3(c), the boundaries for all
seven segments can be accurately detected. In order to make the signals more similar to real signals, Gaussian noise is added to original signal and then the perform- ance of the proposed methods are assessed. In this paper 50 synthetic multi-component signals are used.
Three parameters are used to assess the performance of the proposed methods: True Positive (TP) Miss or False Negative (FN) and False Alarm or False Positive (FP) ratios. These parameters are shown follows:
t
,
m
, and
TP N N FN N N FP Nf N
Modified Varri with Savitzky-Golay filter
SNR 5 dB 10 dB 15 dB Without Noise
TP 100% 100% 100% 100%
FN 0% 0% 0% 0%
FP 82.4% 48.4% 40% 24%
Modified Varri with Moving Average filter
SNR 5 dB 10 dB 15 dB Without Noise
TP 100% 100% 100% 100%
FN 0% 0% 0% 0%
FP 75% 54.4% 42.6% 32%
Simple Modified Varri
SNR 5 dB 10 dB 15 dB Without Noise
TP 98.5% 100% 100% 100%
FN 1.5% 0% 0% 0%
FP 96% 80.9% 54.4% 44.6%
where Nt, Nm and Nf represent the number of true, missed,
and falsely detected and N shows actual number of seg-
ment boundaries. 4.2. Real EEG
In Table 1 the results of segmentation for 50 synthetic
data using the proposed methods are shown next to the results of simple Modified Varri method. The obtained results indicate which those proposed methods using fil- ters such as MA and Savitzky-Golay as a pre-processing step can improve TP, FN, and FP ratios. As can be seen in Table 1, TP, FN and FP ratios obtained of Modified
Varri with Savitzky-Golay filter are better than Modified Varri with MA filter. By using Savitzky-Golay filter we can achieve TP and FP ratios equal to 100% and 24% on a set of 50 synthetic signals without noise, respectively.
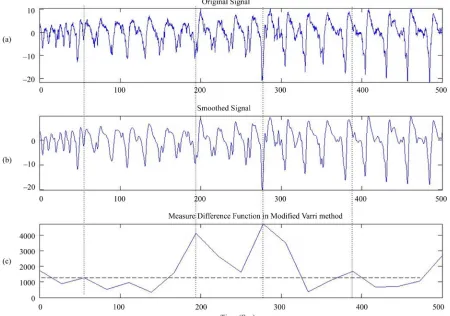
Electroencephalography (EEG) is the neurophysiologic measurement of the electrical activity of the brain using electrodes which are placed on the scalp [4]. As de- scribed before, signal segmentation is a pre-processing step for EEG signals. In this part we have used a real newborn EEG signal that is shown in Figure 4(a). The
length of this signal and the sampling frequency are 500 milliseconds and 256 Hz, respectively.
The result of applying simple Modified Varri and Modified Varri with Savitzky-Golay filter is shown in
An Improved Signal Segmentation Using Moving Average and Savitzky-Golay Filter 42
Figure 2. Signal segmentation in synthetic signal. (a) Original signal; (b) Filtered signal by MA; (c) Output of the Modified Varri (window length = 2 s, A1 = 7 and F1 = 1). As can be all seven segments can be truly detected.
Figure 4. Signal segmentation in real EEG data. (a) Original signal; (b) Output of the simple Modified Varri (window length = 0.04 s, A1 = 7 and F1 = 1).
[image:5.595.73.523.387.703.2]An Improved Signal Segmentation Using Moving Average and Savitzky-Golay Filter 44
EEG data, we have used an order 3 polynomial Savitzky- Golay filter and the frame size of 51 samples. In Figure 5(c) can be seen that all five segments segmented accu-
rately. It should be mentioned that simple Modified Varri could not detect one segment boundary of the signal. We can see the influence of this method compared with achi- eved outputs.
5. Conclusion
One of the existing methods for signal segmentation is Modified Varri. Because real signals usually include dif-ferent noises, this method is unreliable for segmenting a signal. For overcoming this problem we use moving av-erage and Savitzky-Golay filters. These filters reduce short-term noise for a signal that caused that the reliabil-ity of this method increased considerably. Although mov- ing average filter is easier and simpler than Savitzky-Go- lay filter, but performance of using Savitzky-Golay filter is better than moving average. The results indicate that the Modified Varri method with moving average filter has better performance compared to the simple Modified Varri and the Modified Varri with Savitzky-Golay filter has better accuracy comparing with moving average fil-ter.
REFERENCES
[1] H. Azami, K. Mohammadi and H. Hassanpour “An Im-proved Signal Segmentation Method Using Genetic Al-gorithm,” International Journal of Computer Applica-tions, Vol. 29, No. 8, 2011, pp. 5-9.
[2] H. Hassanpour and M. Shahiri, “Adaptive Segmentation Using Wavelet Transform,” International Conference on Electrical Engineering, Lahore, 11-12 April 2007, pp. 1-5.
doi:10.1109/ICEE.2007.4287348
[3] L. Wong and W. Abdulla, “Time-Frequency Evaluation of Segmentation Methods for Neonatal EEG Signals,”
IEEE International Conference on Engineering in Medi-cine and Biology Society, New York, 1-3 September 2006,
pp. 1303-1306. doi:10.1109/IEMBS.2006.259472 [4] S. M. Anisheh and H. Hassanpour, “Adaptive
Segmenta-tion with Optimal Window Length Scheme Using Fractal Dimension and Wavelet Transform,” International Jour-nal of Engineering, Vol. 22, No. 3, 2009, pp. 257-268.
[5] H. Hassanpour, M. Mesbah and B. Boashash, “Time- Frequency Based Newborn EEG Seizure Detection Using
Low and High Frequency Signatures,” Physiological Mea- surement, Vol. 25, No. 4, 2004, pp. 935-944.
doi:10.1088/0967-3334/25/4/012
[6] H. Hassanpour, M. Mesbah and B. Boashash, “Time-Fre- quency Feature Extraction of Newborn EEG Seizure Us-ing SVD-Based Techniques,” EURASIP Journal on Ap-plied Signal Processing, Vol. 2004, No. 16, 2004, pp. 2544-
2554. doi:10.1155/S1110865704406167
[7] K. Kosar, L. Lhotska and V. Krajca, “Classification of Long-Term EEG Recordings,” Lecture Notes in Com-puter Science, Vol. 3337, 2004, pp. 322-332.
doi:10.1007/978-3-540-30547-7_33
[8] M. E. Kirlangic, D. Perez, S. Kudryavtseva, G. Griess-bach, G. Henning and G. Ivanova, “Fractal Dimension as a Feature for Adaptive Electroencephalogram Segmenta-tion in Epilepsy,” IEEE International Conference on En-gineering in Medicine and Biology Society, Vol. 2, 2001,
pp. 1573-1576.
[9] D. Wang, R. Vogt, M. Mason and S. Sridharan, “Auto-matic Audio Segmentation Using the Generalized Likeli-hood Ratio,” 2nd IEEE International Conference on Sig-nal Processing and Communication Systems, Gold Coast,
15-17 December 2008, pp. 1-5. doi:10.1109/ICSPCS.2008.4813705
[10] J. Lv, X. Li and T. Li, “Web-Based Application for Traffic Anomaly Detection Algorithm,” Second IEEE In-ternational Conference on Internet and Web Applications and Services, Morne, 13-19 May 2007, pp. 44-60.
doi:10.1109/ICIW.2007.72
[11] R. Agarwal and J. Gotman, “Adaptive Segmentation of Electroencephalographic Data Using a Nonlinear Energy Operator,” IEEE International Symposium on Circuits and Systems, Vol. 4, 1999, pp. 199-202.
[12] J. Gao, H. Sultan, J. Hu, and W. W. Tung, “Denoising Nonlinear Time Series by Adaptive Filtering and Wavelet Shrinkage: A Comparison,” IEEE Signal Processing Let-ters, Vol. 17, No. 3, 2010, pp. 237-240.
doi:10.1109/LSP.2009.2037773
[13] A. Savitzky and M. J. E. Golay, “Smoothing and Differ-entiation of Data by Simplified Least Square Procedure,”
Analytic Chemistry, Vol. 36, No. 8, 1964, pp. 1627-1639.
doi:10.1021/ac60214a047
[14] J. Lue, K. Ying and J. Bai, “Savitzky-Golay Smoothing and Differentiation Filter for Even Number Data,” Signal Processing, Vol. 85, No. 7, 2005, pp. 1429-1434.
doi:10.1016/j.sigpro.2005.02.002
[15] H. Hassanpour, “A Time-Frequency Approach for Noise Reduction,” Digital Signal Processing, Vol. 18, No. 5,