Multi-resolution Texture Visualization of Vector
Field Based on Fuzzy Feature Measurement
Xu Huaxun, Ma Qianli, Li Sikun, Zeng Liang, Cai Xun
Abstract—Effectively visualizing the feature structures is a challenging work due to the occlusion and clutter constraints in the 3D flow visualization, especially for the texture-based approaches. This paper proposes a multi-resolution texture-based method for visualizing 3D flows texture-based on a fuzzy flow feature extraction method. Existing algorithms always concretely use topology separatrix to partition a flow field into regions of different behaviors. However, flow feature region usually doesn’t have distinct discrepancy and couldn’t be clearly defined. Therefore, guided by the fuzzy theory, we present a fuzzy feature extraction approach which treats the flow features as fuzzy sets and establishes some fuzzy rules to extract them. In the rendering stage, we apply multi-resolution technology to the sparse texture-based method, which are widely used for the advantage of continuous and global representation of flow movements. Based on the fuzzy membership field for flow features, we present a multi-resolution algorithm to prefilter the input noise. The resulted sparse textures could distribute reasonably according to feature structures. Experiments on synthetic and real engineering dataset demonstrate that our approach can depress the occlusion and clutter effectively.
Index Terms—vector field, sparse texture, flow feature, fuzzy theory.
I. INTRODUCTION
T
Exture-based techniques become an effective choice for visualizing vector field. The resulting texture is a powerful way to convey essential patterns of the vector field, while avoiding the tedious task of seeding individual stream-lines to capture all the structures of interest. Texture-based approaches can be loosely classified into two categories: line integral convolution (LIC) [1] and texture advection [2]. The LIC method adopts a noise texture as input, and then the noise is convolved in the direction of the flow using filter kernels. In texture advection, the basic idea is advecting the texel in the direction of the flow to generate the final visual pattern.In two-dimensional vector fields, the texture-based meth-ods are capable of offering a clear representation since it can create a continuous visual representation to illustrate the global behavior of the flow. For three-dimensional vector fields, however, it can be challenging to find a good visual representation of the flow due to the loss of information when the three-dimensional data is projected onto a two-dimensional image plane. And the occlusion and clutter-ing problem encountered when extendclutter-ing the previous ap-proaches to three-dimension make the clear representation
Manuscript received April XX, 20XX; revised June XX, 20XX. This work was financially supported by the National Grand Fundamental Research 973 Program of China under Grant No.2009CB723803 , and by Natural Science Foundation of China (No.60873120)).
Xu Huaxun, Ma Qianli, Li Sikun,Zeng Liang, Cai Xun are with the School of College of Computer Science, National University of De-fense Technology.Changsha city,Hunan province 410073 China e-mail: [email protected].
of vector fields impossible. Especially for dense texture-based techniques, representations of 3D flows make the inner feature structures become more occlusive.
Perception can be improved by highlighting important fea-tures in the flow fields. Feature-based approach is developed to extract some special structures, or some specific patterns of interest, from the flow datasets. There are various features, such as vortices, shock waves, or separatrices, in the flow field. Each of them has specific physical properties, which can be used to extract the desired feature. However, the explicit or clear feature extraction is a harsh and hard term, since there always is no distinct discrepancy among different feature structures in flow fields. Furthermore, some important structures such as vortex or turbulence are so complicatedly mingled that they can’t explicitly expressed by concreted feature primitives.Worsely, these features don’t have accurate definitions at all up to now.
This paper presents a novel texture-based method for visu-alizing 3D flow fields which utilize feature-based and texture-based approaches. To obtain the various feature structures in the flow field, we present a feature extracted algorithm based on fuzzy theory. The main advantage of this algorithm is it’s capability of extracting different flow features in a uniform way. As for rendering stage, we proposed a multi-resolution texture method based on the feature structures extracted to relieve the occlusion and cluttering phenomena, some of our experiment results are showed in Figure 1. The key contri-butions of this paper are: (1) a flexible fuzzy feature region extraction method. By expressing feature regions as a fuzzy membership field, we could define more kinds of feature structures with arbitrary topology shape in a uniform way. To a new feature structure, it is easy to add new fuzzy measure rules into the current algorithm without changing its basic structure. (2) a multi-resolution rendering technique. Based on the fuzzy feature measurement extracted, we generate a multi-resolution input noise for LIC convolution to obtain a dense representation of feature structures in the flow, while rendering the background flow movement in a sparse manner. The remainder of this paper is organized as follows. Related work is discussed in section 2. A detailed explanation of our feature extraction method is provided in section 3. In section 4, we present the multi-resolution noise generation process. Next we will show the experiment results of our method in section 5. Finally, we conclude by pointing out interesting avenues of future work in section 6.
II. RELATED WORK
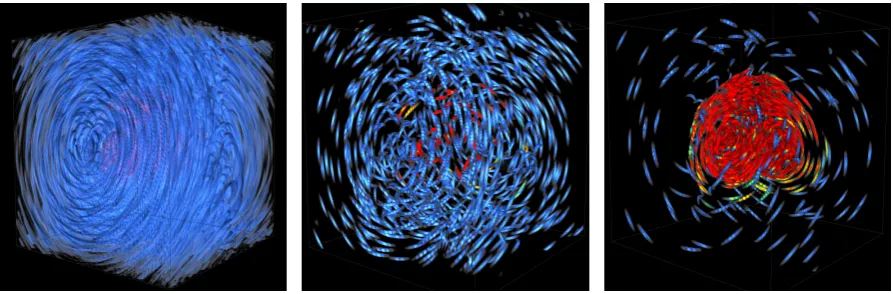
Fig. 1. The integrated Lorenz attractor. Left: The important attractor region are occlusioned with the context when adopting dense texture-based method.Middle: The sparse texture method can resolve the occlusion problem, yet some information about the two spiral attractor structures is also lost. Right: The occlusion and clutter problems are solved by our multi-resolution approach completely, the Lorenz attractor is effectively visualized in an efficient way.
employed in our system, since there is a large literature on this subject. For more detailed discussion on these topics, we refer to related surveys [3]–[5].
Feature-based approach is developed to extract some special structures in flow fields by extracting physically meaningful patterns from the data sets. A popular method used is topological analysis, which first introduced to the 3D visualization community by Helman and Hesselink [6]. Recently, [7] introduced an approach to visualize higher order critical points of 3D vector fields. [8] examined a high-dimensional, massive flow data set around an airfoil using a topology-based vortex analysis. [9] extracted singularities and separatrices to decompose the flow field into topological regions. To some special feature structures, such as vortex, a local criterion proposed by Jeong and Hussain [10]. [11] introduced a system which can analyze the vortex structures contained in the turbulent flows by means of a novel vortex core line detection method. [12] extend the method by a local statistical complexity approach to automatically detect distinctive structures in time-dependent multi-fields. [13] proposed a novel vortex core line extraction method based on the vortex region criterion in order to improve the detection of vortex features for 3D flow visualization. [14] introduced a new criterion to characterize hierarchical two-dimensional vortex regions induced by swirling motion, they defined vortex regions as closed loops that intersect the flow field at a constant angle and presented a parameter free algorithm for the identification of these regions.
Texture-based methods also are an important way to visu-alize vector field. The advantage of this kind of approaches is that they can represent global behavior of the flow in continuous visual representation. A more detailed discussion on these topics can refer to related surveys [15]. Early tech-niques include spot noise [16] and Line Integral Convolution (LIC) technique [1]. Some related approaches adopt tex-ture advection [2] technology, including Lagrangian-Eulerian Advection (LEA) [17] and Image-Based Flow Visualization (IBFV) [18] approaches.
Recent advances in texture-based visualization extend the above-mentioned techniques into 3D vector fields. Shen et al. presented an interactive texture-based algorithm for visu-alizing three-dimensional vector fields, which allowing the user to compute three dimensional flow textures interactively
and to modify the appearance of the visualization on the fly [19]. Bachthaler et al. introduced an orthogonal vector field visualization method based on 2D manifolds [20]. Weiskopf et al. proposed an interactive technique for the dense texture-based visualization of unsteady 3D flow, taking into account issues of computational efficiency and visual perception. A primary challenge for dense texture-based methods is occlusion and cluttering problem, due to the dense rendering objects will be occluded by others. Some previous works are capable of producing a global but sparse representation of steady 3D vector fields to reduce the occlusion phenomena [19], [21]. Falk et al. presented a largely output-sensitive visualization method for 3D line integral convolution, which also adopting sparse streaks to avoid the same perceptual issues [24].
In contrast to previous concrete illustrations of flow fea-ture, we utilize fuzzy theory to express the holistic/rough overview over the dataset and our method do not require a clear classification into interesting or not. Relevant regions can be identified subsequently as a subset of the rough partition with different flow behavior. Some features in 3D flows are very complex and our knowledge about them is incomplete, so their regions can’t be defined clearly. We believe that fuzzy theory can overcome this shortcoming for it’s capability of describing objects without complete knowledge. Based on the feature structures extracted, multi-resolution ideas can be adopted to avoid the occlusion and cluttering for 3D texture-based approaches.
III. FUZZYMEASUREMENT OF3D FLOWFEATURE
In this section, we would introduce the mathematical description for 3D flow features guided by fuzzy theory. Following the brief review of topology analysis of 3D flows (Section 3.1), the related definitions and rules are addressed in Sections 3.2, and how to calculate the fuzzy membership degree will be discussed in Sections 3.3.
A. Representation of 3D Flow Based on Fuzzy Theory
Definition1 Flow Field:The flow field can be regarded as a triple𝑈(Φ,Υ,Π), including basic propertiesΦ, derived propertiesΥand associated propertiesΠ.
The basic properties including position and velocity, which is the primary attributes of the flow fields. The derived properties, such as gradients and vortices, are derived from the basic properties. The associated properties are temper-ature, pressure and some other physical properties which are closely related with the basic properties. Based on the definition above, we introduce the flow feature and other related concepts here from the perspective of fuzzy theory.
Definition2 Flow Feature: The flow feature in the flow field𝑈(Φ,Υ,Π)is a fuzzy subset𝐹𝑖, which has one special attribute i in the 3D flowX, it can be regarded as a ordered pair:
𝐹𝑖 = {𝑥, 𝜇𝑖
𝐹(𝑈(𝑥))}, 𝑥∈𝑋; 𝜇𝑖
𝐹(𝑈(𝑥)) = 𝜇𝑖𝐹(Φ(𝑥),Υ(𝑥),Π(𝑥))∈[0,1]
The mapping𝜇𝑖𝐹(𝑥)is membership function, which mapping a ∀𝑥 ∈X to a certain value in the range [0, 1], named as membership degree of x for feature subset 𝐹𝑖 . When one position have greater value x, it means that the possibility of this point subjecting to a feature region is larger.
Definition3 Feature Region: If 𝐹𝑖 is a flow feature of property i, then the feature region of 𝐹𝑖 is a crisp set containing all points meeting𝜇𝑖𝐹(𝑥)>0.5in the universe of domain X, which corresponds to the support set of 𝐹𝑖 and denoted by𝑆𝑢𝑝𝑝𝐹𝑖 or𝐹0𝑖+ , that is:
𝐹𝑖
1=𝐾𝑒𝑟𝐹𝑖={𝑥∣𝜇𝑖𝐹(𝑥) = 1}
The advantage of definition by using fuzzy subset is able to qualitatively describe flow feature. For instance, though we don’t understand vortex feature clearly, but we know that if a position has greater𝜆2value, then it has greater possibility fell into the vortex region.
B. Fuzzy Rules of Feature Region Measurement
After the redefinitions of flow feature and some related concepts based on fuzzy theory, the question remaining is how to judge a point in flow field is whether in a special feature region or not. Based on the definitions introduced in section 3.2, we build relevant fuzzy rules from three levels, including basic properties, derived properties and associated properties, to divide the whole field into feature regions and the context.
ΦRule:If𝐶0𝑖 represents a critical point set, and𝐶0𝑖⊆𝑋 , we then have
∀𝑥∈𝐶𝑖
07→𝜇𝑖𝐹(𝑥) = 1
By Φ rule, we get the cores of flow features including sinks, sources and saddles, as described in section 3.1. Certainly, there are other methods to get cores for some special features, such as minimum 𝜆2 approach for vortex. But we want to represent general topology feature in this paper, so we just introduced this rule.
In a flow field, the physical property such as heat will propagate along streamlines. So the feature region in flow field should reflect this directional property. To describe this property, we introduce the concept of streamline distance firstly.
Definition6 Streamline Distance: For any two points in the vector field, the streamline distance is defined as following:
𝐿={ ∫𝐴𝐵𝑓(𝑥)𝑑𝑥 iff existing a streamline f cross A, B
∞ otherwise
The streamline distance represents the space between two positions along the streamline. Based on this concept, we build the first derived property rule:
Υ.1Rule: For any point x, y in the vector field, if x is closer to one critical point cthanyin streamline distance, thenxhas greater degree of membership of c:
∀𝑥, 𝑦∈𝑈, 𝑐∈𝐶𝑖, 𝐿(𝑥, 𝑐)< 𝐿(𝑦, 𝑐)7→𝜇𝑖
𝐹(𝑈(𝑥))> 𝜇𝑖
𝐹(𝑈(𝑦))
To sources and sinks, the above rule is able to reflect their feature region effectively, as shown in figure 3. However, sad-dles are composed by one pair of hyperbolic surfaces. If we only use streamline distance, it should be unsatisfactory for extracting the feature region in the hyperbolic sector and the elliptic sector, since there is no streamline which come from the critical point in these parts. At the same time, there are some structures like close orbits, their streamline distances from any critical point are infinite, so we can’t compute its membership degree by streamline distance. Therefore, we introduce the following rule based on Euler distance to solve this problem:
Υ.2Rule:For any pointx in vector field, if its Euler dis-tance from one critical pointcis smaller, then its membership degree subjecting tocis greater:
∀𝑥, 𝑦∈𝑋, 𝑐∈𝐶𝑖, 𝐷(𝑥, 𝑐)< 𝐷(𝑦, 𝑐)7→𝜇𝑖
𝐹(𝑈(𝑥))> 𝜇𝑖
𝐹(𝑈(𝑦))
As for vortex, which can seem as special sink type in some aspects, we establish a measurement rule based on𝜆2 method [12], [13], [25].
Υ.3Rule: For any point x with less negative 𝜆2 value than pointyin the vector filed, then its membership degree subjecting to one vortexcis greater:
∀𝑥, 𝑦∈𝑋, 𝜆2(𝑥)< 𝜆2(𝑦)7→𝜇𝑖𝐹(𝑈(𝑥))> 𝜇𝑖𝐹(𝑈(𝑦)) In addition, there exit other attribute fields such as tem-perature, pressure and etc. Therefore, we build the following rule between the cyclone and the low pressure center for typhoon dataset.
Π.1Rule: If we have corresponding pressure field, then the pointx which have a smaller pressure value thanywill have a greater membership degree to one sink point:
∀𝑥, 𝑦∈𝑋, 𝑃(𝑥)< 𝑃(𝑦)7→𝜇𝑖
𝐹(𝑈(𝑥))> 𝜇𝑖𝐹(𝑈(𝑦)) There may be some other rules for depicting flow features. The advantage of our method is its flexibility for adding new rule without changing its basic framework. To our tested datasets, these rules are enough for extracting the user-interested feature regions.
C. Fuzzy membership calculation
Assuming there are c points in the flow field X, and the current sample point is 𝑥𝑘.The essence of the Υ.1rule is to judge whether the current sample point 𝑥𝑘 and the critical points are in the same streamline, so we build the following c-dimensional character vector for the Υ.1 rule:
𝑉Υ.1(𝑥𝑘) = (𝑟𝑘1, 𝑟𝑘2, . . . , 𝑟𝑘𝑐),
where𝑟𝑘𝑗(1≤𝑗≤𝑐)=
{
0 iff𝐿(𝑥𝑘, 𝑐𝑗=∞)
1 otherwise Where 𝑐𝑗 is the j-th critical point. For example, if𝑥𝑘 is at the streamline which starts from𝑐𝑗and ends at𝑐𝑙, then we have𝑉Υ.1(𝑥𝑘) =
(0,0, . . . , 𝑟𝑘𝑗= 1,0, . . . , 𝑟𝑘𝑙= 1, . . . ,0).
The Υ.2 rule represents the Euler distance between the sample point𝑥𝑘 and the critical points, so we use the sample point coordinate and build the character vector 𝑉Υ.2(𝑥𝑘) =
(𝑥𝑘, 𝑦𝑘, 𝑧𝑘).
To the Υ.3 and Π.1 rules, we also build the following character vectors𝑉Υ.3(𝑥𝑘) =𝜆2(𝑥𝑘)and𝑉Π.1(𝑥𝑘) =𝑝(𝑥𝑘). Consequently, we get a c+5 dimensional character vector for every sample point:
𝑉(𝑥𝑘) = (𝑉Υ.1(𝑥𝑘), 𝑉Υ.2(𝑥𝑘), 𝑉Υ.3(𝑥𝑘), 𝑉Π.1(𝑥𝑘)) After the computation of character vectors, we normalize the vectors to convert them into the range [0, 1]. Because critical points are the centers of feature regions in the flow fieldX, we regard them as the standard samples.
Finally, the membership degree of is computed by the following formula (13). Similar to [22], this approach can be proved to be the optimal in the minimum-square-sum rule.
𝜇𝑖𝑘=
⎧ ⎨ ⎩
𝑐∑+1
𝑗=1 𝑑𝑖𝑘
𝑑𝑗𝑘 if𝐼𝑘=𝜙
1− 𝐿(x𝑘,𝑐𝑖)
𝐿𝑙𝑒𝑛(x𝑘) if𝐼𝑘=∕ 𝜙,𝑖∈𝐼𝑘 and𝑖≤𝑐
0 if𝐼𝑘∕=𝜙,𝑖∈𝐼𝑘 and𝑖≤𝑐
1−∑𝑐
𝑖=1𝜇𝑖𝑘 otherwise
(1) Where 𝐼𝑘 = {𝑖∣1 ≤ 𝑖 ≤ 𝑐, 𝑑𝑖𝑘 = 0} , 𝐼𝑘 = {𝑖∣1 ≤ 𝑖 ≤
𝑐} −𝐼𝑘, and 𝑑𝑖𝑘 = ∥𝑉(𝑥𝑘)−𝑉(𝑐𝑖)∥ = ( 𝑐∑+5
𝑗=0(𝑉𝑗(𝑥𝑘)− 𝑉𝑗′(𝑐𝑖))2)1/2 is the deviation between the current point and the related standard sample𝑐𝑖, and𝐿(𝑥𝑘, 𝑐𝑖)is the streamline distance between𝑥𝑘 and𝑐𝑖,𝐿𝑙𝑒𝑛(𝑥𝑘)denotes the length of the streamline across the𝑥𝑘 in the flow field X.
IV. MULTI-RESOLUTIONLINEINTEGRALCONVOLUTION
Next we will introduce our noise generation method firstly, and then present the multi-resolution controlled approach proposed by this paper. The sparse flow textures are created by an output-sensitive LIC algorithm, which accelerated the line integral convolution process by skip the part where don’t have contribution on the final rendering result.
A. Noise Generation
The original input noise for LIC algorithm is white noise, which generates a pseudo-random number sequence. A draw-back of this approach is the sparse noise texels generated are not even enough to cover the vector field well-proportioned. This is why some papers adopted low discrepancy sequence
[23], which tend to provide a more well-distributed set of samples than pseudo-random method.
Low discrepancy sequence is a point sets which can acquire the minimum order of magnitude of the estimation error in quasi-Monte Carlo methods. The most simple low discrepancy sequences are Hammersley sequence and the Halton point set. But the Hammersley sequence is finite, so the sample number N is restrained to a fixed number of points. So we use the closely related Halton sequence here for seed generation, it has the nice property that new seeds can be adaptively generated [23].The common low discrepancy sequence can be generated by radical inverse function, which is showed as following:
Φ𝑏(𝑖) :=
∞
∑
𝑗=0
𝑎𝑗(𝑖)𝑏−𝑗−1⇔𝑖=
∞
∑
𝑗=0
𝑎𝑗(𝑖)𝑏𝑗 (2)
Here𝑏is the base number, and Φ𝑏(𝑖)represents the expres-sion of𝑖in base 𝑏, and the final i-th sequence number with b can be calculated as the right part of label⇔. Based on the inverse function, the Halton sequence are constructed by 𝑥𝑖 = (Φ𝑏1(𝑖), ...,Φ𝑏𝑛(𝑖))where𝑏1, ..., 𝑏𝑛 are the first prime
numbers.
After the construction of the Halton point sets, we use Gaussian filter to smear out the sparse noise ball. This filter has an advantage of an exponential fall-off property, whether in spatial space or frequency space. Depending on the filter kernel width, the final LIC sparse streamlines of different thickness can be achieved.
B. Multi-resolution control
The resulting sparse noise generated by previous methods [24] distributed evenly in the vector field. One shortcoming of this approach is the accurate information on feature structures or the region of user interested could be neglected in the final rendering results. The information of some flow region interested may be lost when the resulted noise is too sparse, while dense noise may arouse the occlusion problem. So it is reasonable to visualize different regions with different degrees of accuracy on a single image.
The sparse multi-resolution noise generation process is given in the algorithm 1, where M denotes the feature measure value obtained in the section 3, and N is the output sparse noise. Because we can treat the flow feature as a fuzzy sets, so the measure value is a number in the range [0,1]. It can be seen as the probability of one voxel in vector filed subjected to the feature region. So the output sparse noise of algorithm 2 guarantees the feature regions in the flow have a more detailed representation than the unimportant areas.
C. Output-Sensitive Line Integral Convolution
In this paper, the texture-based visualizing strategy is based on the LIC approach, and we adopted sparse tex-ture method to avoid the perception difficulties. The LIC evaluates the final texture value at position as following:
𝜌(r) = 𝑠0+∫𝐿𝑒
𝑠0−𝐿𝑠
𝑘(𝑠−𝑠0)𝑁(𝜎(𝑠))𝑑𝑠
Algorithm 1 Multi-resolutionNoiseGeneration
Input :𝑎, 𝑀 Output :𝑁
1: while𝑛 < 𝑁 do
2: Generate a random position 𝑃 in vector field. 3: Obtain the measure membership value 𝑀[𝑃]
ob-tained in section 3.
4: Generate a random number𝑟 in[0,1]. 5: if 𝑟∗𝑀[𝑃]> 𝑎then
6: Filtered by Gaussian kernel function, with P as center position.𝑛+ +.
7: else
8: Reject the position 𝑃 as seed points; 9: end if
10: end while
noise is instrumental in determining the representation of the flow visualization.
Previous LIC approaches separated the computing process of 3D noise𝜌(𝑟)from the step of volume rendering integral. This suffers from a main disadvantage is an unnecessary evaluation of the LIC integral for points that are invisible due to occlusion or feature extraction. To solve this problem, we adopted the output sensitive LIC approach mentioned in [24], which use an on-the-fly computation of the LIC integral during volume rendering. The basic idea is that the rendering cost should be proportional to the complexity of the contributions to the information on the image plane and independent of the data set size. So it adopted some culling acceleration techniques such as early-ray termination, which are extremely beneficial to improve the render performance since the LIC computation is not executed for noncontribut-ing samples.
Because the distribution of input spares noise in our method is proportional to the importance of flow feature, so there are lots of unimportant regions which don’t influence the final rendering result can be culled early. This can improve the time performance of LIC computation, while maintaining a high quality for the flow visualization.
V. RESULTS ANDDISCUSSION
We tested our approach on numerical and synthetical simulation datasets. For the numerical case, we examined a spacecraft dataset, coming from real engineering project. For synthetical flow data, we examined the classical Lorenz attractor 𝑢 = (10(𝑦 −𝑥),28𝑥− 𝑦 −𝑥𝑧, 𝑥𝑦 − (8/3)𝑧). The experiments we have implemented make full use of GPU acceleration technologies to improve the rendering performance.
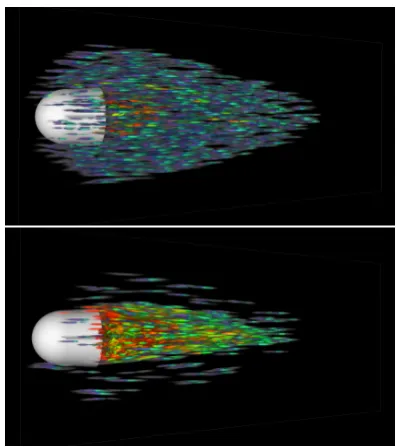
[image:5.595.326.525.50.274.2]As for the spacecraft dataset, our method also can extract and show vortex feature regions effectively. As showed in Figure 2(a), the texture visualizing result based on the input noise without prifiltered by the algorithm 1, and the vortex structures are occluded by the around sparse LIC streaks. This problem is relieved greatly in the Figure 2(b), which adopts the multi-resolution approach prensented in this paper. The vortex regions are emphasized by dense texture visualization, while the background flows are showed in a sparse manner.
Fig. 2. Our method can depict feature regions more clearly in the overall flows with multi-resolution method(b). While previous method [24],adopting evenly distributed noise,can’t represent the vortex structure very well since the occlusion problem(a).
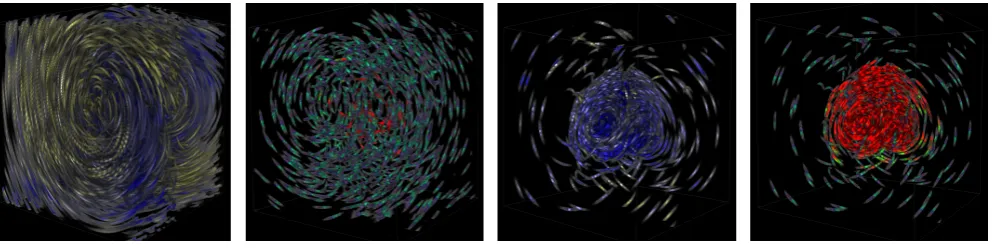
We also used two cool/warm tone based illumination methods [26] in our experiments. As shown in Figure 3, the upper row uses noise droplets distribute evenly in the vector field, while the lower row adopted our multi-resolution prefiltering algorithm and the noise droplets density is pro-portional to feature structure membership value. Figure 3(a) used a scumbled cool/warm illumination model, and it can reflect the flow direction very well in an overall manner. However, the combination this method with the input noise generated by algorithm 2 loses its advantage of representing the concrete flow direction. Compared with this method and traditional gradient-based method (see Figure 3(c)), the exquisite model is able to reflect the direction of flow clearly in any situation, as showed in the Figure 3(b) and (d). Furthermore, the occlusion phenomena can be solved very well with our multi-resolution approach, as showed in Figure 3(c) and (d).
VI. CONCLUSIONS AND FUTURE WORK
In this paper we have presented an interactive particle-based method for visualizing vector fields, capable of gen-erating a global but sparse representation of the flow. This method regards the flow feature as fuzzy subset and estab-lishes some rules to calculate the flow feature membership. Once the membership field calculation is completed, the output data are sent to graphic hardware as a texture to identify the importance of each point in the field.
Fig. 3. From left to right, rendering lorinz dataset with: (a) evenly distributed input noises and scumbled cool/warm illumination model, (b) evenly distributed input noises and exquisite cool/warm illumination model, (c) multi-resolutional distributed input noises and the gradient-based illumination model, (d) multi-resolutional distributed input noises and the exquisite model.
Our method have some weaknesses to improve in the future. For instance, it is time-consuming when the flow structures are complicated. We will continue to simplify the calculation of membership value and explore further benefits of having multiple graphics cards. Another problem to be solved is the reasonable textures density control in algorithm 1. As showed in the Figure 2, the density of sparse textures are too large so that the occlusion phenomenon is still serious. And for some complex features, such as turbulence, we don’t have taken into consideration now. A possible extension is to build some new measure rules to resolve this problem. Another possible future work is exploring multi-dimensional transfer function and extending our approaches to unstructured and irregularly grid-structured data.
REFERENCES
[1] B. Carbal , L.C. Leedom, ”Imaging vector fields using line integral convolution,” In ACM SIGGRAPH Conference 1993, pp. 263-270. [2] N. Max and B. Becker, ”Flow Visualization Using Moving Textures,”
In Procceding of ICASW/LaRC Symp. Visualizing Time-Varying Data 1995,pp. 77-87.
[3] F.H. Post, B. Vrolijk, H. Hauser,R.S. Laramee, H. Doleisch, ”The state of the art in flow visualisation: Feature extraction and tracking,” Computer Graphics Forum, 2003, 22(4), 775-792.
[4] C. Garth, X. Tricoche, ”Topology and feature based flow visualizaion: methods and applications,” In Proceedings of SIAM Conference on Geometric Design and Computing 2005.
[5] S. Tobias, J. Heike, W. Thomas, S. Gerik, ”The State of the Art in Flow Visualization: Partition-Based Techniques,” In Proceedings of Simulation and Visualization, 2008, pp. 75-92.
[6] J.L. Helman,L. Hesselink, ”Visualizing Vector Field Topology in Fluid Flows,” IEEE Computer Graphics and Applications. 1991, 11(3), 36-46. [7] T. Weinkauf, H. Theisel, K. Shi, et al., ”Structure accentuating Dense Flow Visualization,” In Proceedings of IEEE Visualization 2005, pp. 559-566.
[8] T. Weinkauf, J. Sahner, B. Gunther, H. Thesel,H.C. Hege, F. Thiele, ”Feature-based Analysis of a Multi-Parameter Flow Simulation,” In Proceedings of SimVis 2008, pp. 237-252.
[9] W. Keqin, L. Zhanping, Z. Song, J. Robert , II. Moorhead, ”Topology-Aware Evenly-Spaced Streamline Placement,” IEEE Transactions on Visualization and Computer Graphics(03), IEEE computer Society Digital Library(2009).
[10] J. Jeong, F. Hussain, ”On the identification of a vortex,” Journal of Fluid Mechanics, 1995, 28(5), 69-94.
[11] S. Stegmaier ,U. Rist , T.Ertl, ”Opening the can of worms: An ex-ploration tool for vortical flows,” In Proceedings of IEEE Visualization 2005, pp. 463-470.
[12] H. Janicke, A. Wiebel, G. Scheuermann , W.Kollmann, ”Multifield Visualization Using Local Statistical Complexity,” In Proceedings of IEEE Visualization 2007 ,pp. 1384-1391.
[13] T. Schafhitzel, J.E. Vollrat,J.P. Gois, D. Weiskoph, A. Castelo,T. Ertl, ”Topology- Preserving l2-based Vortex Core Line Detection for Flow Visualization,” Computer Graphics Forum, 2008, 27(3), 1024-1030.
[14] P. Christoph, K. Jens, P. Steffen, H. Hanschristian , ”Hierarchical Vortex Regions in Swirling Flow,” Computer Graphics Forum, 2009, 28(1), 863-870.
[15] R.S. Laramee, H. Hauser, H. Doleisch, B. Vrolijk, F.H.Post, and D.Weiskopf, ”The State of the Art in Flow Visualization: Dense and Texture-Based Techniques,” Computer Graphics Forum, 2004, 23(2), 143-161.
[16] J.J. van Wijk, ”Spot Noise-Texture Synthesis for Data Visualization,” Computer Graphics, 1991, 25, 309-318.
[17] B. Jobard, G. Erlebacher, and M.Y.Hussaini, ”Lagrangian- Eulerian Advection of Noise and Dye Textures for Unsteady Flow Visualization,” IEEE Trans. Visualization and Computer Graphics, 2002, 8(3), 211-222. [18] J.J. van Wijk, ”Image Based Flow Visualization,” ACM
Trans.Graphics, 2002, 21(3), 745-754.
[19] Han-Wei Shen, Guo-Shi Li, Udeepta D. Bordoloi, ”Interactive Visual-ization of Three-Dimensional Vector Fields with Flexible Appearance Control,” IEEE Transactions on Visualization and Computer Graphics, 2004, 10(4), 434-445.
[20] S. Bachthaler and D. Weiskopf, ”Animation of Orthogonal Texture-Based Vector Field Visualization,” In Proceedings of Eurovis 2007, pp. 219-226.
[21] S. Guthe, S. Gumhold, and W. Strager, ”Interactive Visualization of Volumetric Vector Fields Using Texture Based Particles,” In Procceding of Central Europe Computer Graphics and Visualization 2002. [22] HB. Gao, ”Fuzzy Cluster Analysis and its application,” Xi’an, Xidian
University press, 2004.
[23] H. Niederreiter, ”Random Number Generation and Quasi-Monte Carlo Methods,” Society for Industrial and Applied Mathematics, Philadel-phia, PA, USA, 1992.
[24] M. Falk, D. Weiskopf, ”Output-Sensitive 3D Line Integral Convolu-tion,” IEEE Transactions on visualization and computer graphics, 2008, 14(4), 820-834.
[25] S. Stegmaier, T. Ertl, ”A Graphics Hardware-based Vortex Detection and Visualization System,” In Proceedings of IEEE Visualization 2005, pp. 195-202.