Richard Power
∗ Open UniversitySandra Williams
∗∗ Open UniversityWe describe a computational model for planning phrases like “more than a quarter” and “25.9 per cent” which describe proportions at different levels of precision. The model lays out the key choices in planning a numerical description, using formal definitions ofmathematical form (e.g., the distinction between fractions and percentages) androundnessadapted from earlier studies. The task is modeled as a constraint satisfaction problem, with solutions subsequently ranked by preferences (e.g., for roundness). Detailed constraints are based on a corpus of numer-ical expressions collected in theNUMGENproject,1and evaluated through empirical studies in which subjects were asked to produce (or complete) numerical expressions in specified contexts.
1. Introduction
We describe in this article a computational model for planning phrases that express proportions (e.g., “more than a quarter” and “25.9 percent,” among others, as alternative descriptions of the proportion 0.259). This task is of interest for several reasons. First, such expressions are very common in factual discourse—they will be found on almost any page in a newspaper or scientific journal. Second, any numerical value can be expressed in a variety of ways, differing along such dimensions as precision, formality, and mathematical sophistication; generating the range of suitable phrases is therefore non-trivial. Third, the matter has been largely ignored in the literature on Natural Language Generation (NLG), even though many NLG systems are designed to produce text from numerical data in domains like weather forecasting (Reiter et al. 2005), stock market trends,2and medical records (Hallett, Scott, and Power 2007). Finally, and more subtly, the task provides a convenient microcosm of the general pragmatic problem of determining optimal information content—for instance, of balancing preferences for precision and brevity (Krifka 2002).
The work reported here was carried out in the NUMGENproject, and exploits the NUMGENcorpus of numerical expressions drawn from families of textsdescribing the
∗ Department of Computing, Open University, Milton Keynes MK7 6AA, UK. E-mail:[email protected].
∗∗ Department of Computing, Open University, Milton Keynes MK7 6AA, UK. E-mail:[email protected].
Submission received: 1 August 2009; revised submission received: 31 March 2011; accepted for publication: 25 May 2011.
1 NUMGEN: Generating intelligent descriptions of numerical quantities for people with different levels of numeracy (http://mcs.open.ac.uk/sw6629/numgen). NUMGENwas funded by the Economic and Social Research Council under Grant Ref. RES-000-22-2760.
same facts. Because the same quantitative fact is mentioned within and across multiple texts, the corpus provides many examples of linguistic expressions that describe exactly the same quantity. For instance, the following excerpt from an article in the UK news-paperThe Daily Telegraphcontains several expressions representing proportions, includ-ing the two phrases given as examples in the openinclud-ing sentence of this article (and shown here in italics), both of which describe the proportion of A-level papers3that received the top grade (A) in 2008:
A-level results show record number of A grades
Record numbers of teenagers have received top A-levels grades.More than a quarterof papers were marked A as results in the so-called gold standard examination reach a new high.
The overall pass rate also rose beyond 97 per cent for the first time — the 28th straight increase — fuelling claims that A-levels are now almost impossible to fail. [. . . ] Today’s results for 300,000 students in England, Wales and Northern Ireland were expected to trigger a scramble to get into university, with experts predicting a record rise in the number of applicants going through the clearing system. Applications to university have already increased by nine per cent this year.
According to figures released today by the Joint Council for Qualifications,25.9 per cent of A-level papers were awarded an A grade this summer, compared to 25.3 per cent 12 months earlier — and just 12 per cent in 1990.
(Daily Telegraph, 14th August 2008)
The NUMGENcorpus contains 14 articles reporting this story, mostly from UK news-papers; in total, it has nearly 100 articles covering ten stories. The numerical facts found in the corpus include cardinalities (e.g., “300,000 students”) and measures (“28 years”) as well as proportions, but the project focused on proportions as a convenient subset.
Elsewhere we have shown that proportions tend to be expressed differently at dif-ferent locations within a document (Williams and Power 2009). The phrases “more than a quarter” and “25.9 percent” in the example extract provide a convenient illustration of the nature of these differences. First, there is an obvious disparity inprecision. Next, the phrases differ inmathematical form(fraction vs. percentage); we have argued that this distinction is conceptual as well as notational, because fractions are accessible to a wider readership than percentages—as testified by the levels at which they are introduced in the UK mathematics curriculum (Qualification and Curriculum Authority 1999). Finally, one of the phrases contains not only a quantity (“a quarter”) but a modifier (“more than”); such modifiers have been calledhedges(Lakoff 1973; Crystal 1988), and they serve (among other things) to indicate the arithmetical relationship between the quantity that follows and the actual value (0.259>1/4). Our corpus study showed that fractions and round numbers tend to occur in the opening of a document, whereas subsequent references to the same fact are more likely to use precise percentages.
These differences in precision and formality raise two questions, one concerning motivation (why do speakers/writers approximate?), the other concerning technique (how do they approximate?). On the first point, various motives have been proposed. Speakers might aim at conceptual simplicity (Krifka 2007)—for example, because round numbers are easier to remember and calculate with; or they might wish for various rea-sons to avoid commitment (van Deemter 2009). Also, as implied by Grice’s (1975) qual-ity and quantqual-ity maxims, the benefits of precision need to be balanced against the costs; this trade-off has been discussed within the framework of optimality theory (Dekker
and van Rooy 2000; Krifka 2002; Blutner and Zeevat 2011). Little attention has been paid, however, to the second question—regarding thetechniqueof approximation—despite its intrinsic interest and its practical importance in applications of NLG.
Our aim in this article is to explain formally how speakers/writers are able to produce numerical expressions with varying degrees of precision and formality. We propose a two-stage generation process, the first stage producing a language-neutral semantic form such as>1/4, the second stage realizing this semantic form in English or some other natural language (e.g., “over a quarter”, “more than 1/4”). Our model considers the first stage only, and aims to generate the set of alternative semantic forms underlying acceptable numerical expressions. Choosing the most appropriate alternative from this set would depend on the pragmatic context; here, for generality, the model identifies a number of criteria (roundness, accuracy, etc.) but leaves open how they should be weighted (or otherwise combined).4
The structure of the article is as follows. In the next section we review previ-ous linguistic and philosophical work on numerical expressions and approximation. Section 3 adapts some important insights from this literature to propose a new formal model for planning the semantic forms of proportion expressions; we then describe an implementation of this model in Section 4, followed by an empirical evaluation in Section 5. Section 6 discusses the outcome of the evaluation, and concludes.
2. Previous Work
2.1 Linguistic Background
Mathematically, a proportion is the cardinality of a set divided by the cardinality of a superset. IfSis a set, its cardinalityCS is defined as the number of elements thatS contains; thus ifSSis a superset ofS(meaning that every element inSis also inSS), then CS/CSSis a proportion. From this it follows that a proportion must lie between 0.0 and 1.0, because it will have its minimum value whenSis empty, and its maximum value whenSis identical toSS. Typically,SandSScan be identified by descriptions, withS distinguished by an extra attribute. Thus in our A-level example,SSis the set of A-level papers marked in 2008, andSis the subset of these papers that received an A grade. To calculate the proportion 25.9%, somebody or something (probably a computer program) must have counted the total number of papers, then counted those distinguished by an A-grade, then divided the latter number by the former.
Syntactically, proportion expressions usually occur as pre-modifiers in noun phrases, in constructions of the formP of NswhereNis a noun. Both mentions of the A-grade proportion in our sample text fit this pattern:
More than a quarter of papers were marked A
25.9 per cent of A-level papers were awarded an A grade this summer
In general, such expressions comprise a numerical value, optionally preceded by a hedge. It is important to note that the numerical value in the expression may differ from the actual value of the proportion, just as a place can be described with reference to a convenient (but different) landmark (e.g., “beyond the church”). For this reason we
will introduce the termgiven valuefor the numerical value found in the quantifying expression. To understand the expression, a reader must infer the relationship between the given value (call itVG) and the actual value (VA). One important clue is provided by the hedge; thus in “more than a quarter” the hedge “more than” indicates thatVA>VG whereVG=1/4. Another clue, it has been argued, is provided by the given value itself, because round numbers are likely to be interpreted as approximations (Krifka 2002). Thus in “a quarter of papers were marked A” the given value is a simple fraction, suggesting that VG has been selected by the writer as a round number conveniently nearVA, and that the relationship is accordinglyVA≈VG.
The termhedgewas introduced by Lakoff (1973) and subsequently applied to nu-merical descriptions by Dubois (1987), who studied imprecision in oral scientific presen-tations and listed some common numerical hedges (e.g., “about”, “almost”, “nearly”, “of the order of”, “a little over”); Crystal (1988) added a few more. Because Crystal applied the term to any expression indicating imprecision or uncertainty, he included some terms like “maybe”, “usually”, “probably”, which are not relevant here. However, restricting the field to numerical hedges, all Dubois’s examples concern the relationship between given value and actual value, and in particular VA≈VG. In the NUMGEN corpus, the most common hedge was “more than” (expressing VA>VG), followed by “about” (VA≈VG), “under” (VA<VG), “almost”, and “nearly”.5 In marking up the corpus, the modifier “exactly” was also counted as a hedge, even though its purpose is to confirm rather than to disclaim a precise commitment, since in common with the other hedges it indicates a relationship between a given and an actual value (VA=VG). We have discussed informally the possible forms and meanings of hedges; what of the given value itself? From preliminary analysis of the NUMGEN corpus, three basic forms for proportion values were identified, and used subsequently for mark-up: fractions, percentages, and ratios.Fractionsalmost invariably had simple denominators (2, 3 or 4) and were expressed in words rather than digits (e.g., “two-thirds” rather than “2/3”).Percentages were by contrast expressed almost always in digits—“25 percent” (or “25%”) rather than “twenty-five percent”; the numerical part was often a decimal, usually with just one digit after the point.Ratioswere sometimes used as an alternative to fractions (e.g., “one in four students obtained an A grade”), but with more freedom in choosing denominators, which were sometimes large or non-round numbers (“roughly one in 17 Britons”); because they were relatively rare, they are not included in the model presented here.6
Stepping back, one could ask whether these are merely distinctions in surface form, because the underlying quantities are always expressible as rational numbers (i.e., Num/Den where numerator Numand denominator Den are both integers). We have several reasons for treating mathematical form as a deeper conceptual distinc-tion, however.7Firstly, as we will show later, fractions and percentages typically have denominators from different sets—low integers for fractions, powers of ten and related
5 Note that the hedges “almost” and “nearly” do not mean the same as “less than”, because they can also be used whenVA>VG(e.g., “the temperature fell to nearly zero”). However, it has been pointed out to us that they do not mean the same as “about” (i.e.,VA≈VG) either; rather, they imply thatVA approachesVGfrom a direction indicated by the context, which might be either from above or below (e.g., “fell”, “rose”)—a more subtle relation that we have not attempted to cover in the present article. 6 Note that byratiohere we refer not to the abstract mathematical operator, but to linguistic realizations
like “NinM”, “Nout ofM”, “Nof anyM”, whereNandMare integers.
integers for percentages. They also represent distinguishable levels of numerical compe-tence, as evidenced by the UK mathematics curriculum (Qualification and Curriculum Authority 1999) in which percentages are introduced later than fractions and depend conceptually upon them. Finally, judgments of roundness can only be made relative to a given mathematical form: thus in fractions 1/3 is rounder than 3/10, whereas in percentages 33.33% is less round than 30%. This means that any program planning to describe a proportionVAby relating it to a round numberVGwill have to take account of mathematical form in selectingVG.
2.2 Roundness
It is a matter of common observation that some numbers are perceived as rounder than others, and hence more likely to be employed in approximations. You might approximate 0.259 by saying “about a quarter”, but you would never approximate 0.25 by saying “about 25.9 percent.” But what exactly is meant byroundness? Linguists and psychologists have approached this question in various ways.
In Hurford’s bookThe Linguistic Theory of Numerals (Hurford 1975), numbers are distinguished according to the roles they can play in verbal numerals. A few privileged numbers can serve as multiplicands: In English and most European numeral systems these would include 100, 1000, 1000000, and also perhaps 10 if we take account of word morphology (i.e., if we think of “forty” as meaning 4×10). An important (although less exalted) set can be named by forming a product with one of the multiplicands (e.g., “twenty”, “two hundred”). Finally, at the bottom of the heap, we find the numbers typically named as the sum of a product and another (smaller) number: thus “sixty five” is the sum of 60 and 5, or “three hundred sixty five” is 300+65.
An alternative three-tier classification has been proposed by Pollmann and Jansen (1996), on the basis of empirical evidence including number frequencies, currency sys-tems, and approximations of the form “30 or 35 people.” At the top level of roundness are “favorite numbers,” defined thus:
In any numeration system in baseN, there is a set of favourite numbers comprising (a) any integer power of the base, and (b) half, double, and half of half of any integer power of the base.
(Pollmann and Jansen 1996, page 225)
With a numerical system based on 10, this definition yields the setF(10) defined as follows:
F(10)={f|f=10n∗K}whereKis 1, 2, 1/2 or 1/4, andnis any integer.
Note that this definition allowsn to take negative values, or zero; hence 0.05 is also classified as a favorite number because it can be formed byf =10−1×1/2.
they also arrived at a wider group of round numbers (termed “sequences”), formed by multiplying any favorite number F by a low integer M with values in the range M=1. . .20: This set would include for example 5, 10, 15, . . . 95, 100, which are multiples M*Fof the favorite number 5.
Another approach to roundness is to think of measurements as taken from scales of different granularity, as suggested for example by Krifka (2007). A scale is defined as a set of evenly spaced points, so that consecutive points are always separated by a unit distance d—it is equivalent, in other words, to Pollmann and Jansen’s concept of “sequence.” However, scales can be organized into systems of varying granularity, so that for example in the metric system for measuring length we have meters, decimeters, centimeters, millimeters, and so forth, with granularity increasing tenfold from each scale to the next. Less obviously, we can think of the minutes in an hour as belonging to the following four scales, in which the units are respectively one hour, half an hour, a quarter of an hour, and five minutes (example from Krifka 2007):
0---60---...--120 0---30---60---90----...--120 0---15---30---45---60---75---90----...--120 0-5-10-15-20-25-30-35-40-45-50-55-60-65-70-75-80-85-90-95-...--120
The roundness of a number, relative to a scale system, can then be equated with the coarsest-grained scale to which it belongs (i.e., the earliest scale, if they are arranged in order of increasing granularity). Thus in this scale system 45 is rounder than 40, although in most systems (e.g., metric distance) 40 would be rounder than 45.
3. Formal Model for Proportions
We have reviewed some insights from the literature on hedging, mathematical form, and roundness; we now aim to draw these together into a formal model that can be implemented and evaluated.
To specify a given valueVGwe must choose (a) a system, (b) a scale from the system, and (c) a point from the scale—the points on a scaleSN being represented by integers from 0 toN.
This formalization of the given value has the advantage of distinguishing not only degrees of roundness, but also different mathematical forms, which can be equated with scale systems. Thus the system including [S10,S100,S1000] corresponds to the mathemati-cal formpercentages, whereas simple fractions use instead a system with very low values ofN, including [S2,S3,S4]. Equating roundness with theNvalue of the scale, it follows that simple fractions are rounder than percentages, and that within any scale system, earlier scales are rounder than later ones. For instance, within the percentage system, 40% would be considered rounder than 45%, because it first appears on theS10 scale whereas 45% first appears onS100.
Conceptualized in this way, the semantic form of a proportion expression is the result of four choices, each from a finite domain of options.8
r
Choose an arithmetical relation betweenVAandVG(e.g., from the set{=,≈,>,<}).r
Choose a scale system for expressingVG(e.g., either fractions or percentages).r
Choose a scale from this system.r
Choose a point from this scale.Thus to obtain the semantic form for “over a quarter,” starting fromVA=0.259, we would choose (1) the relation>, (2) the scale system [S2,S3,S4,. . .] (fractions), (3) the scaleS4, and (4) the point 1. Alternatively, to obtain the semantic form for “about 26 per-cent,” the choices would be (1) the relation≈, (2) the scale system [S10,S100,S1000,. . .] (percentages), (3) the scaleS100, and (4) the point 26.
3.1 Scale Systems
We have described the outline of a model for planning proportion expressions; to im-plement this model in an actual generator, we need to make specific assumptions about the scale systems to be employed. We have suggested earlier that there are two major scale systems for proportions, corresponding to fractions and percentages, the former based on very low values ofN(e.g., [S2,S3,S4]), the latter based on powers of ten. As a preliminary test of this idea, we have taken allVGvalues for fractions and percentages in the NUMGENcorpus, and re-expressed them as rational numbers of the formNum/Den, reduced to their minimal terms so that numeratorNumand denominatorDenhave no common factor, and counted the frequencies of all denominators.9The results (Table 1) show a clear difference in the two distributions, with fractions having denominators in the range 2–4 (apart from a couple of outliers), and percentages spread more widely, with peaks in powers of 10 or their multiples.
8 Note that in a constraint-based model these choices are not sequentially ordered, so we are not, for instance, implying that the arithmetical relation should be chosen first.
Table 1
Denominators for fractions and percentages in NUMGENcorpus. Frequencies
Denominator Fractions Percentages
1 0 13
2 33 16
3 29 0
4 18 11
5 0 12
10 0 24
14 2 0
20 0 13
25 0 35
40 0 4
50 0 21
100 0 54
Other 0 139
Total 82 324
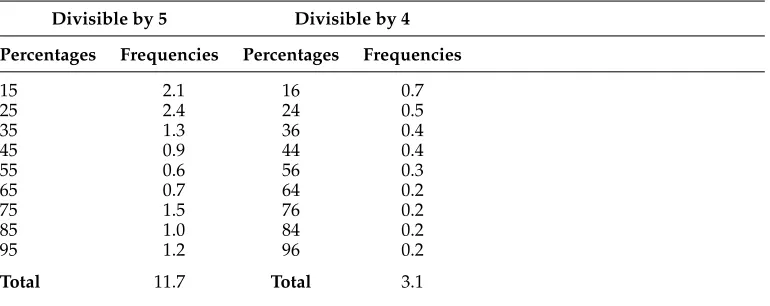
These data support an initial calibration of the model with separate scale systems for fractions and percentages, the system for fractions being simply [S2,S3,S4]. For percentages, we need to decide (a) how far to extend the granularity (e.g., whether to includeS10000,S100000, etc.), and (b) which intermediate scales to include (e.g., whether to include S20, which would cover percentages divisible by 5, such as 5% and 15%). For practical convenience in presenting and testing the model, we have decided to limit granularity to S1000, so that we cover, for instance, 25.9% but not 25.95%. Regarding intermediate scales, Table 1 provides support forS20but even stronger support forS25, which would yield percentages like 16% divisible by 4 rather than 5. This result could also be due to bias in our (fairly small) corpus, however; searching for phrases of the form “X percent” in the Google Labs Ngram Viewer10 showed a clear preponderance of percentages divisible by 5 compared with neighbors divisible by 4 (Table 2). We therefore begin by limiting the scale system for percentages to [S10,S20,S100,S1000]11— that is, powers of ten up to 1,000 with a single intermediate scale for percentages divisible by 5.
3.2 Imposing Constraints
Having specified two scale systems and a set of arithmetical relations (=,≈,>,<), we can generate a large (but finite) set of semantic forms, most of which will of course be unsuitable for describing any particular input proportion such as 0.259. To narrow these down, we need to impose constraints which can be separated into three categories: (1) Is the description true? (2) Is the description competent? (3) Is the description appropriate, given the context and the speaker’s goals?
10 The search was performed in July 2011 athttp://ngrams.googlelabs.com/.
Table 2
Hits on Google Labs Ngram Viewer (millions) for percentages divisible by 5, and close neighbors divisible by 4. The data were obtained by searching for bigrams such as “15 percent” in the Google English Books corpus for the years 1800–2000.
Divisible by 5 Divisible by 4
Percentages Frequencies Percentages Frequencies
15 2.1 16 0.7
25 2.4 24 0.5
35 1.3 36 0.4
45 0.9 44 0.4
55 0.6 56 0.3
65 0.7 64 0.2
75 1.5 76 0.2
85 1.0 84 0.2
95 1.2 96 0.2
Total 11.7 Total 3.1
To obtain a true description, the generator must obviously ensure that the relation-ship asserted between VA and VG actually holds. Thus for VA=0.259, the solution VA>26/100 (choosing the 26th point along the S100 scale from the percentage scale system, with the relation>) should be rejected as untrue, because the actual value 0.259 is less than the given value 26/100, not greater.
Having overcome the hurdle of truth, a candidate solution can be checked for what we have called “competence.” By this we mean that a solution should be excluded if another solution is superiorin all contexts. Consider, for example, the solutionVA<4/10 (again for the inputVA=0.259), in whichVGis represented by the fourth point along theS10percentage scale. As a method for approximating 0.259 we would argue that this is incompetent, because using the same arithmetical relation<and the same scaleS10, a closer approximation could have been obtained by choosing the third point instead of the fourth. Of course the generator could get even closer by choosing, for instance, VA<26/100, butVA<3/10 has the potential benefit of using a rounder scale, so both are competent.
Finally, from the set of true and competent solutions, the generator needs to select the semantic form that is most appropriate pragmatically. Here many factors come into play, some of which have been mentioned previously (e.g., technical sophistication of the reader/hearer, ease of comprehension, utilities of different levels of precision, eval-uation of the proportion as higher or lower than expected). We have not included such factors in the model described and evaluated in this article, but it is worth commenting briefly on how this could be done, through optimization methods typical of constraint-based applications.
using the arithmetical relation <should be penalized; where small differences in the actual value have important practical consequences, accuracy should receive a higher weighting than roundness; and so forth.
4. Implementation of the Generator
The input to the generator is a proportion, specified as a real number between 0.0 and 1.0 correct to three places of decimals; the output is a set of alternative semantic forms describing the proportion, where each semantic form is constructed by making four choices from finite domains: (1) a scale system, (2) a scale from this system, (3) a point from this scale, and (4) an arithmetical relation. To implement a generator of this kind, it is convenient to formulate the task as a constraint satisfaction problem, which is characterized by the following components (van Hentenryck 1989):
r
A set of variablesV1. . .Vnr
For each variableVia finite domainDiof possible valuesr
A set of constraints on the values of the variablesA solution assigns to each variable Vi a specific value from its domain Di, while respecting all constraints. In implementations using Constraint Logic Programming (CLP), programs typically have a three-part structure: first, the domains of the variables are initialized; secondly, constraints over the variables are imposed; finally, values for the variables are chosen—a process sometimes called “labeling.” The labeling stage introduces backtracking points whenever a variable can take one of several values, so that multiple solutions can be generated if desired (and if they exist). However, by using the constraints before labeling in order to reduce the domains of the vari-ables, CLP can achieve substantial efficiency gains over algorithms that rely on generate-and-test, and has been used successfully for a variety of NLP tasks (Koller and Niehren 2000).
4.1 Assigning Domains to Solution Variables
Any solution is defined by four variables which we will callSystem,Scale,Point, and Re-lation. For two of these variables, domains can be assigned during initialization:System must belong to {Fraction, Percentage} and Relationto{=,≈,>,<}. For the other vari-ables, the domain can be assigned only during the search phase, because it depends on the values of other variables. For instance, the domain ofScalecan be set to{S2,S3,S4} as soon asSystemreceives the valueFraction, or alternatively to{S10,S20,S100,S1000}if System receives instead the valuePercentage. Similarly, the domain ofPoint can be set only when a value ofScalehas been chosen—in general, ifScalehas the valueSN,Point should have the domain 0. . .N.
4.2 Constraints
subsequent list). The first two (Scale Domain, Point Domain) perform the conditional domain assignments just described, thus ensuring that solutions lie on the scales that we have prescribed. The third (Correct Description) is concerned with correctness, and the final two (Minimal Distance, Extreme Point) with competence.
1. Scale Domain: The scale must belong to the selected scale system. For
instance, ifSystem=Fraction, the domain ofScaleis{S2,S3,S4}.
2. Point Domain: The point chosen as given value must belong to the
selected scale. For instance, ifScaleisS4, the domain ofPointis 0..4.
3. Correct Description: The relation must be adapted to the given value so
that the proportion is described correctly. For instance, ifVAis 0.259 and VG(i.e.,Point/Scale) is 1/4, thenRelationmust be one of{≈,>}.
4. Minimal Distance: For a given relation and scale, the point selected as
given value should be as close as possible to the actual value of the proportion. For instance, ifVAis 0.259,Relationis>, andScaleisS4,Point must be 1, not 0.
5. Extreme Point: If extreme points (equivalent to 0.0 and 1.0) are used
as given values, the relation should not be either>or<(i.e., when approximating one should avoid expressions like “more than 0%” and “less than 100%”).
Whereas the first three constraints are straightforward and obviously necessary, Mini-mal Distance and Extreme Point make more interesting claims that require discussion and empirical testing.
4.2.1 Minimal Distance.The assumption here is that when making an approximation, the generator should make the best possible use of the chosen scale, by considering only points that are adjacent to the actual value.12This means, for instance, that ifV
A= 0.259 andScale=S10, the only points that should be considered are 2 and 3. Which of these is chosen will depend on the relation: for≈it will be 3 (which is closer); for<and>the choice will depend on correct description. Note that we have not excluded>2 on the grounds that<3 is closer, because there might be pragmatic reasons for preferring one relation to the other.13
4.2.2 Extreme Point.This constraint prohibits the use of the relations>and<in associa-tion with given values at the extreme points of the scale (e.g., 0/10 and 10/10 ifScale= 10); such combinations are not found in the NUMGENcorpus and it is hard to imagine contexts when they would be appropriate as approximations.14
12 Note that we are assuming that the purpose of the given value is to approximate the actual value. The minimal distance constraint would not apply when the given value had a special practical significance: For instance, in a country where a referendum was valid only with turnout exceeding 55%, a journalist might report “Turnout was more than 55%” when the actual value was 93%.
13 Intuitively, “more than 20%” seems to emphasize how high the proportion is compared with what was desired or expected, and “less than 30%” how low.
4.3 Preferences
The constraints just described yield multiple solutions for any given input value; to complete the model, we need to consider contextual reasons why speakers/writers might prefer some solutions to others. Regarding for example the System variable, we have already pointed out some reasons why writers might prefer fractions to per-centages (or vice versa), including location within the document, and the educational level of the reader. Similarly, with regard toRelation, considerations of emphasis might favor > over < (or vice versa), as in the sentence “More than a quarter of papers were marked A. . . ” in our initial example, which focuses attention on how easy the A-level examinations have become. For present purposes, nothing can be said about these choices except that they depend on contextual features outside the scope of our current model. However, regarding the choice ofScale, we can filter out some solutions on the assumption that speakers/writers apply a trade-off between roundness and accuracy. That is, we can show thathoweverthese two factors are weighted (provided that they are not judged irrelevant or even undesirable), some solutions will be inferior to others and can therefore be discarded. This is done by the following rule:
Roundness Preference
If two solutions have the same values forSystemandRelation, and different values for
Scale, then the solution with the largerScalevalue should be discarded unless it has
higher accuracy.
A similar rule could be formulated for solutions along the same scale with different accuracies, but in our implementation this case is already covered by the Minimal Distance constraint.
One advantage of the Roundness Preference rule is that it avoids duplicate solutions in which the values forPoint/Scaleare arithmetically equivalent, such as 5/10 and 10/20 (values forSystemandRelationbeing the same). According to Krifka’s Round Number Round Interpretation principle, readers of a phrase like “about 50%” will apply an interpretation bias favoring coarse-grained representations (i.e., scales with a relatively lowN-value), and writers will take this bias into account. We can therefore prefer 5/10 to 10/20, 50/100, and any other equivalent given value with Scaleexceeding 10, and filter out these dispreferred duplicates.15
In our implementation, filtering through the Roundness Preference is appliedafter labeling, because it relies on comparing each candidate solution with the other can-didates. In general this kind of procedure can lead to computational inefficiency; in planning descriptions of proportions, however, the number of candidates should not be large enough for this to be a problem, given that most combinations will already have been eliminated by the constraints applied before labeling.16
15 Note incidentally that this principle has empirical consequences, because differentScalevalues imply different degrees of approximation. Thus if “more than 50 percent” means “>5/10,” the implied range of the proportion (applying the Minimal Distance Constraint) is from 50.1% to 59.9%, whereas if it means “>10/20” the implied range is from 50.1% to 54.9%.
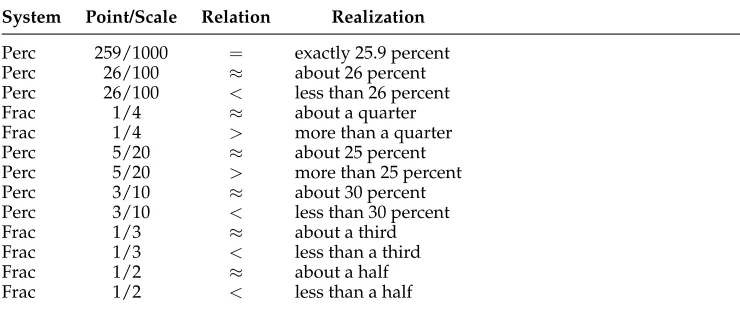
Table 3
Solutions generated forVA= 0.259.
System Point/Scale Relation Realization
Perc 259/1000 = exactly 25.9 percent
Perc 26/100 ≈ about 26 percent
Perc 26/100 < less than 26 percent
Frac 1/4 ≈ about a quarter
Frac 1/4 > more than a quarter
Perc 5/20 ≈ about 25 percent
Perc 5/20 > more than 25 percent
Perc 3/10 ≈ about 30 percent
Perc 3/10 < less than 30 percent
Frac 1/3 ≈ about a third
Frac 1/3 < less than a third
Frac 1/2 ≈ about a half
Frac 1/2 < less than a half
4.4 Example of Output
Table 3 gives a full listing of output for our original A-level example (VA=0.259), with solutions ordered by accuracy.17 For convenience, the table includes a possible verbalization of each semantic form.
5. Evaluation
Overall, we would like the generator to satisfy two requirements: First, it should allow all the good solutions; second, it should exclude the bad ones. This assumes (a) that we can measure “goodness,” and (b) that we can draw a line separating wheat from chaff. Theoretically these are difficult tasks to achieve, because we are dealing with dimensions of judgment that are continuous and partly subjective, but this should not stop us from looking for practical evaluation criteria which can support rough assessments and comparisons of different algorithms.
To evaluate a proposed linguistic solution, the two criteria in common use are the judgments of native speakers, and frequency in a corpus. Using the former method, we could ask people to judge whether the 13 plans proposed previously for describing 0.259 are all appropriate (to some context), and whether there are other acceptable solutions that have been omitted. Using the latter method, we could collect from a corpus all phrases describing a given proportion (say 0.259), identify the plans behind them, and find out whether (i) the solutions actually found in the corpus are all generated by our model, and (ii) solutions absent from the corpus are not generated.
We would argue, however, that theoverallperformance of the program is actually not the most instructive aspect to evaluate. Any reasonably complex system is based on a number of methods and assumptions, some of which might be correct and some
incorrect; separate evaluations of these components should provide more useful evi-dence on how the model can be improved. We have therefore designed the empirical study so that as well as assessing overall coverage and quality, it allows us to evaluate the Minimal Distance and Extreme Point Constraints, the Roundness Preference, and the suggested scale systems for fractions and percentages.
5.1 Method
The model was evaluated through two surveys in which participants were asked to fill in gaps in sentences describing proportions, with reference to data from which the actual value VA could be easily computed. The surveys were presented on-line using SurveyMonkey18 through a link sent to two computational linguistics mailing lists (SIGGEN and SIGDIAL). Survey 1, completed by 50 participants, tested the predictions of the model concerning given (VG) values for percentages. Survey 2, completed by 62 participants,19 investigated given (V
G) values forfractions, and their relationship to the decision whether to use a fraction or a percentage; it also included four questions testing the Extreme Point constraint. The content of all questions was adapted from newspaper articles in the NUMGENcorpus. In detail, the composition of the surveys was as follows:
A. Eight questions where subjects were asked to provide the given number (VG) in a sentence that already contained a hedge, with reference to data determining an actual value (VA). The context of theVGresponse was varied systematically to cover the three approximation relations (≈,<,>) with actual values at different distances from a convenient round number. [Survey 1]
B. Ten questions where subjects were asked to complete a sentence by providing a fraction/percentage (possibly including a hedge). The data were varied so that the actual value was sometimes close to a convenient VGvalue from the fraction scale system [S2,S3,S4] (i.e., halves, thirds, quarters), and sometimes close toVGvalues on other scales (e.g., fifths, sixths, tenths). [Survey 2]
C. Four questions where subjects were asked to choose a hedge for a sentence that already contained a given (VG) number, in each case either 0% or 100%. Their purpose was to test the Extreme Point constraint on the choice of relation. [Survey 2]
Examples of each kind of question are shown in Figure 1. The instructions in both surveys were as follows, with the italicized paragraph occurring only in Survey 2.
This survey will take about 5 minutes to complete. Its purpose is to investigate how people choose numerical descriptions. It is not a test where answers are either right or wrong.
18http://www.surveymonkey.com/.
19 In fact, 65 people completed Survey 2, but three were eliminated, one for responding at random, and two for giving responses that were not proportions. Our policy was to eliminate participants only whenall
Figure 1
Snapshots of questions from the surveys, illustrating the three question types.
Imagine that you are the subeditor of a newspaper. You have been asked to complete an article which has some gaps where data were not yet available to the original author.
You are given the incomplete sentence, and the data which it should describe. Your task is to choose a suitable expression to complete the sentence, leaving the rest of the wording unchanged (even if you disagree with it).
Each expression should use either a fraction or a percentage, and may also include modifying words like “over”, “about” (e.g., “55 percent”, “over a half”).
The data are fictional, but assume they are correct. We are interested in your choice of numerical expression, not in the validity of the data.
Schematically, each question presented the raw data of a proportion in the formCS/CSS (cardinality of set divided by cardinality of superset)—for instance,712 out of 1,000 UK teenagers—so that the actual valueVAcould be calculated. The values ofCSSwere chosen so that this calculation would be relatively simple (1,000).20
The whole design is shown in Table 4, where the questions are numbered in order of presentation, and the gaps to be filled by the subjects are shown by question marks. In Survey 1, all participants viewed questions A1–A8 in the same order on separate
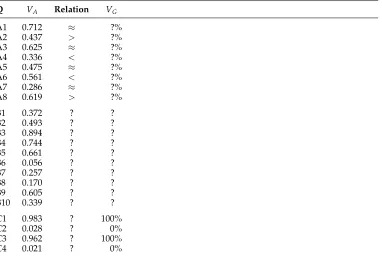
Table 4
Design of the surveys. Questions A1–A8 were presented in Survey 1, and questions B1–B10 and C1–C4 in Survey 2.VAis the actual value, derived from data supplied in the question;VGis the given value; the Relation holds betweenVAandVG. Responses required from subjects are shown by “?”.
Q VA Relation VG
A1 0.712 ≈ ?%
A2 0.437 > ?%
A3 0.625 ≈ ?%
A4 0.336 < ?%
A5 0.475 ≈ ?%
A6 0.561 < ?%
A7 0.286 ≈ ?%
A8 0.619 > ?%
B1 0.372 ? ?
B2 0.493 ? ?
B3 0.894 ? ?
B4 0.744 ? ?
B5 0.661 ? ?
B6 0.056 ? ?
B7 0.257 ? ?
B8 0.170 ? ?
B9 0.605 ? ?
B10 0.339 ? ?
C1 0.983 ? 100%
C2 0.028 ? 0%
C3 0.962 ? 100%
C4 0.021 ? 0%
pages.21 In Survey 2, similarly, questions B1–B10 were presented on separate pages, followed by questions C1–C4 presented on a single page (see Figure 1).22
5.2 Results
Before presenting the results schematically, we will look in detail at the responses actually typed for the question A1 (top of Figure 1). Subjects were asked to complete the sentence About [. . . ] percent of UK teenagers under 16 have used sunbeds during the last yeargiven the data 712/1,000, equivalent toVA=0.712. Reproduced as strings, the following responses were received (some more than once):
70, 71, 71.2, 70%, seventy, 75, 20, 15, 2
As can be seen, the same answer was sometimes given in different forms (70, sev-enty, 70%); in collating the results, these were all normalized to 70. Occasional bizarre
21 Questions A1–A8 were ordered so thatRelationvalues varied from one question to the next and were evenly distributed.
22 To check that there were no effects of question order, questions B1–B10 were presented to half the subjects in one order, and to the other half in the reverse order. Because no differences were
Table 5
Results for questions A1–A8 (50 participants).VAis the actual value indicated by the question data; R is the arithmetical relation implied by the hedge in the question text. Response frequencies forVG(given value) are shown in parentheses, or unspecified if the response occurred only once.
Q R VA Responses (frequencies)
A1 ≈ 0.712 70 (33), 71 (8), 71.2 (5), 75, 20, 15, 2 A2 > 0.437 40 (26), 43 (21), 30 (2), 45
A3 ≈ 0.625 60 (19), 62 (17), 63 (10), 62.5 (2), 30, 20 A4 < 0.336 35 (30), 34 (17), 50, 40, 1
A5 ≈ 0.475 50 (17), 48 (12), 47 (12), 45 (5), 47.5 (2), 46, 25 A6 < 0.561 60 (27), 57 (17), 56 (3), 55 (2), 30
A7 ≈ 0.286 30 (28), 29 (15), 28 (4), 25, 28.6, 1 A8 > 0.619 60 (38), 61 (9), 62 (2), 50
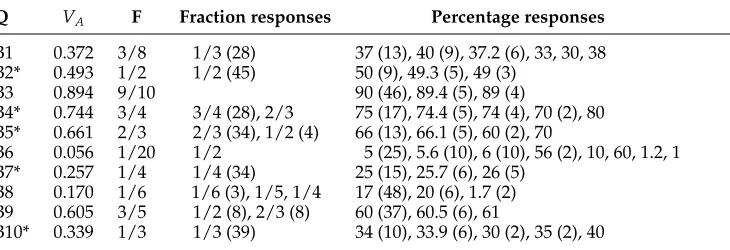
Table 6
Results for questions B1–B10 (62 participants). Questions marked with an asterisk were predicted to favor fractions because their actual values are close to fractions from scales 2–4; nearest fractions are shown in column F. Response frequencies are shown in parentheses, or unspecified if the response occurred only once.
Q VA F Fraction responses Percentage responses
B1 0.372 3/8 1/3 (28) 37 (13), 40 (9), 37.2 (6), 33, 30, 38 B2* 0.493 1/2 1/2 (45) 50 (9), 49.3 (5), 49 (3)
B3 0.894 9/10 90 (46), 89.4 (5), 89 (4)
B4* 0.744 3/4 3/4 (28), 2/3 75 (17), 74.4 (5), 74 (4), 70 (2), 80 B5* 0.661 2/3 2/3 (34), 1/2 (4) 66 (13), 66.1 (5), 60 (2), 70
B6 0.056 1/20 1/2 5 (25), 5.6 (10), 6 (10), 56 (2), 10, 60, 1.2, 1 B7* 0.257 1/4 1/4 (34) 25 (15), 25.7 (6), 26 (5)
B8 0.170 1/6 1/6 (3), 1/5, 1/4 17 (48), 20 (6), 1.7 (2) B9 0.605 3/5 1/2 (8), 2/3 (8) 60 (37), 60.5 (6), 61
B10* 0.339 1/3 1/3 (39) 34 (10), 33.9 (6), 30 (2), 35 (2), 40
responses (20, 15, 2) were not excluded. Collating in this way, and ordering by frequency, the results for the first eight questions were as shown in Table 5.
For questions B1–B10, we were interested in whether subjects would choose a fraction or a percentage, and whether fractions would conform to the proposed scale system (favoring denominators in the range 2–4). Responses such as “a quarter”, “two thirds”, “1/4”, “2/3”, were classified as fractions; responses like “one out of four”, “2 of every 3” were instead classified as ratios. For each actual value, a convenient fraction was located within a distance of 0.01 on the proportion scale: for instance, 0.257 is just 0.007 above 1/4, and 0.372 just 0.003 below 3/8. Five of these fractions lay within the proposed scale system (denominators 2–4) and five lay outside (denominators 5, 6, 8, 10, 20); questions in the former category are marked by an asterisk in Table 6.
For questions C1–C4, subjects had to choose from the four hedging optionsabout, less than,more than, andapproximately.23The purpose of these questions was to test the
[image:17.486.57.422.315.440.2]Table 7
Results for questions C1–C4 (62 participants). Response frequencies are shown in parentheses. For these questions, actual and given values (VA,VG) were specified in the question, and participants were asked to choose the hedge—and thus, implicitly, the arithmetical relation.
Q VA VG Responses (frequencies)
[image:18.486.50.439.258.364.2]C1 0.983 100% about (25), approximately (31), less than (6) C2 0.028 0% about (30), approximately (19), more than (13) C3 0.962 100% about (29) approximately (23), less than (10) C4 0.021 0% about (28), approximately (27), more than (8)
Table 8
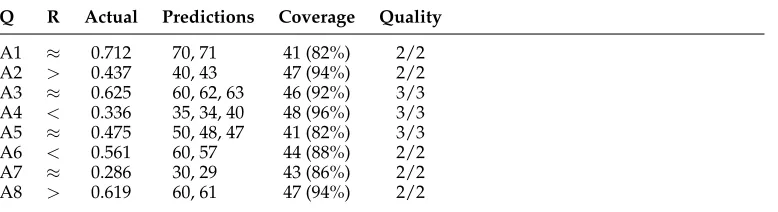
Predictions for questions A1–A8. Coverage reports the number of responses conforming to the predictions. Quality reports the number of predicted solutions that were produced by at least one subject.
Q R Actual Predictions Coverage Quality
A1 ≈ 0.712 70, 71 41 (82%) 2/2
A2 > 0.437 40, 43 47 (94%) 2/2 A3 ≈ 0.625 60, 62, 63 46 (92%) 3/3 A4 < 0.336 35, 34, 40 48 (96%) 3/3 A5 ≈ 0.475 50, 48, 47 41 (82%) 3/3 A6 < 0.561 60, 57 44 (88%) 2/2
A7 ≈ 0.286 30, 29 43 (86%) 2/2
A8 > 0.619 60, 61 47 (94%) 2/2
Extreme Point constraint—our hypothesis was that when constrained to use the extreme points 0% or 100% as given values, people would avoid the relations<and>. Two other hedges were employed so that on a random response the frequencies would be equally divided, with half favoring either<or>. Results for these questions are presented in Table 7, which shows that the hedges “less than” and “more than” (corresponding to<
and>) were strongly dispreferred for extreme given values.24
5.3 Analysis of Issues
5.3.1 Overall Performance.Comparing the solutions generated by the program with those produced by human authors (including participants in our survey), we can ask (a) how many solutions produced by humans were generated by the program, and (b) how many solutions generated by the program were produced by humans—thus addressing the competing criteria ofcoverageandquality. A model that generates many solutions will increase coverage at the expense of quality, because it accepts some solutions that competent authors would never produce.
Considering coverage first, the results predicted for questions A1–A8 are shown in Table 8; comparing these with the actual results in Table 5, we observe that participants chose one of the predicted given values in 357 out of 400 responses, giving an overall
coverage rate of about 90%. Turning to quality, the final column of Table 8 shows that all of the predicted solutions occurred at least once in a sample of 50 responses, giving a quality rate of 100%. This confirms that the fairly high coverage rate was not achieved by the artifice of generating an overlarge set of predicted solutions.
For questions B1–B10 (Survey 2), considering only responses that were fractions or percentages, we obtained 576/588 responses conforming to the predicted given values (98% coverage), and 49 out of 76 predicted given values used at least once (64% quality). Here the quality rate is lower because our model generates some very rough approxima-tions using fracapproxima-tions (e.g.,<1/2 for actual values like 0.257 and 0.170)—responses that would only occur in contexts where roundness overwhelmingly dominates precision.
5.3.2 Fraction and Percentage Scales. Responses to questions B1–B10 supported our as-sumption that fractions are normally drawn from a scale system with denominators in the range 2–4. This is shown (a) by the preponderance of fractions using these scales, and (b) by the tendency of subjects to prefer percentages when the closest fraction used another scale (e.g., fifths or tenths).
Out of 235 fraction responses overall, only 5 denominators were used, covering the range 2–6, with frequencies as follows: halves 58 (24.7%), thirds 110 (46.8%), quarters 63 (26.8%), fifths 1 (0.4%), and sixths 3 (1.3%). Thus overall, 98.3% of fraction responses used the proposed scales. Strikingly, none of the subjects chose three-fifths as a given number for 0.605 (question B9), where the 16 fraction responses divided equally be-tween half and two-thirds. Similarly, no subjects chose nine-tenths forVA= 0.894 (ques-tion B3), for which the overwhelming preference was 90%, and there were no frac(ques-tion responses at all. The data thus supported a clear division into fraction and percentage scale systems, with most subjects staying within a fraction system with scales limited to the range 2–4.
Regarding the decision whether to use a fraction or a percentage, the actual values were chosen so that five were close to convenient fractions in the range 2–4, and five were not (see Table 6). For the former group, fractions outnumbered percentages by 185 to 114; for the latter group, percentages outnumbered fractions by 237 to 50—a clear crossover (on a 2× 2 association test,χ2 = 120.5, df = 2, p <0.00001). Another way of showing this result is to correlate fraction frequencies with the distance between the actual value and the nearest fraction with a denominator in the range 2–4: As this difference increases, fraction frequencies decline, so that we obtain a strong negative correlation (product-moment correlation r=−0.9, df = 8, p<0.01).
5.3.3 Minimal Distance.The Minimal Distance constraint relates the choice of the given value VG to the choices made for the relation and the scale. It states thatVG should be chosen from the scale so as to minimize the distance from the actual value VA, while obtaining a true description. Applied for example to question A1, for which the relation is≈andVA=0.712, the only point along theS10scale satisfying the constraint will be VG=7/10, yielding a distance from VA of 0.012 (compared with a distance of 0.088 when VG=8/10, the nearest rival). For the other scales, the nearest points are respectively, 14/20, 71/100, and 712/1,000, with the result that there are only two predictedVGvalues, 7/10 and 71/100 (realized as 70% and 71%): 14/20 is a duplicate of 7/10 removed by the Roundness Preference, and 712/1,000 is inconsistent with the relation≈because it is exactly equal toVA.
violation that occurred more than once was “about 28 percent” as an approximation of 0.286. For questions B1–B10 we counted only five violations (1%) compared with 583 respecting the constraint (99%). Four of these violations were obvious arithmetical mistakes (e.g., 56% as a realization of 0.056); the other was the response 33% as an approximation for 0.372, suggesting an attempt to realize the underlying form 1/3 as a percentage.25
5.3.4 Extreme Point.The Extreme Point constraint states that the relations<and>will be avoided with given values at the extremes of the scale (VG=0%, 100%). To test this claim, the survey contained four questions (C1–C4) in which subjects had to choose a hedge to accompany an extreme value of VG. For instance in question C1, withVA= 0.983, the sentence presented wasA survey has found that [. . . ] 100 percent of people believe they are smarter than average, and subjects had to choose from the hedgesabout, less than, more than, approximately in order to fill the gap. The arithmetically correct answers to this question are<100 (represented by “less than”) and≈100 (represented by “about” and “approximately”); most subjects, however, respected the Extreme Point constraint by opting for the latter, with only 6/62 choosing “less than.” Overall, 211/248 responses to questions C1–C4 respected the constraint (85%), with 37 violations (15%).
5.3.5 Roundness Preference.Two questions in Survey 1 were included specifically to test the Roundness Preference; both employed the relation≈in combination with an actual value exactly midway between two round numbers, one on the scaleS10and the other on the scaleS20. The prediction was that subjects would favor theVGvalue taken from the coarser-grained scale (S10). Results were as follows:
r
For question A3 (≈,VA=0.625), 19 subjects chose “about 60 percent” and no subjects chose “about 65 percent.”r
For question A5 (≈,VA=0.475), 17 subjects chose “about 50 percent” and 5 chose “about 45 percent.”The overall count was therefore 36 to 5 in favor of the Roundness Preference (p<
0.00001, binomial test), but there was at least a hint of some other factor intruding, with over 10% of responses going the other way.
6. Conclusion
We have proposed and tested a theoretical model for planning expressions that describe proportions, with varying degrees of formality and precision. Our central idea is that such expressions describe an arithmetical relationship between an actual valueVAand a given value VG, where the relation belongs to the set {=,≈,>,<} and the given value is a point from a scale belonging to a scale system. We use the concept of scale system in order to distinguish the two commonestmathematical formsfor representing proportions—fractions and percentages. In everyday usage, fractions are conceptually
25 The use of 33% as an approximation suggests an alternative way of setting up the model using a single scale system [S2,S3,S4,S10,S20,S100,S1000], and treating the choice between fraction and percentage
as a subsequent step influenced but not determined by the scale value. This approach receives some support from the peaks in Table 2 for 25% and 75%, which would correspond to points along theS4scale.
simpler because they have low-valued scales (usually in the region 2–4), whereas per-centages use higher-valued scales based on powers of ten; both scales, however, could be extended to finer granularities, for instance, to meet the requirements of specialized domains. Scales for proportions are characterized by theirSNnumbers: lowerSNvalues represent coarser granularities and are associated intuitively with rounder given values. The model provides a convenient formalization of the notions of mathematical form and roundness, and a framework for investigating the detailed structure of scale systems and the constraints and preferences that inform the planning process.
In evaluating the model, we found that most given values produced by partici-pants in our survey were predicted by the model, with an overall coverage over 90%; quality was also high (i.e., most generated solutions were employed at least once by participants). These results support our assumptions about the composition of the scale systems for fractions ([S2,S3, S4]) and percentages ([S10, S20, S100, S1000, . . . ]), which determine the range of generated given values. Regarding the other assumptions of the model, we found overwhelming evidence for a Minimal Distance constraint, which requires speakers/writers to choose (for a specified scale and relation) the nearest point to the actual value that yields a true description, and strong evidence for an Extreme Point constraint, which disallows approximations in which the relations>or<are used in combination with extreme points of a scale (e.g., with the percentages 0% or 100%). We also found clear evidence for a Roundness Preference which, all other things being equal, favors solutions using coarser-grained scales within the selected system.
We hope that with some calibration of the details, our model can provide a reliable set of plans for describing any proportion, although when incorporated into an NLG application it would obviously have to be complemented by a module for selecting the best solution for a given pragmatic context. Despite not covering this problem in the model, we have given examples of how pragmatic considerations might affect each component of a solution (scale system, given value, arithmetical relation), thus providing a framework for investigating such questions systematically.
Acknowledgments
NUMGENwas funded by the Economic and Social Research Council under Grant Ref. RES-000-22-2760. We are grateful to our colleagues and reviewers for helpful comments and suggestions.
References
Blutner, Reinhard and Henk Zeevat. 2004.
Optimality Theory and Pragmatics. Palgrave
MacMillan, Houndmills, Basingstoke, Hampshire. Mouton de Gruyter, Berlin. Crystal, David. 1988. On keeping one’s
hedges in order.English Today, 15:46–47. Dekker, P. and R. van Rooy. 2000.
Bi-directional optimality theory: An application of game theory.Journal of
Semantics, 17:217–242.
Dubois, B. L. 1987. Something of the order of around forty to forty-four.Language
in Society, 16(4):527–541.
Grice, H. P. 1975. Logic and conversation. In P. Cole and J. L. Morgan, editors,Syntax
and Semantics: Vol. 3: Speech Acts. Academic
Press, San Diego, CA, pages 41–58. Hallett, Catalina, Donia Scott, and Richard
Power. 2007. Composing queries through conceptual authoring.Computational
Linguistics, 33(1):105–133.
Hurford, J. R. 1975.The Linguistic Theory of
Numerals. Cambridge University Press,
Cambridge.
Jansen, C. J. M. and M. M. W. Pollmann. 2001. On round numbers: Pragmatic aspects of numerical expressions.Journal
of Quantitative Linguistics, 8(3):187–201.
Koller, Alexander and Joachim Niehren. 2000. Constraint programming in computational linguistics. InProceedings of 8th CSLI Workshop on Logic, Language
and Communication, pages 95–122, Stanford
University.
D. Restle and D. Zaefferer, editors, Sounds and Systems: Studies in Structure and Change: A Festschrift for Theo
Vennemann (Trends in Linguistics 141).
Mouton de Gruyter, Berlin, pages 439–458. Krifka, Manfred. 2007. Approximate
interpretation of number words: A case for strategic communication. In G. Bouma, I. Kr¨amer, and J. Zwarts, editors,Cognitive Foundations of
Interpretation. Koninklijke Nederlandse
Akademie van Wetenschapen, Amsterdam, pages 111–126.
Lakoff, George. 1973. Hedges: A study in meaning criteria and the logic of fuzzy concepts.Journal of Philosophical Logic, 2(4):458–508.
Pollmann, M. M. W. and C. J. M. Jansen. 1996. The language user as an arithmetician.Cognition, 59:219–237. Qualification and Curriculum Authority.
1999. Mathematics: the National
Curriculum for England. Department for Education and Employment, London. Reiter, Ehud. 1994. Has a consensus NL
architecture appeared, and is it
psychologically plausible? InProceedings of the 7th International Workshop on Natural
Language Generation, pages 163–170,
Kennebunkport, ME.
Reiter, Ehud, Somayajulu Sripada, Jim Hunter, Jin Yu, and Ian Davy. 2005. Choosing words in computer-generated weather forecasts.Artificial Intelligence, 167(1-2):137–169.
van Deemter, Kees. 2009. What game theory can do for NLG: the case of vague language. InProceedings of the 12th European Workshop on Natural
Language Generation, pages 154–161,
Athens.
van Hentenryck, P. 1989.Constraint
Satisfaction in Logic Programming.
MIT Press, Cambridge, MA. Williams, Sandra and Richard Power.
2009. Precision and mathematical form in first and subsequent mentions of numerical facts and their relation to document structure. InProceedings of the 12th European Workshop on Natural
Language Generation, pages 118–121,