Generating Approximate Geographic Descriptions
Ross Turner, Yaji Sripada and Ehud Reiter
Dept of Computing Science, University of Aberdeen, UK
{r.turner,yaji.sripada,e.reiter}@abdn.ac.uk
Abstract
Georeferenced data sets are often large and complex. Natural Language Generation (NLG) systems are beginning to emerge that generate texts from such data. One of the challenges these systems face is the gener-ation of geographic descriptions referring to the location of events or patterns in the data. Based on our studies in the domain of me-teorology we present a two staged approach to generating geographic descriptions. The first stage involves using domain knowledge based on the task context to select a frame of reference, and the second involves using constraints imposed by the end user to select values within a frame of reference. Because geographic concepts are inherently vague our approach does not guarantee a distinguish-ing description. Our evaluation studies show that NLG systems, because they can analyse input data exhaustively, can produce more fine-grained geographic descriptions that are more useful to end users than those generated by human experts.
1 Introduction
Disciplines such as environmental studies, geography, geology, planning and business marketing make exten-sive use of Geographical Information Systems (GIS); however, despite an explosion of available mapping software, GIS remains a specialist tool with special-ist skills required to analyse and understand the infor-mation presented using map displays. Complement-ing such displays with textual summaries therefore pro-vides an immediate niche for NLG systems.
Recently, research into NLG systems that gener-ate text from georeferenced data has begun to emerge (Dale et al., 2005; Turner et al., 2006; Turner et al., 2008b; Thomas and Sripada, 2008). These systems are required to textually describe the geographic distribu-tion of domain variables such as road surface temper-ature and unemployment rates. For example, descrip-tions such as ’road surface temperatures will fall below zero in some places in the southwest’ and ’unemploy-ment is highest in the rural areas’ need to be generated
by these systems. One of the main challenges such sys-tems face is the generation of geographic descriptions such as ’in some places in the southwest’ and ’in the rural areas’. Such a task is challenging for a number of reasons:
• many geographic concepts are inherently vague (see for example (Varzi, 2001) for a discussion on this topic);
• often the underlying data sets contain little explicit geographic information for a generation system to make use of (Turner et al., 2008b);
• as input to a generation system, georeferenced data is often complex, constraints imposed on the output text (such as length) may make the tradi-tional approach to the Referring Expression Gen-eration (REG) problem in NLG of finding a dis-tinguishing description implausible (Turner et al., 2008b).
This paper looks at the problem in the context of work the authors have carried out on summarising geo-referenced data sets in the meteorology domain. The main feature of our approach is that geographic de-scriptions perform the dual function of referring to a specific geographic locations unambiguously (tradi-tional function of REG) and also communicate the re-lationship between the domain information and the ge-ography of the region (novel function of geographic de-scriptions).
We present a two staged approach to generating ge-ographic descriptions that involve regions. The first stage involves using domain knowledge (meteorolog-ical knowledge in our case) to select a frame of ref-erence and the second involves using constraints im-posed by the end user to select values within a frame of reference. While generating geographic descriptions it is not always possible to produce a distinguishing description because of the inherent vagueness in ge-ographic concepts. Therefore, in our case we aim to produce a distinguishing description wherever possi-ble, but more often allow non-distinguishing descrip-tions in the output text, which approximate the location of the event being described as accurately as possible.
descrip-tions from knowledge acquisition (KA) studies we have carried out are discussed in§3. Taking these observa-tions into account, in§4 we describe how this problem is approached using examples from RoadSafe (Turner et al., 2008b), which generates spatial references to events in georeferenced data in terms of regions that approximate their location. It pays particular attention to the use of different perspectives to describe the same situation and how factors that affect what makes a good reference in this domain are taken into account by the system. In§5 we present a qualitative discussion of as-pects of geographic description from the evaluations of RoadSafe that were carried out, and how this relates to future possible work on this topic.
2 Background
Much work on generation of spatial descriptions has concentrated on smaller scale spaces that are imme-diately perceivable. For example, spatial descriptions have been studied from the perspective of robot com-munication (Kelleher and Kruijff, 2006), 3D anima-tion (Towns et al., 1998) and basic visual scenes (Vi-ethen and Dale, 2008; Ebert et al., 1996). In a more geographical context route description generation sys-tems such as (Dale et al., 2005) and (Moulin and Ket-tani, 1999) have had wide appeal to NLG researchers. (Varges, 2005) also generate landmark based spatial de-scriptions using maps from the map task dialogue cor-pus.
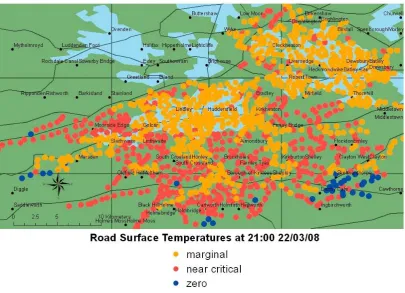
RoadSafe is an NLG system that has been opera-tionally deployed at Aerospace and Marine Interna-tional (AMI) to produce weather forecast texts for win-ter road maintenance. It generates forecast texts de-scribing various weather conditions on a road network as shown in Figure 1.
The input to the system is a data set consisting of numerical weather predictions (NWP) calculated over a large set of point locations across a road network. An example static snapshot of the input to RoadSafe for one parameter is shown in Figure 2. The complete in-put is a series of such snapshots for a number of param-eters (see (Turner et al., 2008b) for details).
In applications such as RoadSafe, the same geo-graphical situation can be expressed in a variety of dif-ferent ways dependent upon the perspective employed, henceforth termed as a frame of reference. Space (ge-ographic or otherwise) is inherently tied to a frame of reference that provides a framework for assigning dif-ferent values to difdif-ferent locations in space. For ex-ample, locations on Earth’s surface can be specified by latitude and longitude which provide an absolute frame of reference for geographic space. Cardinal directions such as{North, East, West and South}provide an alter-native frame of reference for geographic space. As was noted in (Turner et al., 2008b), characterising the data in terms of frames of reference is important because often the only geographic information input data con-tains are coordinates (latitude and longitude), while the
Overview: Road surface temperatures will fall below zero on all routes during the late evening until around midnight.
Wind (mph): NE 15-25 gusts 50-55 this afternoon in most places, backing NNW and easing 10-20 tomorrow morning, gusts 30-35 during this evening until tomorrow morning in areas above 200M.
Weather: Snow will affect all routes at first, clearing at times then turning moderate during tonight and the early morning in all areas, and persisting until end of period. Ice will affect all routes from the late evening until early morn-ing. Hoar frost will affect some southwestern and central routes by early morning. Road surface temperatures will fall slowly during the evening and tonight, reaching zero in some far southern and southwestern places by 21:00. Fog will af-fect some northeastern and southwestern routes dur-ing tonight and the early morndur-ing, turndur-ing freezdur-ing in some places above 400M.
Figure 1: RoadSafe forecast text showing geographic descriptions underlined
output texts are required to employ a wider choice of frames of reference such as altitude, direction, coastal proximity and population. In RoadSafe the frames of reference employed are always absolute according to Levinson’s terminology (Levinson, 2003).
Because the geographic descriptions in RoadSafe do not fit the traditional formulation of the REG problem as finding the most distinguishing description, the most pressing question to address is what makes an adequate reference strategy in this case? This is of course a dif-ficult question and is reliant to a large extent on the communication goal of the system. This paper looks into this problem in the context of the RoadSafe appli-cation, that uses a simple spatial sublanguage to gener-ate the types of descriptions required in this application domain.
3 Observations on geographic
Figure 2: Input data for ‘reaching zero in some far southern and southwestern places’ in Figure 1
generates road ice forecasts based on complex data. Small corpora consisting of forecast texts and their un-derlying NWP data were collected in both application domains. Using techniques described in (Reiter et al., 2005) these corpora have been analysed to understand the experts’ strategies to describe georeferenced data.
The major finding from our studies is the fact that experts tailor their geographic descriptions to the task context. Not only does the geographic knowledge of the end user have to be taken into account in their de-scriptions, but also how the geography of the region causes events and patterns in the data. The latter con-sideration has a large affect on the frame of reference experts employ to describe particular geographic situ-ations. §3.1 looks at these observations from the point of view of end users of weather forecasts, while§3.2 looks at the descriptive strategies of experts.
3.1 End users’ geographic knowledge
It is a well known and accepted fact that geographic knowledge varies greatly between individuals. To il-lustrate this point 24 students of a further education college in Scotland were asked a geography question, without reference to a map. Which of four major place names in Scotland (Ayr, Glasgow, Isle of Arran and Stirling) did they consider to be in the south west of the country? The responses showed a great variation in the subjects’ geographic knowledge. Half of all
sub-jects considered Glasgow and Ayr to be in the south west, one third considered Stirling to be in the south west and most surprisingly only four considered this to be true of the Isle of Arran. The results of this study are surprising because Stirling is the least south west-erly place in the list while Isle of Arran is the most south westerly. This study actually agrees well with the studies in psychology on variation in individuals’ mental representation of their geographic environment (Tversky, 1993).
Contrast this with the detailed knowledge of a road engineer who the RoadSafe texts are intended for. Road engineers rely upon a large amount of local geographic knowledge and experience when treating roads. In-deed, their spatial mental models are specified at a much finer detail. For example, they get to know where frost hollows tend to form and also come to learn of particular unexpected black spots, such as where garages allow hose water to cover part of a road during winter. This is an important point to be taken into ac-count when communicating georeferenced data as geo-graphic descriptions should be sensitive to that knowl-edge because it dictates how accurately they will be in-terpreted by the end user.
described geographically. Analysis of a small pollen forecast corpus (Turner et al., 2006) revealed that fore-cast texts, contain a rich variety of spatial descrip-tions for a location despite the data containing only six data points for the whole of Scotland. In general, the same region could be referred to by its proper name e.g. Sutherland and Caithness, by its relation to a well known geographical landmark e.g. North of the Great Glen, or simply by its geographical location on the map e.g. the far North and Northwest. In other words, ex-perts characterise the limited geographic information contained within the data according to the task context. As the consumers of such forecasts are the general pub-lic, there is a greater onus on the expert to make the texts more interesting, unlike more restricted domains such as marine (see (Reiter et al., 2005)) or road ice forecasts that require consistent terminology.
3.2 Experts’ descriptive strategy
Work in psychology has suggested that meteorologists use a dynamic mental model to arrive at an inference to predict and explain weather conditions (Trafton, 2007). Vital to this process is also their ability to take into account how the geography of a region influences the general weather conditions. Understanding the weath-ers interaction with the terrain enables them to make reliable meteorological inferences particularly when a certain pattern in the data may appear random. It is often unfeasible for a human forecaster to spend large amounts of time inspecting every data point in a de-tailed visual display. Using experience and expertise a forecaster can use her mental model to ‘play out dif-ferent hypothetical situations’ (Trafton, 2007, p.2) and thus arrive at a plausible explanation for an apparently random weather pattern. Consider the following exam-ple description of a weather event by an expert taken from our road ice corpus:
• ‘exposed locations may have gales at times.’ This is a good example of a forecaster using her me-teorological expertise to make an inference about a ran-dom weather pattern. Clearly there is no way from inspection of a map one can ascertain with certainty where the exposed locations are in a region. How-ever, an expert’s knowledge of how the referent entity (the wind parameter) is affected by geographical fea-tures allow her to make such an inference. These prag-matic factors play a large part in determining an experts descriptive strategy, where certain frames of reference may be considered more appropriate to describe certain weather events (Turner et al., 2008a). This comes from weather forecasters’ explicit knowledge of spatial de-pendence (the fact that observations points in georefer-enced data at nearby locations are related, and the val-ues of their non-spatial attributes will be influenced by certain geographical features). This is one of the most important and widely understood fact about spatial data from an analysis point of view, and one of the main rea-sons that it requires special treatment in comparison to
other types of non-spatial data. This fact is most clearly outlined by an observation made in (Tobler, 1970, p.3) that‘everything is related to everything else, but near things are more related than distant things’. This is commonly known as the first law of geography and still resonates strongly today amongst geographers (Miller, 2004). The implication of Tobler’s first law (TFL) is that samples in spatial data are not independent, and observations located at nearby locations are more likely to be similar. Recasting this into meteorological terms, exposed locations are more likely to be windier and el-evated areas colder for example.
In fact, an analogy can be drawn between how me-teorologists consider perspectives in their descriptive strategy and the preferred attribute list in the semi-nal work on REG by (Dale and Reiter, 1995). In their specification of an algorithm for generating refer-ring expressions content selection is performed through the iteration over a pre-determined and task specific list of attributes. In our context, preferred attributes are replaced by preferred frames of reference. This means describing georeferenced data requires situa-tional knowledge of when to apply a particular frame of reference given a particular geographic distribution to describe.
The most striking observation about the expert strat-egy is that the geographic descriptions in the corpora are approximations of the input (Turner et al., 2008a). The input is highly overspecified with 1000s of points for a small forecast region, sampled at sub hourly inter-vals during a forecast period. Meteorologists use vague descriptions in the texts to refer to weather events such as:
• ‘in some places in the south, temperatures will drop to around zero or just above zero.’
There are a number of reasons they use this descrip-tive strategy: the forecasts are highly compressed sum-maries, as a few sentences describes megabytes of data; very specific descriptions are avoided unless the pat-tern in the data is very clear cut; experts try to avoid misinterpretation, road engineers often have detailed local geographic knowledge and experts may not be aware the more provincial terminology they use to refer to specific areas. The following section demonstrates how the problem of generating such descriptions is ad-dressed in RoadSafe.
4 Generating Approximate Geographic
Descriptions
in some places above 100M by 16:00’ above, distrac-tors can be defined as the set of points above 100M that do not satisfy the premise that temperatures will drop below zero. More succinctly, these can be defined as false positives. In fact, the problem can be formulated as a trade off between false positives and false nega-tives, where false negatives constitute points that are wrongly omitted from the description. For road grit-ting purposes, costs can be assigned to each type of error: road accidents in the case of false negatives and wasted salt in the case of false positives. As the task dictates, with the higher associated cost it is impera-tive that a referring expression eliminates all false neg-atives. Ideally a truly optimal description should then seek to minimise false positives as far as possible, thus reducing the overall cost for the reader. While reduc-ing errors descriptions should also be meteorologically correct, as discussed in the previous section. Using cer-tain frames of reference in cercer-tain contexts may result in a poor inference about a particular weather situation (Turner et al., 2008b).
Given this domain knowledge, we can formulate constraints for what makes a good approximate geo-graphic description in this task context:
1. Meteorological correctness (inferencing about causal relationships).
2. Minimise false positives.
3. Complete coverage of the event being described (no false negatives).
These constraints have been realized in a two staged approach to generating geographic descriptions. The first stage involves using domain knowledge (meteo-rological knowledge in our case) to select a frame of reference, while the second accounts for end-user con-straints to select values within that frame of reference. Before we describe the individual stages, two necessary pre-processing stages for generation are described.
4.1 Geographic characterisation
As noted in§2, observations in georeferenced data of-ten contain little explicit geographic information apart from their coordinates. Geographic characterisation is responsible for assigning a set of qualitative descrip-tors to each observation based upon a set of reference frames, such that observations can be collectively dis-tinguished from each other. This provides both a cri-terion for partitioning the data, and a set of properties to generate geographic descriptions. A frame of ref-erence in this context consists of a set of descriptions based upon a common theme such as coastal proximity e.g. {inland,coastal}or population e.g. {urban,rural}. In RoadSafe four frames of reference have been imple-mented: altitude, coastal proximity, population and di-rection. Those that make use of human (population) and physical geographical features (altitude, coastal Proximity) can be represented by existing GIS data
sets; therefore, in these cases geographic characterisa-tion is simply responsible for mapping observacharacterisa-tion co-ordinates to areas of these data sets. In contrast, direc-tions are abstract and require definition. In RoadSafe, geographic characterisation maps each observation to a set of directional areas with crisp boundaries, described in the following section.
4.2 Pattern formation
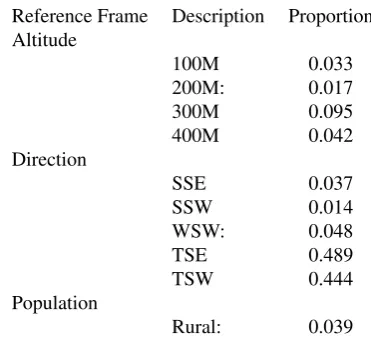
To generate descriptions, the geographic distribution of the event to be communicated has to be approxi-mated using data analysis techniques such as cluster-ing. While not new to data-to-text systems, the novel aspect here is that the data is partitioned based upon the frames of reference that make up the spatial sublan-guage of the system. This process summarises the lo-cation of the event by measuring its density within each frame of reference’s set of descriptions. An example of such a distribution is shown in Figure 3.
Reference Frame Description Proportion Altitude
100M 0.033
200M: 0.017
300M 0.095
400M 0.042
Direction
SSE 0.037
SSW 0.014
WSW: 0.048
TSE 0.489
TSW 0.444
Population
[image:5.595.320.506.303.476.2]Rural: 0.039
Figure 3: Density of zero temperatures in Figure 2
While the descriptions within each frame of refer-ence with human and geographical features are dictated by the granularity of available GIS data sets (altitude resolution for example), the boundaries of directional areas require definition. In RoadSafe, because some flexibility in the generated geographic descriptions is desirable, the system uses a four by four grid to split the domain into sixteen equally sized directional areas defined by their their latitude longitude extents. This configuration is shown below where T stands for true and C for central in this case:
TNW NNW NNE TNE
WNW CNW CNE ENE
WSW CSW CSE ESE
TSW SSW SSE TSE
con-figurations using a greater number of gradable descrip-tions are possible. These matrices are used by the mi-croplanner to choose attributes to refer to events using the direction frame of reference. One example matrix for each category of directional description are listed below. In each matrix a value of 1 indicates that the event has a non-zero density in that area.
Gradable
• Far South:
{T SW, SSW, SSE, T SE}=
0 0 0 0 0 0 0 0 0 0 0 0 1 1 1 1
Intercardinal
• South West:
{T SW, W SW, SSW, CSW}=
0 0 0 0 0 0 0 0 1 1 0 0 1 1 0 0
Cardinal
• South:
SouthEast∪SouthW est=
0 0 0 0 0 0 0 0 1 1 1 1 1 1 1 1
In what follows we describe how our two stage strat-egy is implemented in our system.
4.3 Frame of reference selection
The main content selection decision made by the doc-ument planner is the choice of which frame of refer-ence to describe a specific weather event such as wind gusts increasing or road surface temperature falling be-low zero. This decision is based upon both the location of the event as discussed previously, and situational knowledge stored in the knowledge base of the system. Frames of reference where all descriptions have non-zero densities are not considered. Situational knowl-edge consists of the probability of using each frame of reference given the context (the weather parameter to describe), and is based on corpus frequencies. Rather than simply choosing the frame of reference with the highest density, weighting each frame of reference in this way ensures meteorological correctness as far as possible.
4.4 Attribute selection
Once a frame of reference has been selected the mi-croplanner maps the descriptions to abstract syntax templates. As this is fairly trivial for most frames of
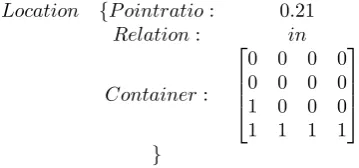
reference in RoadSafe, because they contain a limited number of descriptions, we will provide an example how this is accomplished for directional descriptions. The input to the microplanner is a structure comprised of the density of the event within the containing area plus its associated adjacency matrix as shown in Figure 4.
Location {P ointratio: 0.21
Relation: in
Container:
0 0 0 0 0 0 0 0 1 0 0 0 1 1 1 1
[image:6.595.316.496.167.251.2]}
Figure 4: REG input to describe Figure 2
The attribute selection algorithm is based upon four constraints incorporating the first two principles of the descriptive strategy outlined at the beginning of this section. They are:
1. Minimise false positives - The description de-scribing the distribution should introduce the least number of distractors. For the above example distri-bution the set{South}ensures coverage but introduces three distractors: CSW, CSE and ESE. While the set of directions{Far South, South West}only introduces one: CSW. In general, a measure of how distinguishing a descriptionxis of a distributionyis given by:
distinguishing(x, y) = |x∩y| |x|
Thus, for a distributionzand descriptionsxandy,
xis a more distinguishing description of z thany iff distinguishing(x,z)>distinguishing(y,z).
2. Coverage (no false negatives) - The descrip-tion should completely describe the distribudescrip-tion. The set of directions {Far South,South West} completely describes the above example distribution while {Far South} does not. For the set of directionsxand dis-tributiony, the predicatecovers(x, y)is true iff
|x∩y| |y| = 1
3. Brevity - The set of directions should yield the shortest description of the distribution. For the above example distribution there is only one set of direc-tions that ensures complete coverage. But when faced with a choice for example{South}and{South West, South East}brevity constraint favours{South}. In gen-eral,the setxshould be chosen overy because it is a shorter description. For the distributionz and sets of directionsx,ywith equal coverage ofz,xis a shorter description ofzthanyiff|x|<|y|.
given distribution, a description is chosen based upon a predefined preference ordering. Each type of prop-erty is assigned a score: Cardinal = 3, Intercardinal = 2 and Gradeable = 1. Therefore, the set of directions {Far South, South West}would be assigned a value of 3.
In classification terms, the first constraint can be con-sidered as precision and the second as recall. The algo-rithm firstly ranks each individual description in the set described in§4.2 according to the constraints outlined above. If a single directional term cannot be used to de-scribe the distribution it then incrementally tries to find the highest ranking combination of directions that sat-isfy the coverage constraint and do not cover the whole region; otherwise, the algorithm terminates by return-ing the empty set. So, for the example input provided at the beginning of this section it would return the ab-stract syntax template shown in Figure 4. Quantifiers are selected by applying a simple threshold to the point ratio (which is recalculated should distractors be intro-duced): some => 0, many = > 0.5, most => 0.7. This would be realised as ‘in some far southern and southwestern places’. Type: LocationSyntax Head: |in|
Object:
Head: |place|
Features: "
definite:false plural:true
#
Quantifier: |some|
Modifier:
Head: |and|
Coord1 "
Head: |southern| Modifier: |far|
#
Coord2 h
Head |southwestern| i
Figure 5: Phrase syntax for input in Figure 4
5 Evaluation and Discussion
RoadSafe has been evaluated in post-edit evaluations with meteorologists at AMI and by asking potential users to compare the quality of the summaries to corpus texts based on the same data. While evaluations have been intended to test the overall quality of the texts we have received much feedback on the geographic de-scriptions the system generates. We have also carried out some comparison of the direction descriptions to those in the corpus, by annotating the corpus descrip-tions with our adjacency matrices and running them through the system. Descriptions were compared by calculating the Jaccard coefficient between the two ma-trices. Overall the mean score was 0.53, with a fairly low perfect recall percentage of 30%. The low pre-cision score is perhaps not surprising as the descrip-tions generated by RoadSafe are crisp and the corpus descriptions are not solely based on the input data we
have available. However, the majority (67%) of par-tial alignments were the result of RoadSafe producing a subset of the human desciprition, e.g. northwest ver-sus north, which indicates the system descriptions are more fine grained. In terms of the human descriptions, what was most apparent from this evaluation is the fact that they almost exclusively used the eight major points of the compass.
In terms of feedback experts have commented that generally the location descriptions generated by the system are accurate but should be more general. Of 97 post edited texts generated by the system 20% of the geographic descriptions were edited.
Most notable was feedback from twenty one road maintenance personnel, who participated in an exper-iment asking them to compare expert written texts to RoadSafe generated texts based on the same five data sets. The details of this experiment are to be published elsewhere; however, one of the main reasons they gave for liking the style of the generated texts was because they contained more geographic descriptions than the corresponding human ones. The fact that a data-to-text system can analyse every data point is an advantage. In contrast experts have a huge amount of knowledge and experience to draw upon and this reflects in their more general and conservative approach in their geographic descriptions. Perhaps one of their biggest criticisms of the system as a whole is that it doesn’t do a good job of generating geographic descriptions that involve motion, such as ‘a band of rain works east across the area’. Indeed, this was the most edited type of gener-ated phrase during the post-edit evaluation. There has been little work to our knowledge on describing motion in the NLG literature.
There are many aspects of the generation of geo-graphic that haven’t been addressed in this paper and warrant further exploration. Particularly at the con-tent level, there is a need to consider how to account for semantic composition effects caused by overlaying frames of reference. Another question that arises is when is it best to use an intensional rather than exten-sional description. There is also the question of when to use descriptions that involve relations or gradable properties. These are all choices that a data-to-text sys-tem can make that will affect how the summary is in-terpreted.
6 Conclusions
by not only by location but also task context. An im-portant observation based on our evaluation studies is that NLG systems by virtue of their ability to analyse input data exhaustively can generate descriptions that are more useful to end users than those generated by human experts.
References
R. Dale and E. Reiter. 1995. Computational interpreta-tions of the gricean maxims in the generation of re-ferring expressions. Cognitive Science, 19:233–263.
R Dale, S Geldof, and J-P Prost. 2005. Using natu-ral language generation in automatic route descrip-tion. Journal of Research and Practice in Informa-tion Technology, 37(1):89–105.
C. Ebert, D. Glatz, M. Jansche, R. Meyer-Klabunde, and R. Porzel. 1996. From conceptualization to formulation in generating spatial descriptions. In U. Schmid, J. Krems, and F. Wysotzki, editors, Pro-ceedings of the First European Workshop on Cogni-tive Modeling, pages 235–241.
John D. Kelleher and Geert-Jan M. Kruijff. 2006. In-cremental generation of spatial referring expressions in situated dialog. InProceedings of ACL06, pages 1041–1048.
S. Levinson. 2003. Spatial language. In Nadel L., editor,Encyclopedia of Cognitive Science, volume 4, pages 131–137. Nature Publishing Group.
Harvey J. Miller. 2004. Tobler’s first law and spatial analysis.Annals of the Association of American Ge-ographers, 93(3),:574–594.
B. Moulin and D. Kettani. 1999. Route generation and description using the notions of objects influence area and spatial conceptual map. Spatial Cognition and Computation, 1:227–259.
E. Reiter, S. Sripada, J. Hunter, J. Yu, and I. Davy. 2005. Choosing words in computer-generated weather forecasts. In Artificial Intelligence, vol-ume 67, pages 137–169.
Kavita E Thomas and Somayajulu Sripada. 2008. What’s in a message? interpreting geo-referenced data for the visually-impaired. In Proceedings of INLG08.
Waldo Tobler. 1970. A computer movie simulating urban growth in the detroit region. Economic Geog-raphy, 46(2):234–240.
Stuart Towns, Charles Callaway, and James Lester. 1998. Generating coordinated natural language and 3D animations for complex spatial explanations. In Proceedings of the Fifteenth National Conference on Artificial Intelligence, pages 112–119, Madison, WI.
J. Gregory Trafton. 2007. Dynamic mental models in weather forecasting. In Proceedings of the Human Factors and Ergonomics Society 51st Annual Meet-ing, pages 311–314.
R. Turner, S. Sripada, E. Reiter, and I. Davy. 2006. Generating spatio-temporal descriptions in pollen forecasts. EACL06 Companion Volume, pages 163– 166.
R. Turner, S. Sripada, E. Reiter, and I. Davy. 2008a. Building a parallel spatio-temporal data-text cor-pus for summary generation. In Proceedings of the LREC2008 Workshop on Methodologies and Resources for Processing Spatial Language, Mar-rakech, Morocco.
R. Turner, S. Sripada, E. Reiter, and I Davy. 2008b. Using spatial reference frames to generate grounded textual summaries of georeferenced data. In Pro-ceedings of INLG08.
B. Tversky. 1993. Cognitive maps, cognitive col-lages, and spatial mental models. In A.U. Frank and I. Campari, editors,Spatial Information Theory, pages 14–24. Springer-Verlag, Berlin.
Sebastian Varges. 2005. Spatial descriptions as refer-ring expressions in the maptask domain. In ENLG-05, Aberdeen, UK.
Achille C. Varzi. 2001. Vagueness in geography. Phi-losophy & Geography, 4:1:4965.