eurostat
COMMUNITY
INPUT-OUTPUT TABLES
1970-1975
METHODOLOGY
SPECIAL SERIES
eurostat
DE EUROPÆISKE FÆLLESSKABERS STATISTISKE KONTOR STATISTISCHES AMT DER EUROPÄISCHEN GEMEINSCHAFTEN STATISTICAL OFFICE OF THE EUROPEAN COMMUNITIES OFFICE STATISTIQUE DES COMMUNAUTÉS EUROPÉENNES ISTITUTO STATISTICO DELLE COMUNITÀ EUROPEE
BUREAU VOOR DE STATISTIEK DER EUROPESE GEMEENSCHAPPEN
Luxembourg. Centre Europeen. Borte postale 1907 — Tél. 47941 Télex: Comeur Lu 3423 1049 Bruxelles. Bâtiment Berlaymont. Rue de la Loi 200 (Bureau de liaison) — Tél. 735 80 40
Denne publikation kan fås gennem de salgssteder, som er nævnt på omslagets tredje side i dette hæfte. Diese Veröffentlichung ist bei den auf der dritten Umschlagseite aufgeführten Vertriebsbüros erhältlich. This publication is obtainable from the sales agents mentioned on the inside bnck cover.
Pour obtenir cette publication, prière de s'adresser aux bureaux de vente dont les adresses sont indiquées à la troisième page de la couverture.
Per ottenere questa pubblicazione, si prega di rivolgersi agli uffici di vendita i cui indirizzi sono indicati ·. nella 3a pagina della copertina.
COMMUNITY
INPUT-OUTPUT TABLES
1970-1975 — METHODOLOGY
This publication was prepared
by MJ. Green and P. Le Grontec
CONTENTS
Introduction 5
Chapter 1 — Description of an elementary input-output table 6
(a) General principles 6 (b) The European System of Integrated Economic Accounts (ESA) and the
classifications used 7
Chapter 2 — The three series of tables published by the EUROSTAT 13
(a) The valuation of flows in the input-output tables 13
(b) The annual tables 13 (c) The five-yearly tables 13 (d) The constant price tables 14
Chapter 3 — The arrangement of the tables 15
(a) The table of intermediate consumption 15 (b) The table of final uses and total uses 15 (c) The table of primary inputs, resources and total resources 17
(d) The general structure of the tables 19
(e) Additions and comments 21
Chapter 4 — The use of the input-output tables 24
— Notation 24 — Section I — The fundamental balancing relationships 25
(a) The vertical balance 25 (b) The horizontal balance 26 (c) The use of direct and indirect coefficients in economic a n a l y s i s . . . . 26
— Section II — Examples of how input-output tables provide a framework
for the analysis of economic structure 27 (a) Primary inputs and final uses 27 (b) Imports and final uses 28 — Section III — Analysis of the effects of output price variations, and
changes in input costs 29
Annex — Correspondence between the classifications used by the Statistical Office of the European Communities to draw up input-output tables for the years 1959,
Introduction
The increasing variety and complexity of economic activity require the constant development of both economic theory and economic statistics, particularly when it is necessary to demonstrate the interdependence within an economy or between economic systems. It is impossible to obtain a clear picture of this interdependence without as exact a knowledge as possible of how important economic variables behave and what the relationships between them are.
A detailed and systematic presentation of the significant economic variables is the key to obtaining a clear picture of economic interdependence. This can be done by gathering together statistical information on production, consumption, investment, imports and exports for enterprises, households and government bodies referring to a certain period, such as a year. Input-output tables then provide a framework for assembling this detailed informa-tion in a systematic way. They also make it possible to introduce the data into the national accounts.
The first attempts to provide numerical estimates of economic interdependence were made long ago, the best known being François Quesnay's Tableau économique. However the more recent importance assumed by input-output tables is due to the work of Wassily Leontief who, some 40 years ago, established them as a normal tool for economic analysis.
The data which make up an input-output table represent flows, that is to say purchases and sales between economic agents and cover the economic activities of one year. As a large number of statistical sources are used, and as a certain amount of time is required to collect and process the data, the final tables are often not ready until four or five years after the year to which they refer and this may make them appear to be no longer of interest.
The input-output tables do, however, reveal a large number of basic economic relationships—such as the structure of production and demand—which develop gradually and more or less continuously through time. A table referring to a period four or five years before the date of completion can therefore still be extremely useful.
Because input-output tables are so widely used, the Statistical Office of the European Communities
(EUROSTAT) has published comparative tables for the original six Community countries for the years 1959 and 1965. The definitions used in the tables and the classifications employed are taken directly from the European System of Integrated Economic Accounts (ESA). The Statistical Office is now working on three series of tables for the nine Community countries using a common system of classification and common definitions.
The first is a series of annual tables starting with the year 1970. They will be available usually three to four years after the year to which they refer; the second series will be prepared every five years, that is for 1970, 1975 and so on. They will take the same general form as the annual tables but will be more detailed and will therefore take longer to produce. They will also be used in the preparation of statistical series at constant prices provided by the Statistical Office of the European Communities. Thirdly, there will be a series of constant price annual tables.
This methodology describes firstly the simplified annual tables, including those drawn up at constant prices, and secondly the more detailed five-yearly tables.1 It is divided
into three sections.
The first section deals with the basic principles involved in using input-output tables to present economic inter-dependence systematically (Chapter 1).
After this general outline, the second section (Chapters 2 and 3) gives the exact definitions and rules to be followed in the tables to ensure consistency in time and com-parability between countries. The third section gives details of some analyses for which the tables can be used (Chapter 4). There are many such analyses and they form an integral part of this methodology because they embody the principle of interdependence on which the tables are based.
CHAPTER 1
Description of an elementary inputoutput table
(a) General principles
An inputoutput table provides a clear picture of the relationships between a large range of economic variables that refer to a given year and a given economic system. In order to understand how such a table can be constructed, it is necessary to consider all the goods and services produced in, or imported into, an economic system and the use to which they are put. These goods include agricultural products, manufactured goods of all types, as well as the output from building or civil engineering activities. The services include those provided by transport, wholesale and retail trade, and the services of financial institutions. These goods and services are produced by a considerable variety of producer units, farms, factories, airports, banks and administrative bodies.
As the range of goods and services produced, imported and used in any economy is so wide, they must be clas sified according to their usage or technical specifications into sufficiently large homogeneous groups if numerical estimation of the transactions involved is to be practical. For the sake of simplicity, these groups are called groups of products.
In the same way producer units can be grouped into branches of production. If this grouping is organized in such a way that the main products of these producer units correspond to the goods or services in one of the groups of products, then the classification of branches will be coherent with the classification of products. Consequently, all the producer units in the economic system belong to a particular branch of production, each of which produces a group of related goods or services that belongs to a particular group of products. Products produced by the branches of production and imported products are intended for two distinct types of buyer. Firstly, many products are used by the branches as intermediate products or 'intermediate consumption inputs'. These goods and services arc used to make other goods and services and are thus incorporated into other products.
Secondly, some goods and services are required to meet the needs of the consumption of households or of public bodies, for investment in fixed capital goods and stocks, and the needs of nonresident agents. In all these cases, once they have been purchased, the goods and services are not subject to further processing and are not incor porated into other products during the reference period or within the economic system under consideration. These products are therefore destined for 'final uses'.
Products consumed by households represent 'consumer demand' and include for example food, clothing, durable goods, transport, insurance etc. Collective consumption covers services provided by the state, such as education and defence. Fixed capital formation and investment in stocks include the purchase of plant and machinery, vehicles, building and civil engineering work.
The purchases of an individual product that has been made or imported into the country in question can be set down without difficulty as a row of transactions. The first part of the row records the intermediate consumption of the various branches. The other entries in the row cover the purchases intended for final use.
If there are m branches of production and if
X1,...,Xm represents the amounts purchased by the
production branches, and
Xm+i,...» Xm+s the purchases for final uses,
and X the total of all these transactions, then they can be arranged as follows:
Intermediat e consumptio n Branche s
Xl .... Xm
G
.2 „
M
«2 «
- * c o E
- ^ ■ + 1 c
SÌ .2
¿¡ E O vi
Xm + 1
C o
ë Ë 2 2 O α
cd υ
•^«l + î
o S S S s: o>
O c Xm-H O α χ ω •^i»+3 en a o h X
The flows or transactions for each individual product can be readily set out in a row in this way. If the classifica tion selected covers n products, the result will be a table consisting of n rows where n is greater than or equal to m. However, given the definition of the branches and products set out above, n is equal to m in the following table.
m
branches
m branches
intermediate consumption = products supplied to the branches
Five categories of final uses
products for final use
Each column in the first part of the table shows the range of products used by each branch. The sum of the entries in any one column gives the total value of raw materials, fuels, transformed goods and services required to main-tain production in that branch.
Further costs incurred in the course of production are wages, the amount set aside to replace assets (fixed capital consumption), and taxes linked to production. The value obtained from the difference between the total costs and the price of the product on the market is the net operating surplus. These items, know as 'primary inputs' can thus be added to the preceding table.
Intermediate consumption
Sub-totals
Primary inputs
Totals
Sub-totals
IC
G,
Final use
Sub-totals
Totals
G2
The total of the entries in any one column shows how the value of the product of each branch is made up of raw materials, fuels, finished goods and services, salaries and wages, capital consumption and the net operating surplus. The row 'totals' gives the total inputs which equal the total value of the products because the net operating surplus forms the balance. The table also shows how the product is distributed according to category of use.
This flow table is an input-output table and is divided into three distinct sections:
1 — a table of intermediate consumption — products supplied by one branch and intended for the same or another branch;
2 — a table of final uses of goods and services — con-sumption, capital formation, exports;
3 — a table of primary inputs — labour income, fixed capital consumption, net operating surplus, taxes. From this table it is easy to establish a simple relationship between primary inputs and final uses.
The total production for all branches G, must equal the contribution of domestic output to total resources, i.e. total resources less imported products, that is to say G( = G2 — M where M is total imported products. If the
total of intermediate consumption is IC then it follows that
G,-IC = G2-M-IC
G¡—1C represents the total primary inputs of all branches, that is to say wages, capital consumption, taxes, net operating surplus. This amount is the total 'value added by branch'.
G2—IC represents total final uses, that is to say private or
public consumption, fixed capital or stock investments
and exports. G2—IC—M represents total final uses less
total imports.
Therefore value added, for all the branches, is equal to consumption plus investment plus exports less imports. The values Gt— IC or G2—IC—M are known as the
gross domestic product; one is calculated by adding up the total of primary inputs and the other from the sum of all final uses less imports.
This equation is basic to national income accounting.
(b) The European System
of Integrated Economic Accounts (ESA) and the classifications used
The last section introduced various general concepts which must now be clarified, in particular the term 'branch' of production.
The basic concept used for the EUROSTAT input-output tables is the unit of homogeneous production.
The distinguishing feature of the unit of homogeneous production is a unique activity which is identified by its inputs, a particular process of production and its outputs. The products which constitute the inputs and outputs are themselves distinguished not only by their physical characteristics and their degree of processing but also by the technique of production used. The inputs and outputs can be identified by reference to the classifica-tion of products (ESA §265).
77¡<? branch consists of a grouping of units of homogeneous production (ESA §268).
The set of activities covered by a branch is identified by reference to a product classification. The branch produces those goods and services specified in the classification, produces all the products specified and only these products.
The input-output tables show the technical or productive aspect of economic structure and do not attempt to describe the financial behaviour of enterprises or other bodies involved in production. In particular the main aim of the tables prepared by the EUROSTAT isto facilitate the comparison of economic structure between the Community countries. The branch of production as defined in the ESA fulfils this requirement.
The basic classification of activities used to classify units of homogeneous production is the NACE (General Industrial Classification of Economic Activities within the European Communities). It is divided into two distinct parts; the first is used for the collection of basic statistics; the second, called the NACE-CLIO, is used for the input-output tables.
The NACE-CLIO is a classification of mutually exclusive activities, each one defined by the products produced. It consists of 186 groups. Each branch of production corresponds to one or several of these groups.
Each group of the NACE-CLIO is defined:
— for services by the list in the section of the NACE concerned with the collection of basic statistics (NACE-GEN).
The content of each of these groups is set out in the provisional publication 'Classification of ESA activities and products'—Statistical Office of the European Com-munities—May 1971.
The input-output tables for 1970, 1971, 1972, 1973 and 1974 are based on a regrouping of the NACE-CLIO into 44 branches and 7 sub-branches: NACE-CLIO (R 44). 27 of the 44 branches in the NACE-CLIO (R 44) describe the production of goods:
— 1 for agriculture and fishing; — 5 for fuel and power products;
— 9 for basic materials, metal processing products and transport equipment;
— 11 for other manufacturing products (food products, textiles, paper, etc.);
— 1 for buildings and civil engineering works.
13 branches describe the production of market services:1
— 3 for repair services, trade, lodging and catering services;
— 4 for transport and communication services;
— 3 for banking, insurance and renting services;
— 3 for education, health, research and other market services.
4 branches describe the production of non-market services:1
— 1 for general administrative services of general government;
— 2 for education, research and health; — 1 for domestic services.
The input-output table also has rows for 7 sub-branches— 3 for energy, 2 for ores and ferrous metals, 2 for transport.
The list of NI M EXE products defining each NACE-CLIO group is available on request.
The list of correspondences between the NACE-CLIO (R 44) and the classifications used for the 1959 and 1965 input-output tables for the Community countries is set out in the Annex.
The following table shows how each branch of the NACE-CLIO (R 44) is broken down into groups.
For a definition of market and non-market services see the European System of Integrated Economic Accounts.
NACE-CLIO (R 44)
Regrouping of the NACE-CLIO groups into branches for
establishing the input-output tables 1970, 1971, 1972, 1973, 1974
(44 branches and 7 sub-branches)
NACE-CLIO (R 44) Branches
01
03
05 07
09
11
13
NACE-CLIO Groups
011
012 013 014 019 020 030
111 112
120
130 140
161 162 163 170
151 152
211 212
Description
Goods Agricultural, forestry and fishery products
Vegetable products from agriculture and forests Wine
Olive oil, unrefined
Animal products from agriculture and hunting Agricultural products which are exclusively imported Forestry products
Fishery products
Coal, lignite {brown coal) and briquettes Coal and coal briquettes
Lignite (brown coal) and lignite briquettes Products of coking
Crude petroleum, natural gas and petroleum products Crude petroleum, natural gas and bituminous shale Refined petroleum products
Electric power, gas, steam and water Electric power
Gas (distributed by pipes) Steam, hot water, compressed air
Water (collection, purification, distribution)
Production and processing of radioactive materials and ores Ores containing radioactive substances
Production and processing of radioactive materials
Ferrous and non-ferrous ores and metals, other than radioactive Iron ore
NACE-CLIO (R 44)
Branches NACE-CLIO Groups Description
15
17
19
21
23
25
27
221 222 223 224
231 232 233 239 241 242 243 244 245 246 247 248
252 253 255 256 257 258 259 260
311 312 313 314 315 316
321 322 323 324
325
326 327 328
330 371 372 373 374
341 342 343 344 345
346 347
351 352
Pig iron, crude steel, hot rolled and cold rolled sheets, coated metal sheets (ECSC products) Steel tubes
Extruded and drawn metal, cold-rolled products, cold-formed steel parts and sections Non-ferrous metals
Non-metallic mineral products Gravel, stone, sand and clay
Salts of potassium and of natural phosphates Rock-salt, marine salt
Other minerals, peat Bricks and pottery products Cement, lime, plaster
Building and construction materials made of concrete, cement or plaster Articles made of asbestos (except for articles made of asbestos-cement) Stones and other non-metallic mineral products
Millstones and other abrasive products Glass (plate, hollow, technical, fibre glass) Ceramic products
Chemical products
Petrochemical and carbochemical products Other basic chemical products
Paints, varnishes and printing inks
Other chemical products, mainly for industrial and agricultural purposes Pharmaceutical products
Soaps, synthetic detergents, perfumes, cosmetics and toilet preparations Other chemical products mainly for household and office use
Artificial and synthetic fibres
Metal products except machinery and transport equipment Foundry products
Metal products which are forged, stamped, embossed or cut Products of secondary processing of metals
Structural metal products Products of boilermaking
Tools and finished metal articles, except electrical equipment Agricultural and industrial machinery
Agricultural machinery and tractors
Machine tools for metal working, tools and equipment for machinery Textile machinery and accessories, sewing machines
Machinery for the food and chemical industries; bottling, packaging, wrapping and related machinery; rubber artificial plastics working machinery
Mining equipment, machinery and equipment for metallurgy, for the preparation of building materials, for building and construction, for mechanical handling and lifting
Gears and other transmission equipment
Machinery for working wood, paper, leather and footwear, laundering and dry-cleaning equipment Other machinery and mechanical equipment
Office and data processing machines; precision and optical instruments Office and data processing machines
Measuring, precision and control instruments Medico-surgical equipment, orthopaedic appliances Optical instruments and photographic equipment Clocks and watches
Electrical goods
Insulated wires and cables
Electric motors, generators, transformers, switches, etc.
Electrical equipment for industrial use, batteries and accumulators
Telecommunications equipment, meters and measuring equipment, electro-medical equipment Electronic equipment, radio and television receiving sets, sound reproducing and recording equip-ment, gramophone records and pre-recorded tapes
Electric household appliances
Electric lamps and other forms of electric lighting Motor vehicles
NACE-CLIO (R 44) Branches
29
31
33
35
37
39
41
43
45
47
49
NACE-CLIO Groups
353
361
362 363 364 365
412
413
411 414 415 416 417 418 419 420 421 422 423
424 425 426 427 428
429
431· 432· 436 438 439 453· 455 456
441 442 451*
461 462 463 464 465 466 467
471 472 473 474
481
Description
Spare parts and accessories for motor vehicles
Other transport equipment
Boats, steamers, warships, tugs, floating platforms and rigs, materials from the breaking boats
Locomotives, other railway and tramway rolling-stock, vans and wagons Cycles, motorcycles, invalid carriages
Aircraft, helicopters, hovercraft, missiles, space vehicles and other aeronautical equipment Perambulators, invalid chairs, carts, etc.
Meats, meat preparations and preserves, other products from slaughtered animals
Milk and dairy products
Other food products
Vegetable and animal oils and fats Fruit and vegetable preserves and juices
Fish preserves and other sea food for human consumption Cereals, flour and flakes
Food pastes
Starch and starch products
Bread, rusks, biscuits, cakes and pastries Sugar
Cocoa, chocolate, sweets, ice-creams Animal and poultry feedingstuffs Other food products
Beverages
Ethyl alcohol from fermented vegetable products and products based on it Champagne, sparkling wines, wine-based aperitifs
Cider, perry, mead Malt, beers, brewers' yeast Mineral waters, soft drinks
Tobacco products
Textiles and clothing
Processed textile fibres, products of spinning, thread-making, balling Woven and velvet materials
Products of the hosiery trade
Carpets, carpeting, oilcloth, linoleum and other coated fabrics Other textile products
Ready-made clothes and clothing accessories
Household linen, bedding, curtains, wall coverings and awnings, sails, flags, bags Articles of fur
Leathers, leather and skin goods, footwear
Leathers, skins, hides tanned or otherwise processed Leather and skin goods
Footwear, slippers made wholly or partly of leather
Timber, wooden products and furniture
Sawn, planed, seasoned, steamed wood
Veneered and ply wood, fibre board and particle board, improved and preserved wood Carpentry, wooden buildings, joinery, parquet flooring
Wooden containers
Wooden articles (other than furniture), sawdust and shavings
Articles of cork, straw, basketware (other than furniture), brooms, brushes Furniture of wood and cane, mattresses
Paper and printing products
Wood pulp, paper, board
Products of pulp, paper and board Products of printing
Products of publishing
Rubber and plastic products
Rubber products
NACE-CLIO (R 44) Branches
51
53
55
57
59 61
63
65
67 69
71
NACE-CLIO Groups
482 483
491 492 493 494 495
505 506 507 509
620 671 672*
610 630 640 660
710 721 722 723 724 725 730
741 742 750
761 762 763 764 771 772 773 790
811 812 813 820
Description
Re-treaded tyres Plastic products
Other manufacturing products
Precious and costume jewellery, goldsmiths' and silversmiths' products; working of precious and semi-precious stones; diamond cutting and polishing; striking of coins and medals
Musical instruments
Products for printing and developing cinematographic and photographic films Games, toys, sports goods
Fountain pens and ballpoint pens, seals, other products n.e.c. Building and construction
Construction of dwellings Non-residential buildings Civil engineering works Demolition of buildings
Market services Recovery and repair services
Scrap metals, waste paper, rags, salvage, other products from recovery and demolition Repair of motor vehicles and bicycles
Repair of footwear and leather articles, electrical household goods, watches and clocks, jewellery Wholesale and retail trade
Wholesale trade
Services of commercial intermediaries Retail trade
Lodging and catering services
Inland transport services
Railway transport services and associated services
Local transport services, including underground, railways, tramways and regular bus services Long distance road transport services for passengers
Long distance road transport services for merchandise Services of transport by pipelines
Land-borne transport services n.e.c. (funicular railways, cable cars, chair-lifts) Inland waterways services
Maritime and air transport services Maritime transport services Coastal transport services Air transport services Auxiliary transport services
Services associated with land transport other than railways Services associated with inland waterways
Services associated with maritime and coastal transport Services associated with air transport
Services of travel agencies
Services of transport intermediaries Warehouse and storage services Communication services
Services of credit and insurance institutions Services of central banking authorities Services of other monetary institutions Services of other credit institutions Services of insurance
Business services provided to enterprises
73
830 840 850
Services of financial and insurance auxiliaries; real estate; services of lawyers, accountants, tax advisers, management consultants; publicity services; computer and data processing services Services of renting of movable goods without accompanying personnel
Services of renting of immovable goods
NACE-CLIO (R 44) Branches
75
77
79
81
85
89
93
NACE-CLIO Groups
93 C 94 C
95 C
92 C 96 C 97 C 981 982 983 984
91 92 A 96 A
97 A
93 Α, Β
94 A, Β
95 A, Β
96 Β
97 Β
99
Description
Market services of education and research
Market services of education
Market services of research and development
Market services of health
Recreational and cultural services, personal services, other market services n.e.c.
Market services of refuse disposal, sanitation and cleaning
Market services of hostels, professional, economic and employers' associations Market recreational and cultural services
Laundries, dry cleaners and similar services Hairdressing and beauty salons services Photographic studios services
Other personal services n.e.c. (funeral services, matrimonial agencies, fortune telling, etc.)
Non-market services
General public services
General public services of national defence, of compulsory social security
Non-market services of refuse disposal, sanitation, cemeteries, provided by general government Non-market services of social welfare, hostels, tourist offices, employers' and professional associa tions, economic organizations provided by general government
Non-market services of recreational and cultural activities provided by general government (enter tainments, sports grounds and clubs, libraries, public archives, museums, botanical and zoological gardens)
Non-market services of education and research provided by general government and private non-profit institutions
Non-imarket services of education provided by general government and private non-profit in stitut ons
Non-market services of research and development provided by general government and private non-profit institutions
Non-market services of health provided by general government and private non-profit institutions
Domestic services and other non-market services n.e.c.
Non-market services of social welfare, hostels, tourist offices, trade unions, employers' associations, religious organizations and learned societies, political parties, consumers' and civic organizations etc., provided by private non-profit institutions
Non-market services of recreational and cultural activities (entertainments, sports grounds and clubs, libraries, public archives, museums) provided by private non-profit institutions
Domestic services
The input-output table gives, in the rows, the following sub-branches:
NACE-CLIO (R 44) Sub-branches
09.1 09.3 09.5 13.1 13.3 63.1 63.3
NACE-CLIO Groups
161,163 162 170
211,221,222,223 212,224
741,742 750
Description
Electric power, steam, hot water, compressed air Gas (distributed by pipes)
Water
CHAPTER 2
The three series of tables published by the EUROSTAT
The EUROSTAT publication programme for Community input-output tables consists of three series of tables: an annual series from 1970 onwards, five-yearly tables for 1970, 1975, etc. and annual tables at constant prices from 1971.
The annual tables are not as comprehensive as the five-yearly tables because their frequency leaves less time for preparation. The constant price tables are more difficult to draw up than the current annual tables and have been made simpler in form. However the general structure of the tables is the same in all cases, and the balances between the principal aggregates are identical. The definition and composition of each aggregate are to be found in the European System of Integrated Economic Accounts. Before analysing each series of tables, it is necessary to show how the flows or transactions set out in them are valued.
(a) The valuation of flows in the input-output tables
The flows set out in the tables can be valued in at least three ways. Firstly a flow can be measured when the relevant product leaves the producer unit or enters the country in question, that is at the point of importation— this is the approximate factor price or cif price valuation. Secondly a flow can be valued when taxes levied on the product whether domestically produced or imported have been paid—this is the 'producers' price' or 'ex-customs price' valuation. Thirdly a flow can be valued at the price paid by the purchaser which is the price paid by the final user and equals the sum of the producers' and ex-customs prices plus the cost of distribution and transport.
The approximate factor price valuation is perhaps the one best suited to the form of an input-output table. It gives the most satisfactory measure of the quantities of products consumed and ensures a homogeneous valuation along the rows of the table. If the valuation is made at producers' or ex-customs prices, each flow includes the taxes linked to the product. These taxes vary from branch to branch and thus make comparisons along the rows of a table more difficult.
The valuation at the producers' price is nevertheless useful. The difference between valuation at producers' prices and approximate factor prices gives a clear picture of the effects of indirect taxation. When input-output tables are used to analyse economic structure, the inci-dence of taxes is very important. The producers' price valuation is also the one more familiar to the producer units and statistical estimates of it are in many cases more reliable.
As a rule only products purchased for final'uses are valued at purchasers' prices. The trade and transport margins are then added to the values calculated at producers' prices. Exports are accounted for at fob prices. The advantage of this sort of valuation is that it shows the structure of final uses from the point of view of the final user and not the producer or importer. This is important for the study of consumer behaviour. The ESA (§626-§638) gives a more detailed description of these valuations.
(b) The annual tables
In the annual tables total purchases of a product are given; the purchases of products are not separated into the outputs of domestic production and imported products. In the columns total intermediate inputs are added to total primary inputs to give domestic production for a branch. In addition to the value of domestic produc-tion the value of imports of goods similar to the products of the branch in question are added to give total resources for the branch.
In the annual tables intermediate consumption is valued at producers' prices and final uses at purchasers' prices, with exports being valued at fob prices and imports at ex-customs prices.
Overall a table of this sort is said to be 'at mixed prices'. Total uses equals the addition of two sets of flows cal-culated in two different ways. The resources include an adjustment row 'trade and transport margins on final uses', which makes it possible to achieve the balance resources/uses for each branch. Along this row, the entry for each branch covers the trade and transport margins on the final uses of products in that branch, while the entire trade and transport margins on final uses are recorded as a negative entry for the branches trade and transport. Thus the total for this row is zero (ESA §638). Although the valuation system chosen for the annual tables is a compromise it does mean that most of the Community countries can prepare annual tables rela-tively quickly.
(c) The five-yearly tables
In the five-yearly tables the flows in the table for interme-diate consumption and final uses are subdivided so that purchases from domestic production and of imported products can be shown separately. The purchases of
imported products are themselves divided further accord-ing to whether they are imported from Community or non-Community countries. This means that each entry in the annual tables, excluding primary inputs, is divided into three elements, domestic production, imports from Community countries, imports from third countries.
This subdivision makes it possible to construct an input-output table for the whole Community by combining the tables for the member countries in a particular way.
The five-yearly tables are prepared following two valua-tions. For domestic production intermediate consump-tion is valued at approximate factor prices and producers' prices. Imports are valued at cif prices in the first case and ex-customs prices in the second. The transition from one valuation to another can be made via a matrix of taxes linked to production and to imports, net of subsidies. Final uses are also valued at approximate factor/cif prices and producers'/ex-customs prices.
Finally, total production is calculated at approximate factor prices and producers' prices insofar as intermediate consumption and final uses follow these valuations.
(d) The constant price tables
So far it has been assumed that the input-output tables under discussion are valued in the prices of the year to which the tables refer, that is to say at current prices. However for much analysis such a form of valuation is unsatisfactory, particularly when it is necessary to use input-output tables established for different years, to estimate changes in the volume of products purchased and sold, between one year and another.
The most straightforward way of constructing series of input-output tables that enable comparisons of volume movements to be made, is to extend the techniques used to construct the national accounts at constant or base year prices. More exactly the construction of such tables can best be done by means of the methods used to estimate the components of total gross domestic product at constant prices.
To express the uses of g.d.p. for any given year at constant or base year prices a particular base year is chosen and then for each component of total uses, either
(i) a price index for the year in question based on the chosen base year is constructed
or
(ii) an appropriate volume index is constructed.
In the first case the figures at current prices are deflated by the price indices thus giving constant or base year price figures.
In the second case base year figures are multiplied by the volume indices to give constant or base year price figures. Because of the index number problem these two approaches may not necessarily lead to the same constant price estimate of the components of total uses. However providing the year for which the estimates are made is not too far from the base year, then the difference between these two approaches should not be too great.
The construction of an input-output table at constant prices requires the extension of these techniques to all the additional flows recorded by an input-output table, that is to say, the matrix of intermediate consumption. Although such an extension offers no difficulty in prin-ciple, in practice snags may arise because of lack of information for constructing price and volume indices for each of the individual flows. Where it is not possible to calculate specific deflators then general deflators or general volume indices must be used.
Proceeding in this way an input-output table of entries at constant base year prices can be calculated covering final demand and intermediate consumption. It is clearly not straightforward, in theory or in practice, to provide a measure of all the components of value added at constant prices and so as a rule a measure of total value added at constant prices is established by difference. That is to say from total constant price output (given by the row totals of the tables, subrow domestic production) the totals of intermediate purchases at constant prices (the column totals of the matrix of intermediate consumption at constant prices) are subtracted to give the total primary inputs at constant prices.
It should be stressed once again that if a mixture of methods (i) and (ii) is used to express the flows in the table at constant prices, difficulties may arise in balancing the tables.
At present the EUROSTAT is setting up a series of constant price input-output tables for the countries of the Community for the years 1971, 1972, 1973 etc. with
1970 as the chosen base year.
Table showing valuations according to the frequency of the input-output tables
Tables
Table of intermediate consumption (T 4.1) Tabic of final uses (T 4.2)
Table of primary inputs and resources (T 4.3) Table at constants prices
Valuation
Approximate factor prices
five yearly five yearly five yearly
Producers '/ex-customs prices
annual and five yearly five yearly
annual and five yearly annual
Purchasers' prices
CHAPTER 3
The arrangement of the tables
The principles underlying the construction of the EUROSTAT input-output tables have been set out in Chapters 1 and 2. The branch and product classification used and the various types of flow evaluation have been defined; the exact form of the tables remains to be discussed.
Both annual and five-yearly tables are divided into three sections: a table of intermediate consumption, a table of primary inputs and a table of final uses. After each of these tables has been examined, the relationships between them will be set down. These relationships vary in points of detail according to the valuation of the tables and therefore according to their frequency. The chapter will conclude with a paragraph on the items in the tables which are not fully explained in the ESA.
(a) The table of intermediate consumption
The table of intermediate consumption forms the central section of the input-output table. The 44 branches of the table which follow the NACE-CLIO classification are set down in the rows and columns. This resulting double-entry table is thus a square table except to the extent that some of the rows are subdivided and correspond to the sub-branches defined on page 12.
The tables for the valuation at both approximate factor prices and producers' prices are set out as follows:
44 branches
010
930 990
01 93
each entry is subdivided into three components in the five-yearly table
Total intermediate inputs for each branch
95
Total intermediate outputs for each product
IC
According to whether the table is read by rows or by columns the flows represent intermediate outputs or
intermediate inputs. The total value of intermediate
inputs is the same as the total value of intermediate outputs and equals total intermediate consumption (IC). The intermediate consumption of resident producer units represents the value of all goods (other than fixed capital goods) and of all market services consumed during the course of the relevant period in order to produce other goods and services (ESA §320). The elements and expenditures included in intermediate consumption are defined in paragraphs 322 and 323 of the ESA; the elements excluded are defined in paragraph 324.
The subdivision of each flow according to the origin of the product purchased—whether from domestic production, from the EEC or from third countries— means that each entry is divided into three components. In addition, to provide data for the constant price input-output tables, the last column of the table 'total inter-mediate outputs for each product' is valued each year at constant prices.
(b) The table of final uses and total uses
In the table of intermediate consumption the entries in the rows provide a detailed picture of the destination of the output of each product. The same is true of the table of final uses—the entries in each row clearly set out the destination of branch output.
It is a double-entry table, and the rows correspond to the branches and sub-branches of the NACE-CLIO classification. The columns divide final uses into the following categories:
01 Final consumption of households on the economic territory
02 Collective consumption of general government
03 Collective consumption of private non-profit institutions
09 Final consumption on the economic territory (01+02 + 03)
19 Gross fixed capital formation 29 Change in stocks
41 Exports of goods and services to EEC countries 42 Exports of goods and services to third countries 49 Total exports of goods and services (41+42) 89 Final uses (09 + 19+29+49)
99 Total uses (total intermediate outputs + 89)
There are three columns for final consumption on the
economic territory. Final consumption represents the
value of the goods and services used for the direct satisfac-tion of human wants, whether individual (final consump-tion of households) or collective (collective consumpconsump-tion
of general governments and private non-profit institutions) (ESA §327).
There are two columns for gross capital formation which include respectively gross fixed capital formation and changes in stocks.
Gross fixed capital formation represents the value of durable goods intended for non-military purposes,1
each of more than about 100 units of account in value, which are required by resident producer units and are meant to be used for a period of more than one year in their processes of production, including the value of any services embodied in the fixed capital goods acquired (ESA §337).
Stocks consist of all goods (raw materials, semi-finished products, work in progress, finished products) other than fixed capital goods, held at a given moment of time by resident producer units. The input-output tables give only the change in stocks, calculated from the difference between stocks inputs and outputs during the relevant period (ESA §347).
The third category of final uses is goods and services exported ; these are set out in three columns of the table. Exports of goods include all goods (new or existing) whether charged for or free, which permanently leave the economic territory of a country for some destination in the rest of the world (ESA §356). They are valued fob (free on board) which corresponds to the market price of the goods at the frontier of the exporting country
(ESA §363). This price does not include taxes linked to production for which rebates are granted on goods exported. Exports of services include all services (transport, insurance, others) provided by resident units to non-resident units (ESA §365). They are valued in accordance with the ESA §366-372. In the table a distinction is made between exports for the EEC and exports for third countries.
The table of final uses ends with two columns of totals. The first sets down the totals for final uses, the second gives total uses—the sum of intermediate consumption and final uses.
Detailed definitions of each of the final uses are given in §327-374 of the ESA.
Final uses are valued at approximate factor prices and at producers' prices in the five-yearly tables but only at purchasers' prices in the annual tables. For the constant price tables the final consumption of households, collective consumption of general government, collective consump-tion of private non-profit instituconsump-tions, gross fixed capital formation, change in stocks and total exports of goods and services are calculated at constant prices. They are prepared annually and valued at purchasers' prices.
1 Purchases of durable goods for military purposes are considered as the intermediate consumption of general government (see ESA § 323 f)·
The table of final uses and total uses is set out as follows:
Final uses
44 branches \ ^
0
9: 0
0 990 Total
Final consumption
01 02 03 09
Capital formation
19 29
Exports
41 42 49
Final uses
89
Total uses
99
(c) The table of primary inputs, resources and total resources
The table of primary inputs and resources is, like the two preceding tables, a double-entry table. The rows set down the values of primary inputs purchased by the branches of production, the total of domestic resources and total resources (domestic resources plus imports). Each of the columns corresponds to one of the branches of NACE-CLIO (R 44). The table is set out as follows:
Code numbers of primary inputs
and resources
44 branches
Primary
inputs and resources
01. .93 99
Total
010
970, 980 or 990 Total resources
Some of the rows in the primary inputs or resources table are peculiar to the valuation chosen for the input-output table as a whole. In the same way, the relationships between the various primary inputs and the resources vary according to the valuation. In the following table, three columns, one for each valuation, show which elements are used for each valua-tion and the exact relavalua-tionships between them.
Table of primary inputs, resources and total resources
Description
Gross wages and salaries
Employers' social contributions
Net operating surplus
Net value added at factor cost
Consumption of fixed capital
Gross value added at factor cost
Taxes linked to production
Subsidies
Net taxes linked to production
Net value added at market prices
Annual table
Mixed prices
Five-yearly table
Producers' prices Ex-customs prices
Approximate factor prices
Row codes
010
020
030
070
080
090
110
120
170
180
(010 + 020 + 030)
(070 + 080)
(110-120)
(070+170)
010
020
030
070
080
090
110
120
170
180
(010 + 020 + 030)
(070 + 080)
(110-120)
(070+170)
010
020
030
070
080
090
(010 + 020 + 030)
(070 + 080)
Table of primary inputs, resources and total resources (continued)
Description
Gross value added at market prices
Net taxes linked to production on inputs used
Taxes linked to imports on inputs from EEC countries
Taxes linked to imports on inputs from third countries
Net taxes linked to production and imports, on inputs
Actual output at approximate factor prices
Actual output at producers' prices
Transfer of ordinary by-products and adjacent products at approximate factor prices
Transfer of incidental sales at approximate factor prices
Total transfers at approximate factor prices
Subsidies linked to exports
Distributed output at approximate factor prices
Distributed output at producers' prices
Imports cif of similar products from EEC countries
Imports cif of similar products from third countries
Total Imports cif of similar products
Taxes linked to imports of similar products from EEC countries
Taxes linked to imports of similar products from third countries
Total taxes linked to imports of similar products
Imports ofsimilar products from EEC countries at ex-customs prices
Imports ofsimilar products from third countries at ex-customs prices
Total imports of similar products at ex-customs prices
Trade and transport margins on final uses
Total resources at approximate factor pricesjeif prices
Total resources at producers' priceslex-customs prices
Total resources at mixed prices
Annual table
Mixed prices
Five-yearly table
Producers' prices
Ex-customs prices Approximate factor prices
Row codes
190
290
310
330
390
410
490
510
520
590
610
620
690
710
720
790
880
990
(090+170)
(total inter-mediate inputs +190)
(310+330)
(290 + 390 + 410)
(510 + 520)
(610 + 620)
(510 + 610)
(520 + 620)
(590 + 690)
(490 + 790 + 880) 190
290
310
330
390
410
490
510
520
590
610
620
690
710
720
790
980
(090+170)
(total inter-mediate inputs +190)
(310 + 330)
(290 + 390 + 410)
(510 + 520)
(610 + 620)
(510 + 610)
(520 + 620)
(590 + 690)
(490 + 790) 210
220
230
270
280
310
330
390
480
510
520
590
970
(210 + 220 + 230)
(total inter-mediate in-puts + 090 + 270)
(310 + 330)
(280 + 390)
(510 + 520)
Whatever the valuation, gross value added at factor cost is always the same. It consists of the following components:
gross wages and salaries
actual and imputed employers' contributions net operating surplus
fixed capital consumption
To obtain the gross value added at market prices: taxes linked to production must be added and subsidies must be subtracted.
Actual output at approximate factor prices consists of gross value added at factor cost, plus total intermediate inputs, plus those net taxes linked to production and imports, falling on the inputs used.
Actual output at producers' prices includes gross value added at market prices and total intermediate inputs. Detailed descriptions of the various components of actual output are set out in the ESA. Definitions for the most important components are given below.
The compensation of employees includes all payments in cash and in kind made by employers in remuneration for the work done by their employees during the relevant period (ESA §406).
These payments cover:
— gross wages and salaries (ESA §408, 409) — employers' actual social contributions (ESA §410) — imputed social contributions (ESA §411412).
The net operating surplus is the balance of the operating account of the branch. It corresponds to total property and entrepreneurial income derived from productive activity.
Fixed capital consumption is the depreciation of fixed capital during the relevant period as a result of normal wear and obsolescence, including provision for the loss of fixed capital goods as a result of accidental insurable damage (ESA §403).
Taxes linked to production and imports consists of compul sory payments which are levied by general government or by the institutions of the European Communities, on producer units in respect of the production and importation of goods and services or the use of factors of production. These taxes are a component of the producers' price or the excustoms price; producers are liable to pay them irrespectively of whether or not they operate at a profit (ESA §415420).
Subsidies are current transfers which general government, or the institutions of the European Communities, make as a matter of economic and social policy to resident units producing goods and market services with the objective of influencing their prices and/or making it possible for factors of production to receive an adequate remuneration (ESA §422427).
Before actual output can be added to imports to give total resources, adjustments must be made to give distributed
output.
For each branch, distributed output is equal to actual output plus
— transfers of ordinary by-products and adjacent products — transfers of incidental sales
and in the case of distributed output at producers' prices, — subsidies linked to exports must be added.
In the economic system as a whole, the transfers cancel one another out and the total of distributed output of goods services is equal to actual output.
These transfers are entered in such a way that the concept of branch is not changed. In some cases, it is necessary to allocate the output of a branch over several other branches. For details of the treatment of byproducts and adjacent products and incidental sales, see ESA
§610616.
Subsidies linked to exports are paid to the branch which distributes the goods and services when they are exported. It is desirable however that the value of the output of these branches be independent of such subsidies. The row in the tables for subsidies on exports sets down the necessary correction. It includes a set of negative adjust ments for the distributed outputs of the relevant branches and an offsetting positive entry in the branch for whole sale and trade services etc. The total for the row is zero. This adjustment makes it possible to calculate distributed output net of subsidies on exports.
The following components must be added to distributed output to obtain total resources:
— in the case of the valuation at approximate factor prices, total imports cif of similar products;
—■ in the case of the valuation at producers'/excustoms prices, total imports of similar products at excustoms prices.
For valuation at mixed prices, a row for the trade and transport margins on final uses must be added to balance the inputoutput table.
Imports of goods include all goods (new or existing), whether charged for or free, which permanently enter into the economic territory of the country having been consigned from the rest of the world (ESA §375). Imports of services include all services (transport, insur ance, for example) provided by nonresident units to resident units (ESA §388).
The cif price (cost, insurance, freight) is the price at which imported products are recorded in the foreign trade statistics. It includes the foreign producers' price, trade margins and the cost of insurance and transport from the place of production to the frontier of the importing country (ESA §631).
The ex-customs price of imported products is the cif price plus taxes linked to imports.
Full detail of the treatment of imported items in the national accounts as well as any conventions used are given in the ESA §375395.
(d) The general structure of the tables
basic balance between resources and uses, vary according to the valuations and therefore to the frequency of the tables.
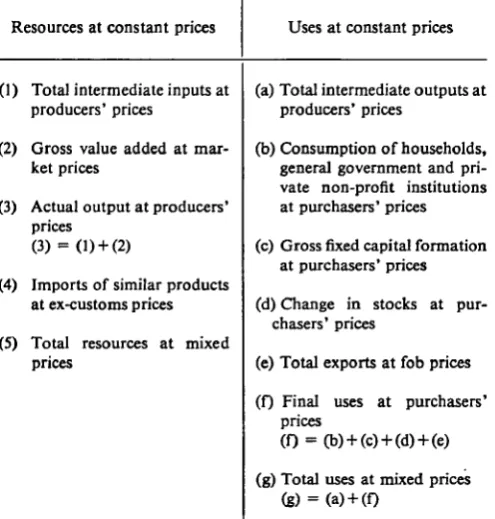
(1) The annual table at current prices
The balance between resources and uses can be set out as follows: Resources (1) (2) (3) (4) (5) (6) (7) (8)
Intermediate inputs at pro ducers' prices
Gross value added at mar ket prices
Actual output at producers' prices
(3) = (l) + (2)
Transfers
Subsidies linked to exports
Imports of similar products at ex-customs prices
Trade and transport mar gins on final uses
Total resources at mixed prices
(8) = (3)+ (4)+ (5)+ (6)+ (7)
Uses
(a) Intermediate outputs at pro ducers' prices
(b) Final consumption of house holds, general government and private non-profit insti tutions at purchasers' prices
(c) Gross fixed capital formation at purchasers' prices
(d) Change in stocks at pur chasers' prices
(e) Total exports at fob prices
(0 Final uses at purchasers' prices
(f) = (b) + (c) + (d) + (e)
(g) Total uses at mixed prices (β) = (a) + (Q
Resources at constant prices
0)
(2)
(3)
(4)
(5)
Total intermediate inputs at producers' prices
Gross value added at mar ket prices
Actual output at producers' prices
(3) = (l) + (2)
Imports of similar products at ex-customs prices
Total resources at mixed prices
Uses at constant prices
(a) Total intermediate outputs at producers' prices
(b) Consumption of households, general government and pri vate non-profit institutions at purchasers' prices
(c) Gross fixed capital formation at purchasers' prices
(d) Change in stocks at pur chasers' prices
(e) Total exports at fob prices
(0 Final uses at purchasers' prices
(f) = (b) + (c)+(d) + (e)
(g) Total uses at mixed prices (g) = (a) + (f)
As the component transfers and trade and transport margins in the current price table is not available at constant prices, it is not possible to go from total recources at constant prices (5) to actual output (3). The total intermediate inputs at producers' prices are obtained from the difference between actual output (3) and value added (2).
Clearly the tables of intermediate consumption and primary inputs and resources give the resources side of the picture whereas the tables of intermediate consump tion and final uses provide the necessary information for the uses side. Total resources at mixed prices are equal to total uses at mixed prices. To ensure this balance an adjustment row ((7) under the heading resources) is required: trade and transport margins on final uses, defined on page 13 and ESA §638.
(2) The annual table at constant prices
[image:22.595.49.299.161.444.2]The opening part of this chapter outlined the annual tables at current prices showing how the elements are valued at constant prices using 1970 as base year.
For the annual constant price table the details of the uses are complete with the exception of the intermediate transaction table for which only the totals are provided. The only primary inputs and resources provided at constant prices are the gross value added at market prices, the actual output at producers' prices and the total imports at ex-customs prices.
From these elements, it is possible to balance resources and uses at constant prices in a simpler way than at current prices:
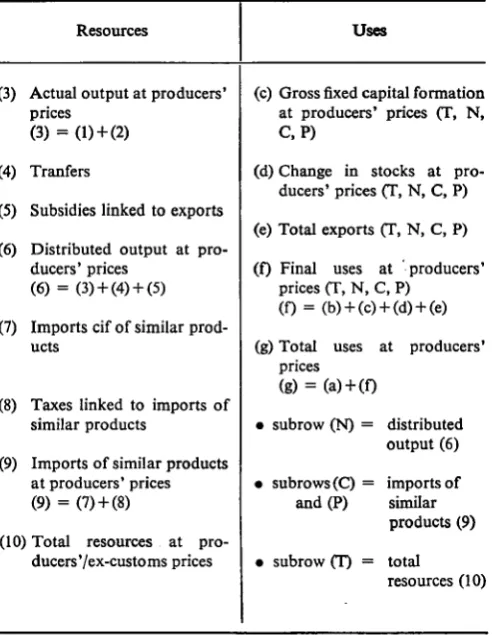
(3) The five-yearly table
The five-yearly table provides two balancing relationships where the question of valuation is concerned and three where the origins of the purchases and sales are con cerned. Hence the relationships between the tables of intermediate consumption, final uses and primary inputs and resources depend on this multiplicity.
— The five-yearly table at approximate factor prices
Briefly (ESA §635), the input-output table at approximate factor prices consists of a table of intermediate consump tion and a table of final uses valued without the net taxes levied directly on the products. It is completed with a table of primary inputs and resources in which the taxes linked to production levied directly on the total interme diate inputs of each branch are recorded in the row for taxes.