Munich Personal RePEc Archive
Achievements and challenges in the
progress of reaching millennium
development goals of Vietnam
Dang, Vinh and Do, Trang and Nguyen, Cuong and Phung,
Thu and Phung, Tung
28 January 2013
Online at
https://mpra.ub.uni-muenchen.de/54207/
ACHIEVEMENTS AND CHALLENGES IN THE PROGRESS OF REACHING
MILLENNIUM DEVELOPMENT GOALS OF VIETNAM
Vinh Dang
Trang Do
Cuong Nguyen
Thu Phung
Tung Phung
1Abstract
After a decade implementing the Socio-Economic Development Plan (SEDP) for the
period 2001-2010, Comprehensive Poverty Reduction and Growth Strategy (CPRGS) and
Millennium Development Goals (MDGs), Vietnam has successfully achieved its goals,
and has been praised for this by the international community. Vietnam has embarked
on the final stage of implementing the Millennium Development Goals. During the
recent year, there are a large number of challenges such as economic slowdown,
chronic poverty, rising inequality, and climate changes that can slow down the progress
of MDGs. These report documents the successes and challenges in the achieving the
MDGs of Vietnam.
Key words: Economic slowdown, poverty, livelihood, enterprises, labor, labor shift,
climate change.
JEL classification: O10, E17, E24
1
Authors are from Mekong Development Research Institute, Hanoi. Contact email:
2
LIST OF ABBREVIATIONS
ABR Adolescent birth rate MICS Multiple Indicator Cluster Surveys
ADB Asian Development Bank MIIC Ministry of Information and
Communications
APEC Asia-Pacific Economic Cooperation MMR Maternal mortality rate
ASEAN Association of South East Asia Nations
MOC Ministry of Construction
ASEM The Asia–Europe Meeting MOH Ministry of Health
CPR Contraceptive prevalence rate MOIT Ministry of Industry and Trade
Website
EPI Expanded Program on Immunization MONRE Ministry of Natural Resources and
Environment
EU European Union MSM Men who have sex with men
FDI Foreign direct investment MST Ministry of Science and Technology
FSW Female sex workers MWID Men who inject drugs
FTA Free Trade Agreement NMR Neonatal Mortality Rate
GDP Gross Domestic Product NTP National Tuberculosis Program
GOV Government of Vietnam ODA Official development assistance
GRID Global Resource Information
Database
OPEC Organization of the Petroleum
Exporting Countries
HCMC Ho Chi Minh City PMTCT Preventing Mother-to-Child
Transmission
HFMD Hand, foot and mouth disease R&D Research and Development
IBBS Integrated Biological and Behavioral
Surveillance
SAVY Survey on Adolescents and Youth
IDA International Development
Association
U5MR Under-five Mortality Rate
IEC Information, education and
communications
UNEP United Nations
IMF International Monetary Fund UNEP United Nations Environment
Programme
IDU Injecting drug use VHLSS Vietnam Household Living
Standards Survey
IMR Infant Mortality Rate VNFORE
ST
Vietnam Administration of Forestry
IRF International Rhino Foundation WB The World Bank
ITU International Telecommunication
Union
WHO World Health Organization
MARD Ministry of Agriculture and Rural
Development
WTO The World Trade Organization
MARPs Most At Risk Populations WWF World Wildlife Fund
MDG Millennium Development Goals
GSO
General Statistics Office
VDG Vietnam Development Goals
CPV
Communist Party of Vietnam
MPI Ministry of Planning and Investment
ARV
Antiretroviral
CHS Commune Health Station
VHW
Village health workers
3
1. Introduction
After a decade implementing the Socio-Economic Development Plan (SEDP) for the period 2001-2010, Comprehensive Poverty Reduction and Growth Strategy (CPRGS) and Millennium Development Goals (MDGs), Vietnam has successfully achieved its goals, and has been praised for this by the international community. Vietnam has embarked on the final stage of implementing the Millennium Development Goals. The period 2010-2013 has significant meaning in the socio-economic development of Vietnam, marking the completion of the Socio-economic Development Strategy 2001-2010 and transition to the period 2011-2020. Vietnam is currently facing a number of challenges. The economic slowdown in Vietnam and macroeconomic instability has reduced decent work opportunities and lowered average income. Moreover, Vietnam is also encountering increasing problems including climate change, inequality in living standards, poverty among ethnic minorities, urban poverty and migration, the quality of education and training unable to catch up with demand from the growing economy, and a weak and uncompetitive private sector in the context of rigorous economic integration. These challenges can slow down the progress of MDGs.
In the context of socio-economic challenges, the Government of Vietnam (GOV) has implemented different macro-economic policies and measures to stabilize the economy, maintain a reasonable growth rate, and prioritize poverty reduction, as well as support activities in social, economic and environmental fields. These efforts have brought about positive results.
Firstly, Vietnam has gradually stabilized its macro-economy, and controlled inflation. Exports display strong growth and agriculture continues to play an important role in economic growth. GDP per capita reached USD1.596 in 2012, which was four times higher than GDP per capita in
2000. Secondly, poverty reduction efforts have obtained positive outcomes. The national
poverty rate fell from 14.2 percent in 2010 to 9.6 percent in 2012.2 The poverty rate in the economically disadvantaged regions such as 62 poor communes in Program 30a (a program for supporting the 62 poorest districts nationwide) fell from 58.3 percent in 2010 to 43.9 percent in 2012. Thirdly, Vietnam has built up the National Strategy for Gender Equality 2011-2020. This establishment marks groundbreaking change in the national approach towards gender equality in Vietnam. Vietnam has a relatively high Gender Equality Index as compared to nations with
similar growth. Fourthly, Vietnam has succeeded in implementation of environmental
protection policies, while building a comprehensive policy and legislative framework to tackle climate change.
Vietnam has mostly completed three MDGs: MDG 1 to eradicate extreme poverty and
hunger, MDG 2 to achieve universal primary education, MDG 3 to promote gender equality and
empower women. In the period 2010-2013, Vietnam has continued to maintain and improve these achievements. Vietnam has made significant progress in the remaining MDGs. MDG 4 and
MDG 5 are close to completion. Three other MDGs, including MDG 6 to combat HIV/AIDS,
malaria and other diseases3, MDG 7 to ensure environmental sustainability, and MDG 8 to
develop a global partnership for development, have obtained positive progress.
2 Poverty rate is calculated based on the Government’s poverty line for the period 2011-2015 3
4
Progress made in the MDGs has been due to a combination of many factors. The GOV has demonstrated strong commitment towards the realization of MDGs, shown by its proactiveness in integrating MDG content into national development programmes and policies. Huge efforts made by local and central organizations and agencies, as well as support from the community, have contributed significantly towards achieved results. Tremendous financial and technical support from international development partners and many other agencies play an essential role towards the success of Vietnam.
2. MDG 1 - Eradicate extreme poverty and hunger
Millennium Development Goal
• Reduce by half the proportion of people living on less than a dollar a day
• Achieve full and productive employment and decent work for all, including women and
young people
• Reduce by half the proportion of people who suffer from hunger
SUMMARY OF PROGRESS
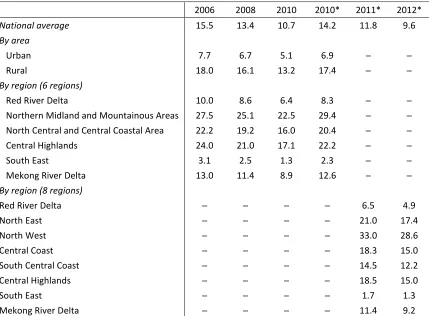
Vietnam is one of the success stories with regards to poverty reduction for the period 2000-2012. According to the government poverty line for the period 2005-2010, poverty rates dropped from 15.5 percent in 2006 to 10.7 percent in 2010. During the period 2011-2015, poverty rates declined from 14.2 percent in 2010 to 9.6 percent in 2012. Vietnam’s impressive rate of poverty reduction is the result of strong economic growth and trade liberalization, as well as poverty reduction policies directly targeting disadvantaged groups.
Despite its impressive achievements in poverty reduction, the country still faces multiple challenges in its poverty reduction efforts. The rate of poverty reduction varies across different ethnic groups and geographical regions. Poverty reduction is difficult to sustain in many cases. Some ethnic minorities and rural residents in remote areas still suffer from chronic poverty and have benefited little from economic growth and support policies. Urban poverty appears to be an emerging problem due to the high influx of rural migrants and rapid urbanization. Of increasing concern is the multidimensional poverty rate for children, which reached 29.6 percent in 2010, equivalent to 7 million children.
PROGRESS
Poverty reduction
5
[image:6.595.86.515.147.463.2]period2011-2015. Poverty reduction has been achieved across all of the geographic areas of Vietnam, with the highest rate occurring in the Red River Delta and the South East regions (Table 1.1).
Table 1. 1: Poverty rate using government poverty line for 2006–2010 (%)
2006 2008 2010 2010* 2011* 2012*
National average 15.5 13.4 10.7 14.2 11.8 9.6
By area
Urban 7.7 6.7 5.1 6.9 ─ ─
Rural 18.0 16.1 13.2 17.4 ─ ─
By region (6 regions)
Red River Delta 10.0 8.6 6.4 8.3 ─ ─
Northern Midland and Mountainous Areas 27.5 25.1 22.5 29.4 ─ ─ North Central and Central Coastal Area 22.2 19.2 16.0 20.4 ─ ─
Central Highlands 24.0 21.0 17.1 22.2 ─ ─
South East 3.1 2.5 1.3 2.3 ─ ─
Mekong River Delta 13.0 11.4 8.9 12.6 ─ ─
By region (8 regions)
Red River Delta ─ ─ ─ ─ 6.5 4.9
North East ─ ─ ─ ─ 21.0 17.4
North West ─ ─ ─ ─ 33.0 28.6
Central Coast ─ ─ ─ ─ 18.3 15.0
South Central Coast ─ ─ ─ ─ 14.5 12.2
Central Highlands ─ ─ ─ ─ 18.5 15.0
South East ─ ─ ─ ─ 1.7 1.3
Mekong River Delta ─ ─ ─ ─ 11.4 9.2
Note: The 2010* poverty rate is estimated as the Government poverty line for the period
2011-2015
Source: VHLSS 2004, 2006, 2008, 2010 by GSO and MOLISA
A significant decreasing trend is evident for two of the most important poverty measurements: poverty incidence and the poverty gap.4 This indicates that not only has the quantity of poor households decreased, but the intensity of poverty has also lessened. The poverty gap has dropped from 7 percent in 2002 to 3.5 percent in 2008, however this figure rose to 5.9 percent in 2010. In 2010, the poverty gap is higher than in 2008 for every demographic and geographic classification (Table 1. 2). Poor households in rural areas and in the Northern Midland and Mountainous Areas, the Northern Central and Central Coastal Area, and the Central Highlands (mostly ethnic minorities) have lower living standards as compared to poor households in urban areas and in other geographic regions and in poor Kinh households.
4
6
Table 1. 2: Poverty gap (%)
2002 2004 2006 2008 2010
National average 7.0 4.7 3.8 3.5 5.9
By area
Urban 1.3 0.7 0.8 0.5 1.4
Rural 8.7 6.1 4.9 4.6 7.8
By ethnicity
Kinh 4.7 2.6 2.0 1.7 2.7
Non-Kinh 22.8 19.2 15.4 15.1 24.3
By region
Red River Delta ─ ─ ─ 1.4 2.6
Northern Midland and Mountainous Areas ─ ─ ─ 8.8 15.6 North Central and Central Coastal Area ─ ─ ─ 4.4 6.3
Central Highlands ─ ─ ─ 7.5 11.5
South East ─ ─ ─ 0.3 1.7
Mekong River Delta ─ ─ ─ 2.3 4.4
Source: VHLSS 2002, 2004, 2006, 2008, 2010 by GSO
[image:7.595.88.512.474.790.2]The standard of living for households at the national level has improved drastically over the past decade. Between 2002 and 2010, household expenditure (per person per annum) has more than doubled. Expenditure levels across every geographical area and ethnic group have risen consistently over the years, indicating significant improvements in living standards at the national level. The more economically disadvantaged regions, such as the Northern Midlands, the Northern Central and Central Coastal Area, and the Central Highlands also experienced significant improvements in living standards as measured by expenditure (Table 1. 3).
Table 1. 3: Expenditure per person per annum (‘000VND)
2002 2004 2006 2008 2010
National average 3,524 4,445 4,800 6,123 7,399
By area
Urban 5,970 7,304 7,619 9,622 11,171
Rural 2,785 3,521 3,770 4,787 5,807
By region (8 regions)
Red River Delta 3,602 4,679 4,991 6,289 8,809
North East 2,890 3,640 3,891 4,874 5,853
North West 2,309 2,810 3,048 3,838 4,648
Central Coast 2,522 3,088 3,285 4,328 5,708
South Central Coast 3,204 4,104 4,255 5,459 6,660
Central Highlands 2,596 3,599 4,045 5,184 5,934
South East 5,785 6,995 7,678 9,988 10,139
Mekong River Delta 3,418 4,213 4,557 5,481 6,466
By region (6 regions)
Red River Delta 6,373 8,790
Northern Midland and Mountainous Areas 4,312 5,291 North Central and Central Coastal Area 4,825 6,206
Central Highlands 5,184 5,934
7
2002 2004 2006 2008 2010
Mekong River Delta 5,481 6,466
Note: Values are adjusted to January 2002 prices
Source: VHLSS 2002, 2004, 2006, 2008, 2010 by GSO
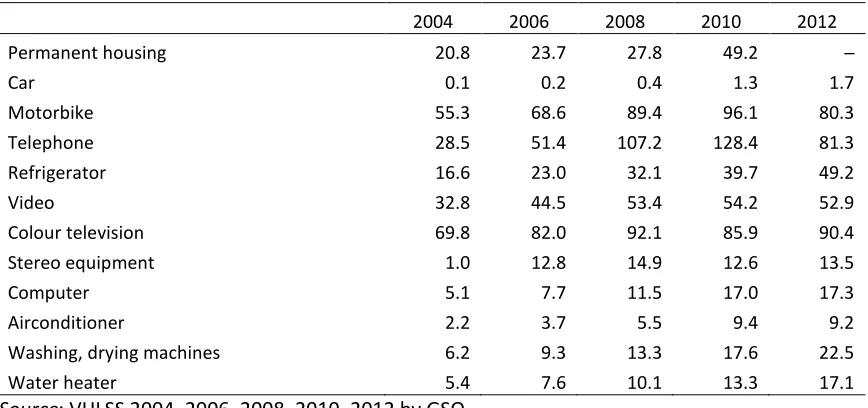
[image:8.595.83.517.285.489.2]Housing conditions, transport and access to information have improved significantly. Over the period 2004–2010, the percentage of households owning permanent housing more than doubling, from 20.8 percent to 49.2 percent. Motorbikes have become a basic transport vehicle for households with ownership increasing from 55.3 percent in 2004 to 96.1 percent in 2010, and 80.3 in 2012. Improved access to media and information, is evident through ownership of televisions, computers and videos. Ownership of other types of durable goods has also increased over the same period (Table 1. 4).
Table 1. 4: Possession of durable goods per 100 households
2004 2006 2008 2010 2012
Permanent housing 20.8 23.7 27.8 49.2 ─
Car 0.1 0.2 0.4 1.3 1.7
Motorbike 55.3 68.6 89.4 96.1 80.3
Telephone 28.5 51.4 107.2 128.4 81.3
Refrigerator 16.6 23.0 32.1 39.7 49.2
Video 32.8 44.5 53.4 54.2 52.9
Colour television 69.8 82.0 92.1 85.9 90.4
Stereo equipment 1.0 12.8 14.9 12.6 13.5
Computer 5.1 7.7 11.5 17.0 17.3
Airconditioner 2.2 3.7 5.5 9.4 9.2
Washing, drying machines 6.2 9.3 13.3 17.6 22.5
Water heater 5.4 7.6 10.1 13.3 17.1
Source: VHLSS 2004, 2006, 2008, 2010, 2012 by GSO
Success in poverty reduction in Vietnam is the result of rigorous economic growth as well as the government’s strong policy focus over the past two decades. Firstly, liberalization has opened Vietnam to international markets and promoted international trade and foreign investment. Vietnam’s joining the World Trade Organization in 2007 has eliminated trade barriers and facilitated the export of goods with comparative advantages, which in turn has created decent jobs. Rapid economic growth and trade liberalization, supported by macroeconomic policies, such as land and trade reforms, have created millions of jobs, provided income and lifted millions of people out of poverty.
households had benefited from wide policy coverage throughou
Sustainability has been strong programmes for the period 2 period 2011-2020 deliver suppo nutrition, housing, legal service job creation for the disadvanta poverty-stricken areas.
Hunger eradication
The reduction in poverty rate by a reduction in the hunger suffering from hunger droppe households suffering from hun rate of hunger is low in regions it is high throughout the Nort Central Highlands and the Nort
Figure 1. 1: Number
Vietnam has made rapid prog years of age evidenced by the age group from about 41 perce It declined by a further 17 perc Vietnam had realized its 2015ta
The most significant improvem years of age were experienced
5 WB, 2012 6
GSO
0 500,000 1,000,000 1,500,000 2,000,000 2,500,000 3,000,000 3,500,000
2009 Num
8
from the government’s support programmes and po
ghout the country.5
ongly incorporated into poverty reduction policy d 2011-2020. Sustainable poverty reduction prog upport across a variety of key indicators including
vices, culture and information, as well as vocational antaged, as well as investment in public infrastruct
tes and improvements in living standards have bee ger rate. During the period 2009-2012, the numb pped by more than 1 million. In the same perio hunger also declined by more than one third (Figure ions such as the Red River Delta, South East and Me
orthern Midland and Mountainous Areas, certain
orthern Central and Central Coastal Area.6
ber of households and individuals who suffer from h
Source: GSO, 2012
rogress in eliminating malnourishment among chi he noticeable decline in numbers of underweight ch ercent in 1990 to about 33.8 percent in 2000 (a drop percent during the period 2000-2011 to about 16.8 p
target of 20.5 percent (Figure 1.2).
ovements in reducing the rate of underweight chi ced the South Central Coast, Red River Delta and So
2010 2011 2012
Number of households Number of individuals
d policies, indicating
licy in most national programmes for the health, education, nal training support, tructure in especially
been complemented umber of individuals riod, the number of igure 1. 1). While the Mekong River Delta, tain provinces in the
m hunger
children under five children within this drop of 7.2 percent). 6.8 percent. By 2010,
children under five d South East regions,
which all recorded a reductio slowest progress was reported
Significant effort has been mad of age. The annual average re Between 2000 and 2010, the Progress has been made in red Central Highlands region experi
Figure 1. 2: Malnutrition prev
Source: National Institute of Nu
The declining trend of underwe of Vietnam’s growing commit number of challenges remain regions and different social gro wealthier group (12.9 percent) of stunting in small cities is est for large cities (8.9 percent). Mountainous Areas and the C access to basic health care and the ethnic minorities, about the
Employment
Active job creation and emplo poverty reduction and econo training programmes have hel
employment. The Labour and
support programmes helped cr
The participation of labourers at a slow rate over the past fiv
7
National Institute of Nutrition (NIN) and U
8
National Institute of Nutrition (NIN) and U
9National Institute of Nutrition (NIN). (2011 10
National Institute of Nutrition (NIN) and U 0 10 20 30 40 50
1999 2000 2001 2002
9
ction of more than 45 percent during the period ted in the North West, Central Highlands and North
made to reduce the rate of stunting among children e reduction rate over the last 10 years is estimated the prevalence of stunting decreased by approxima reducing the stunting rate across all regions within perienced the highest reduction in the rate of stunti
prevalence among children under five years of age,
f Nutrition9
erweight and stunting prevalence is continuing, whi mitment and attention to promoting child nutrit ain, especially with regard to the disparity in nutrit l groups. For instance, the stunting rate is significa ent) as compared to the poorer group (38.7 percent s estimated at 24.2 percent, which is nearly three t nt). By region, the highest rates are in the Northe he Central Highlands, which are the two regions
and nutrition is limited, and community awareness, the role of nutrition is generally low.10
ployability for the disadvantaged are among the onomic growth strategies. National employment helped increase workers’ employability, as well a
and Employment Survey 2012 shows that mult d create 1,540,000 jobs in 2012.
ers 15 years of age and older in the labour force ha five years, easing the burden of achieving job crea
nd UNICEF. (2011). General Nutrition Survey 2009-2010. Medical Publis nd UNICEF. (2011). General Nutrition Survey 2009-2010. Medical Publis 2011). Nutrition Program Report 2011.
nd UNICEF. (2011). General Nutrition Survey 2009-2010. Medical Publi 2002 2003 2004 2005 2006 2007 2008 2009
Underweight Stunting
riod 2000-2010. The rth East regions.7
dren under five years ated at 1.4 percent. ximately 32 percent. ithin this period. The unting.8
ge, 1999-2011 (%)
which is a reflection utrition. However, a utrition status across ificantly lower in the ent). The prevalence ee times higher than rthern Midland and ns where children’s ess, especially among
he government’s key ent and vocational ell as their access to ultiple government
has been increasing creation through the
ublishing House ublishing House
10
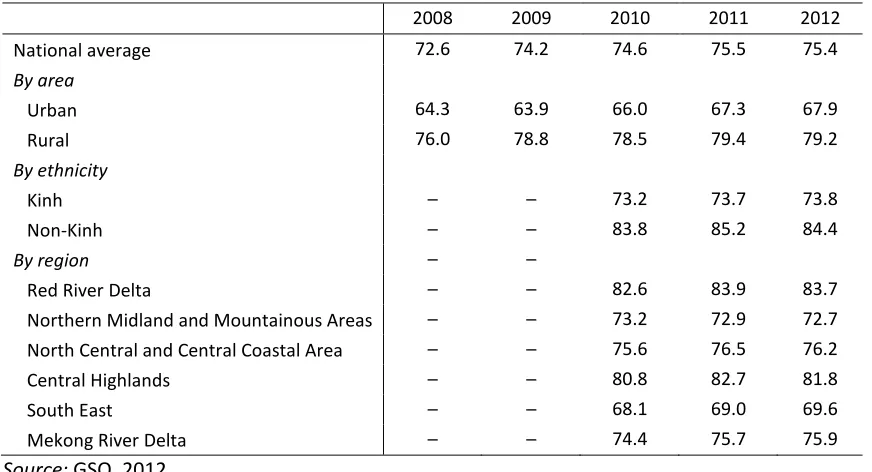
economy. In 2012, the unemployment rate decreased steadily from 2.9 percent in 2009 to 2 percent, and in urban areas it stood at 3.3 percent, while in rural areas it was 1.4 percent (Table 1. 5).
[image:11.595.81.517.248.484.2]Even though 2012’s unemployment rates showed a slight decrease in comparison with the 2011 figure, the percentage of labour in the informal sector in 2012 increased from 34.6 percent in 2010 to 35.8 percent in 2011, and 36.6 percent in 2012 (Table 1. 6). This indicates that social protection systems in Vietnam have not developed and a large proportion of labourers are engaged in predominantly unstable and low-income jobs instead of either receiving unemployment welfare benefits or finding decent work.
Table 1. 5: Rate of working labour aged 15 and older out of the total population aged 15 and older (%), 2008-2012
2008 2009 2010 2011 2012
National average 72.6 74.2 74.6 75.5 75.4
By area
Urban 64.3 63.9 66.0 67.3 67.9
Rural 76.0 78.8 78.5 79.4 79.2
By ethnicity
Kinh ─ ─ 73.2 73.7 73.8
Non-Kinh ─ ─ 83.8 85.2 84.4
By region ─ ─
Red River Delta ─ ─ 82.6 83.9 83.7
Northern Midland and Mountainous Areas ─ ─ 73.2 72.9 72.7 North Central and Central Coastal Area ─ ─ 75.6 76.5 76.2
Central Highlands ─ ─ 80.8 82.7 81.8
South East ─ ─ 68.1 69.0 69.6
Mekong River Delta ─ ─ 74.4 75.7 75.9
[image:11.595.82.526.520.582.2]Source: GSO, 2012
Table 1. 6: Unemployment rate (%), 2009-2012
2009 2010 2011 2012
Total 2.90 2.88 2.27 1.99
Urban area 4.60 4.43 3.60 3.25
Rural area 2.25 2.27 1.71 1.42
Source: GSO, 2012
There has been a gradual shift from self-employment into wage employment. During the period
2002-2010, the rate of wage employment increased by 10.2 percent.11By area, there is a distinct
difference in employment structure between rural and urban areas; farm self-employment accounts for the largest employment share in rural areas (53.3 percent in 2010), while wage-employment is the main form of wage-employment in urban areas (56.8 percent in 2010). The shift from self-employment in the farm sector to wage employment for both areas was slow (Figure 1. 3). Moreover, the economic slowdown during the period 2011-2012 resulted in a large proportion of the labour force returning to agriculture, which has slowed the process of shifting labour from the informal to the formal sector.
11
Figure 1. 3: Employm
Source: VHLSS 2002, 2004, 2006
Despite the ongoing improvem economy are concentrated in a skilled labourers accounted for
CHALLENGES
Inequality and chronic povert
sustained high economic growt the level and speed of poverty to different levels of participati poverty reduction has slowed d concentrated in rural and mo minorities. Ethnic minorities ac Ethnic minority household in Highlands and the Northern Mi rates. The poverty rate in the C 2010, and 1.6 times higher in poverty rate was 2.3 times hig 2012.
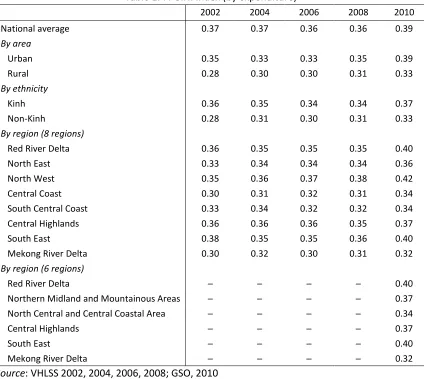
Inequality in living standards Disparity in living standards am (by expenditure) for ethnic min urban areas, more developed r high levels of inequality, but a areas and less developed region
12 Labor and Employment Survey 2011, GSO 13
CEMA Report
22.1 25.1 26.5 63.8 60.5 59.6
14.1 14.4 14
0% 20% 40% 60% 80% 100%
2002 2004 2006
Non-farm self-emplo Farm self-employme Wage employment
11
loyment structure in rural and urban areas (%), 2002
2006, 2008, 2010
vements to employment structure, the majority o in agriculture and informal employment. In 2011, for 40.4 percent of the total employed population
verty within the most vulnerable groups. Natio owth have resulted in a substantial reduction in the erty reduction varies across geographic and demogra
ipation in the social and economic development pro ed down over time and most of the remaining poo mountainous areas, which are mainly populate s account for 50 percent of the total number of
incomes are one-sixth of the national averag Midland and Mountainous Areas have the highest the Central Highlands was 1.5 times higher than the
r in 2012. In the Northern Midland and Mounta s higher than the national average in 2010, and 2.5
tends to increase across geographic regions an among ethnic minority households also increases minorities increased from 0.28 in 2002 to 0.33 in 20 ed regions such as the Red River Delta and the South
ut a slower rate of increasing inequality as compa gions.
, GSO
50.4 53.0 53
15.0 14.0 13
34.6 33.0 33
0% 20% 40% 60% 80% 100%
2002 2004 200
Non-farm self-em Farm self-employ Wage employmen 6.5 27.4 31.3
9.6 58.4 53.3 14.3 15.4
006 2008 2010
mployment yment ent
002-2010
ity of workers in the 11, 20.4 million
low-.12
ational policies and the poverty rate, but ographic groups due t process. The rate of poor households are lated by the ethnic poor households. rage.13 The Central hest national poverty the national rate in ntainous Areas, the d 2.5 times higher in
s and ethnic groups. ases. The Gini Index n 2010 (Table 1.7). In outh East experience mpared to the rural
53.4 54.5 56.8 13.2 11.7 11.1 33.4 33.8 32.1
2006 2008 2010
employment ployment
12
Table 1. 7: GINI Index (by expenditure)
2002 2004 2006 2008 2010
National average 0.37 0.37 0.36 0.36 0.39
By area
Urban 0.35 0.33 0.33 0.35 0.39
Rural 0.28 0.30 0.30 0.31 0.33
By ethnicity
Kinh 0.36 0.35 0.34 0.34 0.37
Non-Kinh 0.28 0.31 0.30 0.31 0.33
By region (8 regions)
Red River Delta 0.36 0.35 0.35 0.35 0.40
North East 0.33 0.34 0.34 0.34 0.36
North West 0.35 0.36 0.37 0.38 0.42
Central Coast 0.30 0.31 0.32 0.31 0.34
South Central Coast 0.33 0.34 0.32 0.32 0.34
Central Highlands 0.36 0.36 0.36 0.35 0.37
South East 0.38 0.35 0.35 0.36 0.40
Mekong River Delta 0.30 0.32 0.30 0.31 0.32
By region (6 regions)
Red River Delta ─ ─ ─ ─ 0.40
Northern Midland and Mountainous Areas ─ ─ ─ ─ 0.37 North Central and Central Coastal Area ─ ─ ─ ─ 0.34
Central Highlands ─ ─ ─ ─ 0.37
South East ─ ─ ─ ─ 0.40
Mekong River Delta ─ ─ ─ ─ 0.32
Source: VHLSS 2002, 2004, 2006, 2008; GSO, 2010
Sustainability in poverty reduction. Poverty reduction is difficult to sustain because a large proportion of households that are lifted out of poverty are at high risk of falling back into poverty. The proportion of non-poor households in 2010 that fell into poverty in 2012 was 4.2 percent, accounting for 36.5 percent of the total number of poor households in 2012.14 Poor and low-income households are highly vulnerable to external and internal risks at the community, household and individual levels. Natural disaster, extreme weather events and illness are among the highest threats to household living standards. Moreover, growing exposure to economic crises, unemployment, as well as illness, natural disaster and climate risk increases the level of household risk of falling back into poverty. This is particularly true for households in disadvantaged areas such as the Northern Midland and Mountainous Areas and the North Central and the Central Coastal Area where extreme weather events are occurring at increasing frequencies and households have limited access to social protection and financial support. It is important to develop adequate measurements to prevent these households from falling back into poverty.
Urban poverty. While urban poverty has substantially decreased, rapid urbanization and the influx of immigrants from rural areas in recent years has challenged the raising of living
14
13
standards and socio-economic development in urban areas. Poor urban residents suffer from a shortage of social capital, the capacity to find alternative livelihoods, limited access to public services and a lack of social integration. The local and migrant poor particularly have limited access to social protection systems, as they are predominantly employed in the informal sector. The high cost of living and rising prices in urban areas tend to exaggerate the economic situation of vulnerable groups. Urban poverty, especially for migrants, adversely affects sustainable poverty reduction at the national level.
Child poverty. The well-being of children not only depends on their guardians’ income but also the environment they live in. Their comprehensive development is determined by their physical, spiritual and intellectual well-being. Therefore, the measurement of child poverty involves not only economic dimensions but also eight other areas of developmental need, including education, health, nutrition, housing, clean water and sanitation, child labour prevention, entertainment and social integration, and social protection. Children are classified into the category of multidimensional poverty when their access to at least two of these eight needs is not guaranteed.
The methodology for measuring multidimensional poverty provides a more specific and comprehensive picture of children’s deprivation and poverty status compared to the child poverty rate, which is calculated on income alone. The proportion of children under 16 years of age within the multidimensional poverty category based on six domains was 20.6 percent in 2010. Although this represents a relatively rapid decrease of 28.9 percent compared to 2008, it is still a significantly high level. Multidimensional poverty based on seven domains in 2010 for children under16 years of age was estimated at 29.6 percent. This figure amounts to more than 7million children living with certain forms of deprivation. The two regions with the highest rates of multidimensional poverty among children are the Northern Midland and Mountainous Areas and the Mekong River Delta. Multidimensional poverty rate for ethnic minority children is particularly high.
3. MDG 2: Achieve universal primary education
Millennium Development Goal
• Ensure that, by 2015, children everywhere, boys and girls alike, will be able to complete a
full course of primary schooling
SUMMARY OF PROGRESS
Vietnam has achieved universal primary education (by the national standard). By 2012, the net enrolment rate in primary education reached 97.7 percent and the net enrolment rate in lower secondary education was 87.2 percent. Inequality in access to education and quality of education still exists between ethnic majorities and ethnic minorities, between rural and urban areas. Education reform with a focus on the improving the quality of teaching and learning, as well as school facilities is essential to ensuring that Vietnam’s education system can meet the rising demand of a rapidly changing economy.
14
Quality education is an essential factor in establishing productivity, growth and social development. Rigorous implementation of education policies and programmes over the past few years has resulted in significant improvements in access to and quality of education at every education level. In order to embrace a fast-growing economy, the government demonstrated strong commitment and determination towards systematically building a well-rounded education system with a focus on knowledge, innovation, equity and applicability during the period 2011-2020.
The net enrolment rate in primary education has slowly risen over the period 2006-2012. By 2012, the net enrolment rate in primary education reached 97.7 percent (Table 2. 1), with a total of 60 out of 63 provinces having obtained the national standard for universal primary
education.15
Recognising these achievements, the country is moving towards universal lower secondary education. Universal education programmes in both primary and lower secondary education have been actively reinforced at the local level. The net enrolment rate for lower secondary education has increased consistently over the period 2006–2012,from 81 percent in 2007 to 87.2 percent in 2012. All 63 provinces have obtained the national standard for universal lower
[image:15.595.81.514.381.430.2]secondary education.16
Table 2. 1: Net enrolment rate by education level (%)
2006-2007 2007-2008 2008-2009 2011-2012
Primary education 96.0 96.1 97.0 97.7
Lower secondary education 81.0 82.7 83.1 87.2
Source: Ministry of Education and Training
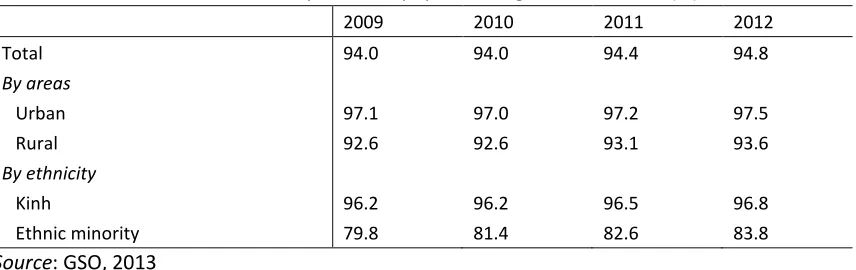
Literacy rates for those aged 10 and over improved slightly during 2009-2012. Literacy rates reached 94.8 percent in 2012, with 97.5 percent in urban areas and 93.6 percent in rural areas. Huge disparities exist between the Kinh and ethnic minorities despite the gap having narrowed over time. In 2012, the literacy rate among ethnic minorities was 13 percent below their Kinh counterparts (Table 2.2).
Table 2. 2: Literacy rates for population aged 10 and older (%)
2009 2010 2011 2012
Total 94.0 94.0 94.4 94.8
By areas
Urban 97.1 97.0 97.2 97.5
Rural 92.6 92.6 93.1 93.6
By ethnicity
Kinh 96.2 96.2 96.5 96.8
Ethnic minority 79.8 81.4 82.6 83.8
Source: GSO, 2013
Primary school completion rates were relatively high at 92.1 percent in 2012, which represents an increase of4.2 percent from 2008 (Table 2. 3). Primary completion rates remained the lowest
15 Annual Report on Socio-economic Development 2012 by the Government of Vietnam 16
[image:15.595.86.514.559.694.2]15
[image:16.595.77.514.131.316.2]in the Central Highlands (83.6 percent in 2012) and in the Mekong River Delta (86.4 percent in 2012).
Table 2. 3: Primary completion rates (%)
2007-2008 2008-2009 2009-2010 2010-2011 2011-2012
Total 87.9 88.5 91.5 92.2 92.1
By region
Red River Delta ─ ─ 98.7 99.1 98.8
Northern Midland and
Mountainous Areas ─ ─ 87.4 89.5 89.4
North Central and Central Coastal
Area ─ ─ 93.8 94.5 94.6
Central Highlands ─ ─ 81.8 83.3 83.6
South East ─ ─ 96.2 96.6 96.1
Mekong River Delta ─ ─ 85.5 86.1 86.4
Source: GSO, 2013
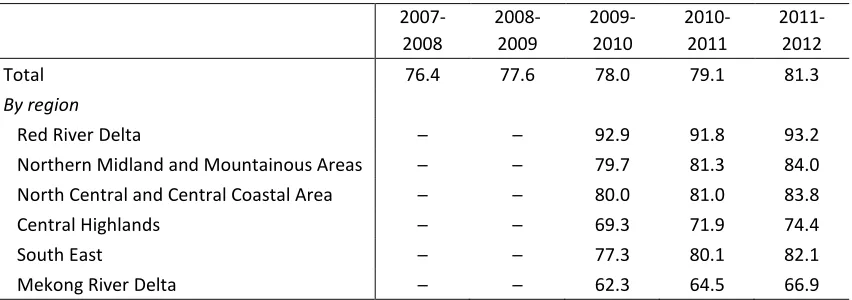
Completion rates for lower secondary education have improved at a faster pace than for primary education, albeit at a lower level. During the period 2007-2012, completion rates for lower secondary education increased by 5.7 percent (Table 2. 4).
Table 2. 4: Completion rates for lower secondary education (%)
2007-2008
2008-2009
2009-2010
2010-2011
2011-2012
Total 76.4 77.6 78.0 79.1 81.3
By region
Red River Delta ─ ─ 92.9 91.8 93.2
Northern Midland and Mountainous Areas ─ ─ 79.7 81.3 84.0 North Central and Central Coastal Area ─ ─ 80.0 81.0 83.8
Central Highlands ─ ─ 69.3 71.9 74.4
South East ─ ─ 77.3 80.1 82.1
Mekong River Delta ─ ─ 62.3 64.5 66.9
Source: GSO, 2013
[image:16.595.86.512.405.555.2]16
Table 2. 5: Number of schools at each education level
2007-2008 2008-2009 2009-2010 2010-2011 2011-2012
Kindergarten 11,629 12,190 12,357 12,908 13,172
Primary education 14,939 15,051 15,172 15,242 15,337 Lower secondary education 9,768 9,902 10,060 10,143 10,243 Upper secondary education 2,167 2,192 2,242 2,288 2,350 Professional secondary education 209 227 230 226 215
Undergraduate 160 169 173 188 204
Source: Ministry of Education and Training
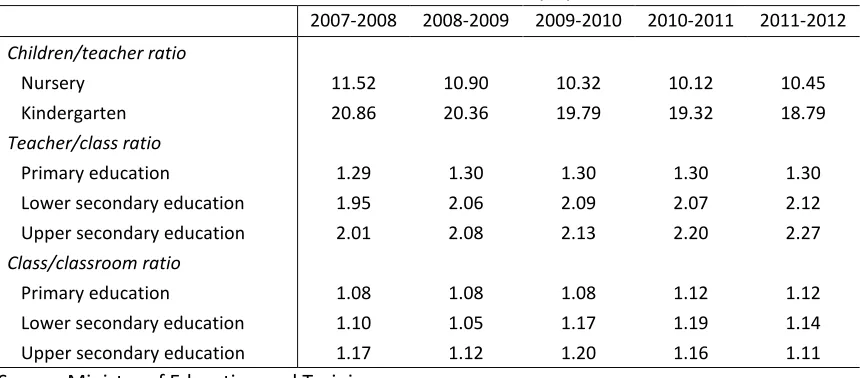
The quality of education has improved in various ways. In addition to the increase in school numbers, the availability of teachers and school facilities has improved. At the nursery and kindergarten levels, the child to teacher ratio has decreased consistently over the period 2007-2012. This reduction implies that children at lower education levels received better care and attention from their teachers. The teacher-to-class ratio climbed significantly over the period 2007-2012 for upper secondary education, having increased by 12.9 percent. Teacher-to-class ratios also increased substantially for lower secondary education and remained relatively stable for primary education (Table 2. 6).
Table 2. 6: Teacher and class room availability by education level
2007-2008 2008-2009 2009-2010 2010-2011 2011-2012
Children/teacher ratio
Nursery 11.52 10.90 10.32 10.12 10.45
Kindergarten 20.86 20.36 19.79 19.32 18.79
Teacher/class ratio
Primary education 1.29 1.30 1.30 1.30 1.30
Lower secondary education 1.95 2.06 2.09 2.07 2.12 Upper secondary education 2.01 2.08 2.13 2.20 2.27 Class/classroom ratio
Primary education 1.08 1.08 1.08 1.12 1.12
Lower secondary education 1.10 1.05 1.17 1.19 1.14 Upper secondary education 1.17 1.12 1.20 1.16 1.11 Source: Ministry of Education and Training
[image:17.595.84.515.368.557.2]17
Table 2. 7: Percentage of teachers with standard qualifications and above (%)
2007-2008 2008-2009 2009-2010 2010-2011 2011-2012
Nursery 79.6 79.6 89.5 89.7 91.1
Kindergarten 94.3 94.7 95.4 96.0 97.1
Primary education 97.4 98.6 99.1 99.5 99.6
Lower secondary education 97.4 97.4 98.3 98.8 99.2 Upper secondary education 97.5 98.0 98.9 99.1 99.6 Source: Ministry of Education and Training
Education is an increasing priority for the government as well as individual households. Between 2008 and 2011, the national education budget increased by 150 percent(Table 2.8). Similarly, household expenses on education increased steadily and substantially between 2002 and 2010,
and between 2008 and 2010 average household spending on education increased 64 percent.17
Table 2.8: National expenditure for education and training (billion VND)
2008 2009 2010 2011
Total 74,017 80,554 95,534 106,586
Central 18,912 20,288 24,266 26,268
Local 55,105 60,266 71,268 80,318
Note:Values are adjusted to January 2008 prices
Source: Ministry of Education and Training
Ongoing national policies and programmes (2010-2015) are providing tremendous support to delivering facilities for schools located in remote mountainous areas and improving teacher qualifications. The government has set out a comprehensive list of national policies that provide support to both kindergarten and secondary education. The government’s determination to
build a quality education system is highlighted in the Socio-Economic Development Strategy
2011-2010 and the Education Strategic Development Plan 2011-2020.
CHALLENGES
Education quality. Vietnam has achieved universal primary education and access to primary education improves annually. Nevertheless, ensuring that every child completes a full course of primary schooling by 2015 is proving to be a highly challenging task. The success in primary education enrolment does not guarantee the quality of education or continuous study to higher levels. Even though the net enrolment rate for primary education has reached an impressive 97.7 percent, completion rates only stood at 92.1 percent in 2012, indicating 7.9 percent of students did not complete primary education. In lower secondary education, about 20 percent of enrolled students did not complete lower secondary education. This suggests that the payoffs to universal primary and secondary education are limited if students are not acquiring the necessary knowledge and skills for higher education and are unable to meet the changing demands of a growing economy.
Reducing school dropout rates, especially in remote areas, has been critically challenging. The main reasons for students dropping out of school are financial problems within the family and the learning capacity of students. In highly remote and disadvantaged areas, many students
17
[image:18.595.84.525.294.359.2]18
leave school because their parents do not encourage their children to attend school, and instead persuade them to stay home and support the family. Language barriers are among critical factors that affect learning outcomes of ethnic minorities groups. Ethnic minorities who cannot speak fluent Vietnamese encounter great difficulties in comprehending learning materials; this language barrier makes them lag behind other students in terms of learning and they dropout eventually when they find they cannot catch up with their classmates. In general, Vietnam’s education system still faces low-quality teaching and learning, particularly in disadvantaged areas. Low-quality schooling contributes significantly to insufficient learning outcomes and high dropout rates.
Low education quality can be partly attributed to inadequate school facilities, learning and teaching equipment, as well as the limited capacity of teachers and management staff within schools. In Vietnam, many school facilities are not able to cater for large student intakes. Class-to-classroom ratios at both the primary and secondary education levels are higher than one, indicating that not every class has its own classroom. The infrastructure of many public universities and colleges across the country fails to meet standard regulations.18Much of the time, school facilities and equipment, such as laboratories and libraries, are insufficient and outdated.
Education inequality. Clear disparities exist in access to education between rural and urban areas, between ethnic majorities and ethnic minorities, and among geographical regions of Vietnam. Certain regions are consistently worse-off than other regions across all of the education indicators. By region, the 2012 completion rates at primary education level were especially low in the Northern Midland and Mountainous Areas, Central Highlands and Mekong River Delta regions (at 89.4 percent, 83.6 percent and 86.4 percent respectively). For the same period, the Central Highlands and the Mekong River Delta continued to experience the lowest completion rates at lower secondary education level (at 74.4 percent and 66.9 percent respectively). By ethnicity, literacy amongst non-Kinh groups experienced a negligible level of improvement in2012,andit remains relatively low at 83.8 percent. In 2012, the literacy rate for ethnic minority women and girls was even lower at 78.5 percent. Some provinces faced significantly low literacy rates in 2012 including Lai Chau (69.3 percent), Dien Bien (73.5
percent), Ha Giang (76 percent) and Son La (77.2 percent).19Despite considerable improvement
in access to education and education quality, educational performance for the most economically and socially disadvantaged groups remains consistently lower than the national average.
4. .MDG 3: Promote gender equality and empower women
Millennium Development Goal
Eliminate gender disparity in primary and secondary education preferably by 2005, and at all levels by 2015:
• Ratio of girls to boys in primary, secondary and tertiary education
• Share of women in wage employment in the non-agricultural sector
• Proportion of seats held by women in national parliament
18 Results from a survey conducted by Moet for 200 public universities and colleges throughout Vietnam in 2010 19
19
SUMMARY OF PROGRESS
Vietnam has gained remarkable results in promoting gender equality and women’s empowerment. A level of gender equality has been achieved in terms of access to primary education and mostly achieved for lower secondary education. But for higher-level education, gender equality becomes more apparent. Gender equality in employment has made significant progress; in 2012, women accounted for 48.7 percent of the national labour force, taking up 48 percent of newly created jobs. Even though women’s representation in the National Assembly has experienced a slight decline in recent years, Vietnam is in the top five developing countries in Asia with the highest number of women in the National Assembly (24.2 percent in 2011).
The government has demonstrated a strong commitment to gender equality and women’s empowerment-related activities. Following the introduction of gender equality legislation in 2006, the government established a national strategy to raise awareness aboutthe importance of gender equality and promote the role of women in the social, economic and political arenas.
PROGRESS
Vietnam has made remarkable progress in multiple aspects of gender equality, particularly in education, employment and politics. The country has eliminated gender inequality in terms of access to primary education and women’s participation in the labour force has improved. Women’s representation in the National Assembly was 24.2 percent in 2011, a slight decrease compared to previous terms. When compared to other countries in the region or countries at similar stages of development, Vietnam has a relatively high gender equality index. The country was placed in 48thposition by the Gender Inequality Index20 ranking in 201221, and ranked
58thbyUNDP’s gender development index in 2008.22
Rigorous legislative changes and social programmes aimed at institutionalizing gender equality have helped Vietnam to make a positive impact on gender equality. The importance of gender equality in socio-economic development has been acknowledged by the government through the foundation of numerous national-scale programmes and strategies on gender equality for the period 2011-2020. It has established the National Program on Gender Equality 2011-2015 and National Strategy on Gender Equality 2011-2020, to support the roll-out of the law on gender equality enacted in 2006. These initiatives exemplify the ground-breaking change that has occurred in the national approach towards gender equality in Vietnam. The year 2012 marked the first time that a national budget was allocated for implementation of the national general equality programme for the period 2011-2015.
Gender equality in education
Vietnam has eliminated gender disparity in access to primary and mostly obtained gender equality in access to lower secondary education. Between 2006 and 2010, there was no significant difference in the net enrolment rate between boys and girls in primary and lower secondary education (Table 3. 1). The difference in the net enrolment rate fluctuated between
20
The Gender Inequality Index relies on indicators in the areas of maternal mortality and health, adolescent fertility, parliamentary representation, education attainment and labor force participation, the ranking is representative of women and girl’s opportunities.
21 Human Development Report 2013: the Rise of the South, UNDP 22
20
[image:21.595.124.474.161.320.2]1–2 percent, indicating equality in access to education. Net enrolment rates for boys and girls in primary education in 2010 were 92.3 percent and 91.5 percent respectively. Likewise, the difference in net enrolment rates for lower secondary education between boys and girls stood at 2.5 percent in 2010.
Table 3. 1: Net enrolment rates by education level and gender
2006 2008 2010
Primary education
Boys 89.3 88.7 92.3
Girls 89.2 87.9 91.5
Lower secondary education
Boys 78.3 77.3 80.1
Girls 79.2 79.5 82.6
Upper secondary education
Boys 51.5 50.3 53.7
Girls 56.4 58.5 63.1
Source: VHLSS 2010
Disparity in access to education becomes more apparent in upper secondary education, with the gap in net enrolment rates between boys and girls widening overtime (Table 3.1). Girls experienced a significantly higher-level of access to upper secondary education than boys over the period 2006-2010.
Inequality in access to advanced levels of education is relatively low. The percentage of women and girls at every education level is comparable to that of men (Table 3. 2). Even at higher education levels, such as the undergraduate level, the percentage of enrolled women and girls was consistently high at48 percent over the period 2007-2012. In professional secondary education, the rate of enrolments for girls was higher than the rate for boys.
Table 3. 2: Percentage of female students by education level
2007-2008 2008-2009 2009-2010 2010-2011 2011-2012
Kindergarten 48.7 47.7 47.4 46.2 46.7
Primary education 46.2 47.9 47.3 47.3 48.6
Lower secondary education 48.8 47.8 49.8 48.2 48.5 Upper secondary education 51.7 52.6 52.7 52.6 53.2 Professional secondary education 50.8 51.2 53.0 53.2 52.1
Undergraduate 48.4 48.5 48.6 48.3 48.2
Source: Ministry of Education and Training
[image:21.595.83.534.518.629.2]21
Table 3. 3: School attendance rates for ethnic minorities aged 6–14 (%)
2002 2004 2006 2008 2010
Average 86.0 88.0 88.0 88.0 89.8
Boys 89.0 89.0 89.0 87.0 89.7
Girls 83.0 87.0 88.0 89.0 89.9
Source: GSO, 2013
Not only has equality been achieved in terms of access to education but women are also well-represented in teaching positions at higher education levels, including professional secondary and undergraduate level education. The proportion of female teaching staff rose steadily over the period 2007-2012, surpassing the participation of men. A similar trend was observed for undergraduate level education, reaching a high of 47 percent in the school year 2011–2012 (Table 3. 4). By 2012, women in teaching roles accounted for 25 percent of doctoral degree
holders and 47.1 percent of master’s degree holders.23 The improvement in the representation
[image:22.595.82.542.340.390.2]of women among teaching staff indicates that the women’s qualifications have improved in terms of both quantity and quality.
Table 3. 4: Percentage of female teaching staff by education level
2007-2008 2008-2009 2009-2010 2010-2011 2011-2012
Professional secondary education 49.1 49.9 48.7 51.0 53.7
Undergraduate 43.1 44.3 45.4 45.7 47.0
Source: Ministry of Education and Training
Children’s education is an increasing priority for parents and Vietnamese society in general. There has been a positive change in the perception of education and training with respect to gender. Equal opportunities to access education are given to both boys and girls by parents and the education system. Educational expenses per household on average are comparatively similar for both boys and girls; and educational expenses for girls were higher than for boys in 2010 for the first time since 2002 (Table 3.5). This indicates that the importance of education for both boys and girls is being acknowledged, and both households and the government have spent substantial amounts on education for both boys and girls.
Table 3. 5: Average expenditure on education and training per student per household (‘000 VND)
2002 2004 2006 2008 2010
Average 627 826 1211 1844 3028
Boys 641 847 1240 1879 3025
Girls 611 803 1180 1806 3032
Source: VHLSS 2010, GSO
Gender equality in employment
23
[image:22.595.78.516.578.645.2]22
One of the key national targets on gender equality is to reduce gender gaps in the economy, labour, and employment. Over the past decade, a series of programmes creating job opportunities and promoting the employability of women have been implemented; and they have achieved remarkable results. Decision 295/QD-TTg, which was approved by the government as part of the project entitled “Providing vocational training, creating jobs for women during the period 2010-2015”, has helped improve women’s competitiveness in the employment market, and enabled them to find more stable and better-paid jobs, securing their source of income. Women took up more than 48 percent of the newly created jobs in 2012,
according to The Labour and Employment Study 2012.
[image:23.595.80.517.409.572.2]Employment improved consistently for both men and women during the period 2010-2012. The labour participation rate for the population aged 15 years and older experienced a slight increase between 2010 and 2012; although the gender gap narrowed, it remained wide at 8.9 percent with a higher level for men. During the period 2010–2012, a minor decrease was experienced for both men and women in the percentage of own account and family workers for the population aged 15 years and older (Table 3. 6). Nevertheless, own account workers and family workers remain the most common forms of employment. The significant progress made in gender equality in employment is illustrated by substantial increases in the participation rate of the population aged 15 years and older in wage employment in the non-farm sector for both men and women during the period 2002-2010 (at 12.4 percent and 28 percent respectively). By 2012, 46percent of workers had undergone training.
Table 3. 6: Percentage of labour aged 15 years and older by type of employment (%)
2010 2011 2012 (Preliminary)
Total Men Women Total Men Women Total Men Women Percentage of labour
aged 15 and older who has a job over population aged 15 and older
74.6 79.4 70.2 75.5 80.3 70.9 75.4 80.0 71.1
Percentage of own account worker or family worker over the population aged 15 and older who has a job
63.2 56.6 70.3 62.4 55.9 69.4 62.5 56.3 69.1
Source: GSO, 2013
23
Table 3. 7: Average working hours by type of employment
2002 2004 2006 2008 2010 Percentage of population aged 15 and above working as wage employment in non-farm employment
Male 27.8 32.6 34.2 35.5 40.2
Female 16.8 20.0 22.4 24.2 28.0
Average working hours per week per person aged 15 and above in wage employment in non-farm employment (hour)
Male 39.3 39.6 40.5 41.1 41.1
Female 40.3 40.9 41.3 41.8 41.1
Average working hours per week per person aged 15 and above in main job (hour)
Male 32.8 32.2 33.2 33.5 33.7
Female 32.6 31.6 32.7 32.7 31.7
Source: VHLSS 2010, GSO
[image:24.595.82.514.507.610.2]By the final quarter of 2013, the number of men in skilled labourer jobs was higher than the corresponding figure for women (5,133,900men compared to 3,749,700women). Some 19.1 percent of men aged 15 years and older employed as labourers were skilled workers and the corresponding rate for women was 14.9 percent. The number of men working in wage employment was substantially higher than for women (10,959,700men compared to 7,373,200women). Among the population aged 15 years and older who had a job, 40.9 percent of men were working in wage employment; women accounted for 29.3 percent of the total number of women aged 15 years and older who had a job. The difference between percentage of wage employment workers for men and women was as high as 11.6 percent. Moreover, with regard to wage employment workers, the average monthly salary for men employed as labourers in wage employment aged 15 years and older was substantially higher than women (Table 3.8). This indicates a clear disparity in the quality of employment between men and women employed as labourers; with women at a higher disadvantage in terms of employment.
Table 3. 8: Employment situation in the fourth quarter of 2013 (‘000people)
Number of skilled labourers
Number of wage employment
workers
Population aged 15 and
above
Population aged 15 and older that have job
Average monthly salary of wage
employment workers (‘000VND)
Men 5133.9 10959.7 33449.6 26773.6 3952.0
Women 3749.7 7373.2 35372.3 25157.3 3586.0
Total 8883.6 18332.9 68821.9 51930.9 3805.0 (average) Source: GSO, 2013
Gender equality in management and leadership
percentage of women holding t
2009 to 24.7 percent in 2011.24
Women’s representation in the decades. The proportion of sea terms. Even though the prop decreased by 1.6 percent du 2016term, Vietnam is one of fiv seats for women in the Nationa
Figure 3. 1: Per
Source: National Assembly
CHALLENGES
Gender inequality in higher edu
has achieved universal primary lower secondary education, e remote areas, and among et substantial gap existed in litera and older during the period 20 10 years and older was 10.8 pe as the Northern Midland and M than girls; although this gap has
Gender inequality in employme
participation in the labour fo employment opportunities. In 2 which is 9.1 percent lower th vulnerable types of jobs, partic fewerskills and limited access t Over the period 2009-2011, wo employment does not provide
24
GSO, 2013
25
Labor and Employment Survey 2011, GSO those aged 15 years and older at 73.2 perc
26
Labor and Employment Survey 2011, GSO
0 5 10 15 20 25 30 1987-1992 1992-19 24
ing the highest position in enterprises increased from
24
the National Assembly has improved significantly seats held by women has remained relatively high roportion of seats held by women in the Nation
during the 2007-2011 term to 24.2 percent five developing countries in Asia that has the high ional Assembly (Figure 3. 1).
: Percentage of women in the National Assembly (%)
education and among disadvantaged groups. Even ary education and almost eliminated gender inequ n, enrolment rates for girls in higher level educat g ethnic minority communities, is much lower t literacy rates between ethnic minority boys and gir d 2009-2012. In 2012, the literacy rate for ethnic m percent lower than that of men. In highly disadvan nd Mountainous Areas, boys demonstrated higher has narrowed, it remained at a relatively high7.8 pe
yment. Gender inequality persists in the labour ma r force is higher for men, who have better a . In 2011, labour participation rates for women stood
er than men.25 Women account for the majority
articularly in the informal sector. Women in the info ss to skill development and training programmes co , women accounted for 64 percent of family worke vide any form of social security nor job guarantee
GSO; UNDP Human Development Report 2013 displayed labour force percent for women, 81.2 percent for men
, GSO
1997 1997-2002 2002-2007 2007-2011
from 20.8 percent in
tly over the last two igh over the last four tional Assembly has t during the 2011-highest proportion of
(%)
ven though Vietnam equality in access to ucation in rural and er than for boys. A girls aged 10 years minority girls aged vantaged areas such her levels of literacy
percent in 2012.
r market. The rate of r access to decent tood at 72.6 percent, rity of labourers in informal sector have s compared to men. orkers26─this type of tee in the longterm.
orce participation rates for
25
Over the same period, women accounted for only 40 percent of the total wage employment labour force, 20 percent lower than men’s participation in wage employment.
Representation of women in the National Assembly. Women’s representation in the National Assembly remained relatively high at 24.2 percent for the term 2011–2016, which is the lowest rate recorded in the last four terms. In general, fewer women have reportedly run for official positions and they have also experienced lower election rates compared to men. The 2011 figures show female candidates accounted for only 34.1 percent of the whole candidate pool
and rates of election for women are 20 percent lower than for men.27
Gender-based domestic violence. Domestic violence has been a growing problem in Vietnamese society, creating obstacles to the development of both families and the society as a whole. Domestic violence has serious consequences for the physical and mental health of its victims.
Some 33,914 people were reported to be victims of domestic violence in 201228, of which 85.1
percent were women. The National Study on Domestic Violence against Women in Vietnam 2010 reported that one in every three women who have ever been married have suffered from physical or sexual violence caused by their husbands, and 58 percent of Vietnamese women reported experiencing at least one among three types of domestic violence in their lifetime (physical, sexual or emotional violence). The study also highlights a concerning increase in the rate of victims(87.1 percent) failing to seek help from any agency or person in authority for three main reasons: the perception that violence is not a serious problem; the fear that seeking helping might harm their family’s reputation; and feeling ashamed. It is therefore essential to encourage victims of domestic violence to speak out and seek help from society.
Gender-biased perception. Gender-biased perception with a preference for men contributes to the ample evidence of continuing gender inequality. Despite the government’s adoption of the Law on Gender Equality and the Law on Domestic Violence Prevention and Control, limited knowledge and access to legal information persists which contributes to the perpetuation of gender inequality. Gender bias causes men and boys to be more highly respected and given more privileges than women and girls in family and society. Many families still have preference for sons, especially in rural and ethnic minority households, and this situation seems to have worsened over recent years. Three main reasons for increasing the sex ratio at birth have been identified, including a preference for sons in society; the development of medical facilities that allow for gender prediction during pregnancy and abortion; and family planning and economic and social protection factors. Disparity in the boy-to-girl ratio at birth amplified significantly between 2010 and 2012. In 2010, the ratio stood at 111.2 to 100, while in 2011 and 2012 it
reached 111.9 to 110 and 112.3 to 100 respectively.29 The gender prediction before birth
reflects the gravity of gender inequality. This situation poses a potential threat to improving the gender balance in the future population structure, and disrupts demographic characteristics in family structures and the marriage system.
27
Inter-parliamentary Union
28 Report on the Implementation of National Target on Gender Equality in 2012, the Government of Vietnam 29
5. MDG 4: Reduce child
Millennium Development Goal
• Between 1990 and 2015, r
SUMMARY OF PROGRESS
The under-five mortality rate percent in 1990 to 23.3 perce mortality rate was estimated a The under-one immunization r to 97.1 percent in 2005, and ha
Despite recent achievements, levels of access among childre The implementation of free he ineffective, while the quality of declining, causing rising public c
PROGRESS
Infant mortality rate
The infant mortality rate decli 2010. By 2011 it had reached 1 goal is14.8 percent, Vietnam is there is the high possibility that 4. 1).
A downward trend in child mo annual infant mortality reduc Nevertheless, the rate of redu
-10.0 20.0 30.0 40.0 50.0
1990 20
26
ild mortality rate
oal
reduce the under-five mortality rate by two thirds
ate and infant mortality rate declined from 58 ercent and 15.5 percent respectively by 2011. By ed at 15 percent, which is only 0.2 percent above on rate for measles substantially increased from 55
has remained above 90 percent ever since.
nts, Vietnam still faces great challenges with regar ldren to healthcare across regions, ethnicities and
e healthcare insurance for children under six year ty of child healthcare in terms of services, medicine blic concern.
eclined substantially from 44.4 percent in 1990 to ed 15.5 percent, and by 2012 it was at 15 percent m is only 0.2 percent from its target. If current prog that Vietnam will obtain its goal for reducing infant
Figure 4. 1: Infant mortality rate (%)
Source: GSO
mortality is apparent in all regions across the coun eduction rate during 2001-2011 was estimated reduction varies from area to area. The Central H
2000 2005 2010 2011
ds
percent and 44.4 By 2012, the infant ove the 2015 target. 55 percent in 1990
egard to inequitable nd income quintiles. ears of age remains icines and vaccines is
0 to 15.8 percent in cent. Given the 2015 rogress is sustained, fant mortality (Figure
ountry. The national ted at 1.3 percent. al Highlands has the