ESTIMATION OF OPTIMAL ENCODING LADDERS FOR TILED 360
°
VR VIDEO IN
ADAPTIVE STREAMING SYSTEMS
Cagri Ozcinar, Ana De Abreu, Sebastian Knorr, and Aljosa Smolic
Trinity College Dublin (TCD), Dublin 2, Ireland.
ABSTRACT
Given the significant industrial growth of demand for vir-tual reality (VR), 360◦ video streaming is one of the most important VR applications that require cost-optimal solu-tions to achieve widespread proliferation of VR technology. Because of its inherent variability of data-intensive content types and its tiled-based encoding and streaming, 360◦video requires new encoding ladders in adaptive streaming systems to achieve cost-optimal and immersive streaming experi-ences. In this context, this paper targets both the provider’s and client’s perspectives and introduces a new content-aware encoding ladder estimation method for tiled 360◦VR video in adaptive streaming systems. The proposed method first categories a given 360◦video using its features of encoding complexity and estimates the visual distortion and resource cost of each bitrate level based on the proposed distortion and resource cost models. An optimal encoding ladder is then formed using the proposed integer linear programming (ILP) algorithm by considering practical constraints. Exper-imental results of the proposed method are compared with the recommended encoding ladders of professional stream-ing service providers. Evaluations show that the proposed encoding ladders deliver better results compared to the rec-ommended encoding ladders in terms of objective quality for 360◦ video, providing optimal encoding ladders using a set of service provider’s constraint parameters.
Index Terms— 360◦ video, virtual reality, adaptive
streaming, encoding ladder, optimization
1. INTRODUCTION
Recent years have witnessed a significant industrial invest-ment in virtual reality (VR) technology that has motivated technical developments of graphic cards and head-mounted displays (HMDs) [4]. Currently, the video technology field is evolving toward providing immersive VR experiences us-ing 360◦ video streaming. 360◦ video is captured with om-nidirectional camera arrays and the individual camera views are projected onto a sphere. For backward-compatibility pur-poses with the existing video coding standards and stream-ing pipelines, the spherical videos are mapped onto a planar surface using projection techniques, such as equi-rectangular
Tiled 8K ERP Video 8K ERP Video
Spherical Video Encoding Ladder
...
...
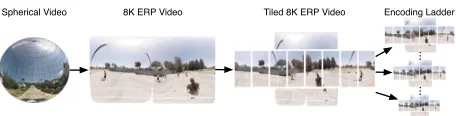
Fig. 1: Overview of the different formats and representations.
projection (ERP). ERP videos contain full panoramic 360◦ horizontal and 180◦vertical views of the scene.
360◦ video streaming is significantly challenging owing to its resource-intensive encoding and storage requirements to cope with the very high resolution of its representation. As the VR end-user can only view the field of view (FoV) of the display device (e.g.,HMD, smartphone, tablet or lap-top), called viewport, very high resolution of 360◦video (e.g.,
8K×4K ERP) is required for transmission in order to achieve high-quality and seamless video streaming experiences. To reduce both the bitrate consumption of the end-user and the visual distortion of the viewport, 360◦ video frames can be divided into self-decodable regions [14, 16], namely, tiles.
To deliver the tiled 360◦ videos to the end-user devices, adaptive streaming systems, such as MPEG-dynamic adap-tive streaming over HTTP (DASH) [18], provide smooth 360◦ video streaming experiences, but still require high encoding and storage costs for the tiled 360◦ video. Thespatial
re-lationship description(SRD) [22] can be used with DASH
systems where the 360◦video stream is divided into tiles. In the SRD, each 360◦ video is divided into a set of tiles that includes differentbitrate levelsof the tiled video. Different bitrate levels share the same video content but are encoded using various settings, such as the resolution and the target bitrate for encoding. Each different version is called a
repre-sentation, and a set of representations for the video content
forms theencoding ladderwhich is requested by the DASH client to play the tiled 360◦ video. However, encoding and accumulating a large combination of representations for each video content might cover a broad range of network band-widths such that the end-users can request video streams of appropriate bitrates, and thus it requires high encoding and storage costs [24]. Fig. 1 illustrates the different stages from the spherical projection to the encoding ladder with the dif-ferent representations of the ERP video.
[image:1.612.322.550.208.266.2]To tackle this problem, cost-optimal encoding ladders are needed for service providers to deliver tiled 360◦ video content and satisfy network bandwidths. In fact, tiled 360° video provides different rate-distortion (RD) performance compared to the traditional video content due to different characteristics of both. In particular, tiling affects the cod-ing efficiency, because redundancy cannot be exploited over tiles. Furthermore, given its 2D projection for encoding (e.g.,
ERP), each tile of the 360° video has a different level of contribution for the overall 360° video viewing quality due to stretching effects caused by the projection [10, 19]. To this end, new encoding ladder configurations are required for the tiled 360° videos to provide cost-optimal video streaming service for VR end-user devices.
Adaptive streaming systems must deal with issues of the delivery of the tiled 360◦ video from two different per-spectives, the service provider and the client. Most recent work focused on the client’s perspective [9, 13, 17, 20, 23, 26] without considering the service providers’ perspective. More clearly, they neither provide 360◦ video content-specific encoding ladders nor consider the resource costs of the con-tent delivery network (CDN), which is a cloud-based video streaming system that delivers videos to the edge servers so as to effectively connect to the end-users. Given the different characteristic of the tiled 360◦ video content (e.g., ERP and tile encoding), recommended encoding ladders for traditional videos [7, 11], that are currently used for adaptive streaming systems, might not achieve an acceptable quality of expe-rience (QoE) [12, 24] for the tiled 360◦ video. Using such encoding ladders might also waste CDN resources and the end-users’ bandwidth.
Our work aims to improve the performance of adaptive 360◦ video streaming systems, providing guidelines for the design of optimal 360◦ VR video streaming systems using tiles. To this end, we focus on the configuration of cost-optimal encoding ladders in adaptive streaming systems by considering both the provider’s and client’s perspective and develop an encoding ladder estimation method for tiled 360◦ video streaming, which is the main contribution of this work. To the best of our knowledge, such encoding ladder estima-tion method has not been studied yet. The proposed method deals with minimizing the distortion of the observed tiled 8K×4K ERP video content on the client side while reducing the resource costs on the service provider side, such as storage capacity utilization and computational costs for encoding. In this context, we categorize the given 360◦videos using their extracted features of encoding complexity, estimate their vi-sual distortion based on the developed distortion model, and calculate the resource costs using the proposed cost models. The cost-optimal encoding ladder configuration problem is then solved using the formulated integer linear programming (ILP) algorithm by considering practical constraints. Our evaluations show that the proposed cost-optimal encoding ladders using a set of service provider’s constraint
param-eters achieve better results compared to the recommended encoding ladders in terms of objective quality for 360◦.
The remainder of this paper is organized as follows. Re-lated work is detailed in Section 2. Then, the proposed system model is presented in Section 3. Experiments to demonstrate the performance of our proposed method are presented in Sec-tion 4. Finally, SecSec-tion 5 concludes this paper with a summary and future work.
2. RELATED WORKS
To define the most suitable encoding ladder for traditional video, an unique encoding ladder for each given video con-tent is generated for instance by the engineers at Netflix using the brute-force search algorithm [7]. In their research work, each quality-resolution pair was plotted for a given content at each bitrate level. An upper convex hull of its RD curve was then selected to define the encoding ladder. Their approach is very effective concerning QoE for traditional video content. However, it is neither cost-optimal in the sense of resource consumption of a CDN nor content-specific and optimized for tiled 360◦videos.
Similarly, academic researchers demonstrated that the previously defined fixed encoding ladders such as Apple’s and Netflix’s one-size-fits-all schemes [7, 11], have critical weaknesses for traditional video content as described in [27]. Here, the authors defined an optimal encoding ladder for each video category to improve the performance of adaptive streaming for traditional videos. The problem was formulated as an optimization algorithm to find the best bitrate ladder for the given videos by considering the characteristics of a set of end-users in a given database without considering encoding and storage costs. The results have shown, however, that the fixed encoding ladders cannot provide the best objective quality for given traditional videos and clients’ bandwidth.
described the principles of adaptive streaming of 360° video using tiles and evaluated their system with respect to bitrate overhead, bandwidth, and quality requirements. However, none of these works are dealing with cost-optimal encoding ladders on the service provider’s side to reduce storage capac-ity utilization and computational costs.
3. PROPOSED SYSTEM MODEL
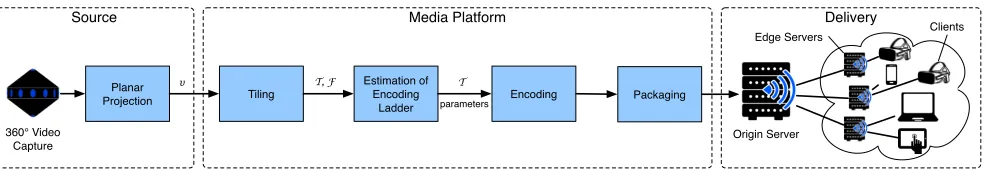
We consider a cloud-based video-on-demand 360◦ video streaming pipeline for VR as depicted in Fig. 2. Each cap-tured 360◦spherical video is mapped to the ERP representa-tion in 8K×4K resolution for encoding purposes at the source node. The media platform divides each ERP video intoN
tiles and estimates an unique cost-optimal encoding ladder. Each tile is then encoded at various bitrate levels using mul-tiple encoders with estimated cost-optimal encoding ladder parameters. Then, the generated bitstreams are divided into a set of chunks with equal playback duration, encapsulated by the packaging node and eventually stored on the origin server. Each stored content is then deployed to the CDN, where the bitstreams are efficiently distributed to the VR end-users through the edge servers.
Each end-user device contains the tiled DASH-VR player [23] to communicate with the edge servers and to request in-dividual tiles with appropriate bitrate levels and resolutions from the encoding ladder depending on the bandwidth avail-ability of the network. For adaptive streaming purposes, a set of tiles is encoded at the media platform using different encoding settings. More precisely, letvbe an 8K×4K ERP 360° video in the set of videosV. Eachvis split intoN tiles, each tilej, j ∈ T, is then encoded at a different bitrate bj
and resolutionrj =wj×hj. Hence, the quadruple (v,j,b,r)
corresponds to a representation of the videov∈ Vfor the tile
j ∈ T, encoded at a target bitrateb ∈ Band spatial resolu-tionr ∈ R. Note thatv,j,b, andrare integer values and represent the indices of their corresponding sets.
In this context, encoding and accumulating all combina-tions of the quadruple (v,j,b,r) might be very expensive for service providers. Therefore, a cost-effective optimization is required in order to minimize the service provider’s re-source costs while providing cost-optimal and high quality 360° video streaming experience.
For this aim, the proposed estimation method contains four main parts: classification of the content type, distortion modeling, cost modeling, and problem formulation. First, we extract spatial and temporal features (fspa andftmp) of the v-th video to classify its content type as described in subsec-tion 3.1. Then, we perform an automatic estimasubsec-tion proce-dure for the encoding ladder using distortion and cost models for the tiledv-th video as detailed in subsections 3.2 and 3.3, respectively. Again, in this encoding ladder estimation pro-cess we consider both the client side (quality distortion) and service provider side (resource costs). Finally, we formulate
the cost-optimal estimation problem for the encoding ladder by applying certain practical constraints, which is eventually solved using the proposed ILP algorithm as described in sub-section 3.4.
3.1. Classification of the content type
To classify the content type from a given set of content types
O, spatial fspa and temporal ftmp complexity features are
extracted from the videos. As each video v has different RD performances at various resolutions, we can identify two sources of video distortion: spatial down-sampling and quan-tization. As a down-sampled version ofvsuffers from spatial information loss, the level of information loss depends on the
spatial complexityof each video, which is one of the
encod-ing complexity features. Moreover, the high-resolution ver-sion of a givenv requires a larger amount of bits to reduce its visual distortion. Compared to its low-resolution version, the high-resolution version has a higher sensitivity for unpre-dictable motions, which requires further residuals to avoid visual distortions. Since predicted residuals are compressed through quantization which results in quality distortions,
tem-poral complexityis the second encoding complexity feature.
The content typeo of each video is then determined from a givenOby classification using the extracted two complexity features.
To extract the feature setF ={fspa, ftmp}, we use the
constant rate factor (CRF) encoding. The CRF encoding, un-like the constant quantization parameter (QP)-based encod-ing, has the QPs slightly varied across the time based on the scene complexity, action, and motion. For instance, when a scene contains a lot of action and motion, a higher compres-sion can be applied by raising the QP in order to save bitrates. Therefore, the feature setF can be extracted from the CRF encoded stream to identify the encoding complexity of each
v. For this purpose, the average size of I- and P- frames can be used as main indicators to determine the complexity features. As also demonstrated in [8], the size of I-frames expresses the spatial complexity of eachv. Thus, we use the normalized version of the I frame sizes to estimatefspafor a given video.
As the average size of P frames characterizes the amount of residual bits, we use the ratio of the size of P frames over the size of I-frames as the indicator forftmp.
3.2. Distortion modeling
Media Platform Delivery Source
Planar
Projection Tiling
Estimation of Encoding
Ladder
Encoding Packaging
T T, F
!
Origin Server
Edge Servers Clients
360° Video Capture
parameters
Fig. 2: Schematic diagram of a cloud-based video streaming pipeline for VR which includes source, media platform, and
delivery of the tiled 360◦video content.
algorithm (e.g.,Netflix’s work in [7]). To this end, we derive a distortion function by fitting the two-term power series model using the following fit function:
F TogB =kogZ
Ωog
B + Φog, (1)
wherek,Ω, and Φare fitting parameters used in the curve fitting operation for theo-th content type,o ∈ O andO =
{o1, o2, . . . , o|O|}, of the g-the resolution,g ∈ G andG =
{g1, g2, . . . , g|G|}, at the tiled ERP video bitrateB. Note that
Z is the value of the total bitrate of the tiled 360° video in terms of Mbps (i.e., total bitrate of the ERP video recom-posed of the tiles with bitrateB). These parameters for the proposed distortion model, shown in Table 1, were found us-ing the curve fittus-ing operator. Note that index number ofoand
gare listed in ascending order of their size. The target resolu-tion size is 8K×4K. For the sake of simplicity and also a lack of variety of 8K 360° video content types, we only distin-guish between three content types and resolutions. Each row and column number of the fitting parameters in the table rep-resents a different content type and resolution, respectively.
To better reflect the distortion of the 360° video at the clients’ side, we estimate the distortion, caused by the map-ping of the spherical content onto the planar surface of the de-vices (spherical distortion), of the tiled 360° video as a target value in the curve fitting using the
weighted-to-spherically-uniform mean square error(WS-MSE) [19]. WS-MSE
mea-sures the spherical surface using a non-linear weighting in the MSE calculation. Such weights are calculated using the stretching ratio of the area that is projected from the planar surface to the spherical surface. The noise power for thei-th representation of thej-th tile,dij, can be formulated as
fol-lows:
dij = P
x∈W P
y∈H
(tj(x, y)−˜tij(x, y))2qj(x, y)
P
x∈W P
y∈H qj(x, y)
, (2)
whereW ×H is the resolution of the reconstructed version of the ERP 360° video. Note thatxandy denote the pixel coordinates of the ERP video,tand˜t stand for the original
(i.e.,uncompressed) and reconstructed versions of thej-th tile
andqj(x, y)represents the weighting intensity in (x,y) of the
weight distribution of the ERP fortjwhich can be calculated
according to [19] with:
qj(x, y) =cos
(y+ 0.5−H/2)π
H . (3)
3.3. Cost modeling
In this subsection, we develop cost models for the cloud-based video streaming system in order to minimize the re-source costs for encoding workload and storage capacity uti-lization at the service providers’ side.
3.3.1. Encoding cost
The encoding cost is one of the most expensive computing costs which usually occurs on the cloud servers and which heavily depends on the video resolution. To calculate encod-ing costs, we consider thebroken-line modelwhere the same cost is defined for similar resolutions. To this end, we ex-tend the cost calculation model used by the Amazon cloud service [28] in order to consider broad range of resolution sizes. The encoding costcecan be described for thej-th tile of thei-th representation as follows:
ceij =
µe, rij ≤720p
2µe, 720p < rij ≤1080p
4µe, 1080p < rij≤4K
8µe, 4K < rij≤8K
(4)
whereµeis a constant term for the encoding cost defined by
the service provider andrijis the resolution of thej-th tile in
thei-th representation.
3.3.2. Storage cost
[image:4.612.64.557.73.158.2]ResolutionG g1 g2 g3
Model Distortion Data size Distortion Data size Distortion Data size
k Ω Φ k Ω Φ k Ω Φ k Ω Φ k Ω Φ k Ω Φ
Content typeO
o1 1809 -0.6959 5.649 0.7613 0.9901 52.54 4002 -0.7558 2.723 0.8005 0.9859 52.25 1829 -0.5587 -3.266 0.8264 0.9846 214.9
o2 220.1 -0.3583 6.447 0.6467 1.003 29.36 191.9 -0.2763 -5.728 0.6078 1.009 71.15 480.6 -0.3643 -5.728 0.5654 1.015 269
[image:5.612.340.561.317.467.2]o3 820.4 -0.4702 6.2 0.6631 1.001 10.69 643 -0.3825 -2.625 0.6691 1 17.46 616.9 -0.2837 -23.78 0.5943 1.012 203.8 Table 1: Curve fitting parameters for the proposed distortion and data size estimation models.
csfor thej-th tile of thei-th representation can be described
as follows:
csij=µsbsij, (5)
whereµs is a constant term for storage cost defined by the
service provider andbsijis the estimated data size of thej-th
tile in thei-th representation. The data size for eachjtile is estimated using the curve fitting technique similar to the one used for Eq. (1). Parameters for the equation, shown in Ta-ble 1 (Data Size), were found using the curve fitting operator.
3.4. Problem formulation
In order to obtain the cost-optimal encoding ladderL∗ for a given video, a set of representations forL∗is chosen from the set of the estimated representationLthat minimize both the total spherical quality distortion of tiles and the total resource cost of the cloud-based streaming system. For this purpose, we formulate the problem as an optimization problem using the following practical constraints:
(I) Bandwidth: In the proposed system, we consider that
the encoding ladder needs to cover a set of given net-work bandwidth profilesP = {p1, p2, . . . , p|P|} with their minimumBminand maximumBmaxbandwidth
ranges.
(II) Computational and storage costs: We set limits for
the encoding and storage costs which are the maximum allowed computational cost Cmax and storage cost
Smaxof the streaming system.
(III) Encoding rate: The bitrate levels of the representa-tions should be spaced between each other by the min-imum step sizeτ.
Our objective is to provide a low-quality distortion en-coding ladder for a given tiledv at minimum resource costs by considering the above described constrains. Thus, we for-mulate the optimization problem as follows:
L∗: argmin L
X
i∈L
X
p∈P
(γci+ (1−γ)di)aip (6)
with
ci= X
j∈T
(ceij+csij) ci∈ P (7)
and
di= X
j∈T
dij, (8)
wherecianddiare the total resource cost and quality
distor-tion for thei-th representation, respectively. In order to have a trade-off betweencianddi, we introduce a pre-defined
con-stantγ ∈ [0,1]to be assigned by the service-provider. To cover a wide range of network bandwidths, we introduce a set of network bandwidth profiles in the problem definition. The decision variableaip ={0,1}indicates if thei-th bitrate level
for thep-th profile of a set of network bandwidth profilesP
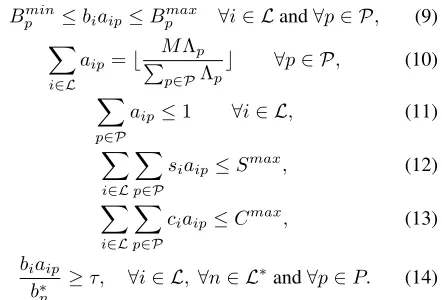
is includedorexcluded in the encoding ladder for a givenv. Equation (6) minimizes both the overall distortion of the tiled 360° video and resource costs of the cloud-based stream-ing system and is subject to the followstream-ing constraints:
Bpmin≤biaip≤Bpmax ∀i∈ Land∀p∈ P, (9)
X
i∈L
aip=b MΛp P
p∈PΛp
c ∀p∈ P, (10)
X
p∈P
aip ≤1 ∀i∈ L, (11)
X
i∈L
X
p∈P
siaip≤Smax, (12)
X
i∈L
X
p∈P
ciaip≤Cmax, (13)
biaip b∗
n
≥τ, ∀i∈ L, ∀n∈ L∗and∀p∈P. (14)
Equation (9) addresses Constraint (I) for eachp. Equa-tion (10) sets the maximum number of representaEqua-tions in the encoding ladder for the p-th profile based on its weighting factorΛ and the total number of representations M in the encoding ladder. The weighting factor Λ for each network profile is shown in Table 2. The constraint of Equation (11) avoids the selection of the same representation for each pro-file. Additionally, Equations (12) and (13) satisfy Constraint (II) by ensuring that encoded videos for estimated encoding ladders cannot exceedSmaxandCmax. Equation (14) satis-fies Constraint (III) by ensuring that the target bitrate of each selected representationnin theL∗ is spaced by a minimum step sizeτ.
4. EXPERIMENTAL RESULTS
4.1. Setup
We use as the following six 8K×4K resolution 360° ERP video test sequences:V={Train,Stitched left Dancing360 8K,
Basketball, KiteFlite, ChairLift, SkateboardInLot} [2, 3, 5].
Each v ∈ V was split intoN = 10 tiles which was ob-tained as an optimal number in our previous research work in [23]. The encoded bitrate for each tile is equally dis-tributed by dividing thetarget bitrateto the N tiles. Their encoding complexity features and assigned content types are shown in Table 3, which was estimated using the described method in the Section 3.1. Three content types in the set,
O = {o1, o2, o3}, were used to classify the videos using
the estimated complexity features. The Train, Basketball,
andChairLift sequences were used to model the curve
fit-ting function in Equation (1) and we evaluate our method using theStitched left Dancing360 8K,KiteFlite, and
Skate-boardInLotvideo sequences. Further, three different
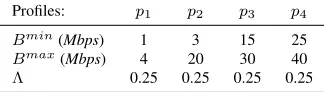
resolu-tionsG={3072×1536,4096×2048,8192×4096}in the encoding ladders and four different bandwidth profilespwere used as defined in Table 2 with minimumBmin and
maxi-mum Bmax bandwidth ranges, and Λ for each bandwidth
profile.
Profiles: p1 p2 p3 p4
Bmin(Mbps) 1 3 15 25
Bmax(Mbps) 4 20 30 40
[image:6.612.95.257.355.401.2]Λ 0.25 0.25 0.25 0.25
Table 2: Network bandwidth profiles.
We focus on the browser-based video streaming use-case which is one of the core experiments in the ongoing standard-ization activity [21]. Since AVC is the only implemented de-coder in current available browsers which can support HMDs, we apply the H.264/AVC standard in our experiments. In this context, we encoded videos using the FFmpeg software (ver.
N-85291) [1] with two-pass and 200 percent constrained vari-able bitrate encoding configurations. At this stage, it is im-portant to mention that our proposed method is video codec agnostic; it can be easily utilized with different video coding standards.
Sequence fspa ftmp O
Train 0.977 0.065
o1
Stitched left Dancing360 8K 0.884 0.110
Basketball 0.843 0.090
o2
KiteFlite 0.861 0.090
ChairLift 0.789 0.212
o3
SkateboardInLot 0.827 0.521
Table 3: Encoding complexity features and assigned content
types for the used test sequences.
To evaluate our proposed method, the objective quality metrics WS-MSE and WS-PSNR [19] were utilized to
calcu-late the quality performance of the 360° video. Further, three different one-size-fits-all encoding ladders (i.e.,Apple [11], Axinom [25], and Netflix [7]), which are recommended for traditional videos, were used as references to investigate the quality performance of our proposed method. Table 4 shows three reference one-size-fits-all encoding ladders for their three ERP resolutions and four total target encoding rates. In the table, resolutions and target encoding rate were calculated by summation of each tile’s resolution and target encoding rate, respectively.
4.2. Performance evaluation
Encoding ladders for our proposed method have been esti-mated by solving the formulated ILP algorithm in Section 3.4 using Pyomo (ver. 5.0) [15]. We setµeandµsto0.017and
0.023, respectively. These cost values are same as the real cost values in [28].
To derive the distortion function in Equation (1), we cal-culated the WS-MSE versus bitrate (inMbps) performance graphs in Fig. 3 for each resolution of the videosTrain,
Bas-ketball, and ChairLift. The results demonstrate the various
performances due to the high diversity in video content char-acteristics. As can be seen in the figure, each content type has various content dependencies for each encoding resolu-tion and bitrate. For instance, the Train sequence (content typeo1), which contains the lowest complex encoding
fea-tures, achieves a low distortion score compared to content typeso2ando3. Because of such diversity, one-size-fits-all
schemes, which are used by almost all research works, can-not provide cost-optimal and high-quality streaming perfor-mances for the tiled 360° videos.
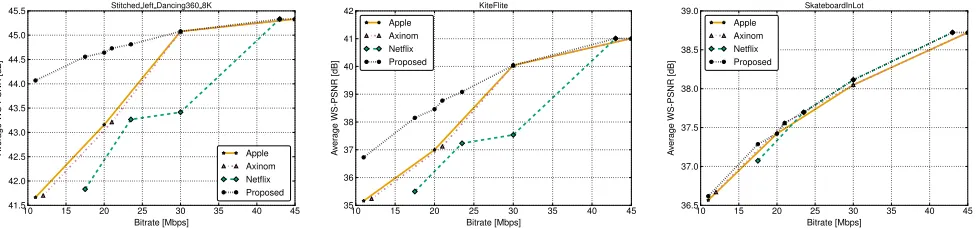
Evaluation I: To evaluate the RD performance gain of
our encoding ladder estimation solution, we compare our pro-posed method with three different recommended one-size-fits-all schemes of the streaming service providers. As these ladders were estimated without considering constraints, we setγ = 0(in order to focus on distortion only) and exclude other constraints in equations between (9) and (13) for a fair comparison in this test.
Figure 4 shows the RD curves computed with average WS-PSNR for the Stitched left Dancing360 8K, KiteFlite,
andSkateboardInLot sequences. The results show that our
proposed method considerably increases the objective video quality (i.e., WS-PSNR) compared to the one-size-fits-all schemes at all times. In particular, the proposed method demonstrates high bitrate savings between 10-30Mbps band-width ranges for the content typeso1ando2. To this end, we
notice that one-size-fits-all schemes provide high scores for the content typeo3compared to their scores for content types
o1ando2.
Evaluation II:We further analyze the performance gain
Apple[11] Axinom[25] Netflix[7]
Z(Mbps) W×H Z(Mbps) W×H Z(Mbps) W×H
45 8192×4096 45 8192×4096 43 8192×4096
30 8192×4096 30 8192×4096 30 4096×2048
20 4096×2048 21 4096×2048 23.5 4096×2048
[image:7.612.162.452.72.138.2]11 3072×1536 12 3072×1536 17.5 3072×1536
Table 4: Recommended one-size-fits-all encoding ladders for traditional videos by service providers.
0 5 10 15 20 25 30 35 40 45 Bitrate [Mbps]
5
10
15
20
25
30
35
A
v
er
age
WS-MSE
Train
8192x4096 4096x2048 3072x1536
0 5 10 15 20 25 30 35 40 45 Bitrate [Mbps]
5
10
15
20
25
30
35
A
v
er
age
WS-MSE
Basketball
8192x4096 4096x2048 3072x1536
0 5 10 15 20 25 30 35 40 45 Bitrate [Mbps]
5
10
15
20
25
30
35
A
v
er
age
WS-MSE
ChairLift
8192x4096 4096x2048 3072x1536
Fig. 3: Average WS-MSE - bitrate curves for sample 8K×4K ERP 360° videos with different content type.
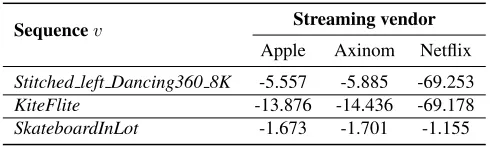
In this manner, the bitrate difference,i.e. BD-rate, was cal-culated in percentage averaged over the entire range. A neg-ative BD-rate indicates a decrease of bitrate at the same qual-ity. From the table, we can notice that the proposed method provides considerable bitrate savings compared to the recom-mended encoding ladders at the same bitrates.
Sequencev Streaming vendor
Apple Axinom Netflix
Stitched left Dancing360 8K -5.557 -5.885 -69.253
KiteFlite -13.876 -14.436 -69.178
SkateboardInLot -1.673 -1.701 -1.155
Table 5: BD-rate saving (%) of the proposed method.
Evaluation III:Finally, in the last set of evaluations, we consider a scenario where the constraints ofSmaxandCmax
are8000,τ = 1.2, andM = 12. In this setup, we use the nor-malized difference of the total cost∆CS and the distortion ∆DS (in terms of WS-MSE) in percentages for evaluation purpose. Table 6 shows the results of the proposed encoding ladder estimation using resolution-bitrate pairs forγ= 0,γ= 0.1, andγ= 0.5.
From the results, we observe that the lowest complex con-tent, i.e., content type o1, increases its encoding resolution
and decreases its target encoding rate at the range between
i= 2andi= 10to reduce the total cost by considering cost and distortion tradeoffs usingγ = 0.1 and γ = 0.5. On the other hand, we observe that the most complex content,i.e.
content typeo3, decreases both its encoding resolution and
target encoding rate in order to reduce the total cost by con-sidering cost and distortion tradeoffs using theγ= 0.1 andγ
= 0.5. Table 7 reports the total cost saving and distortion gain with respect to differentγ. Finally, we would like to mention that, the GNU linear programming kit (GLPK) for Pyomo was
able to solve the formulated ILP algorithm in Section 3.4 us-ing the calculated data in less than one minute on Intel(R) Core(TM) i7-6700 CPU @ 3.40GHz with 32 GB of RAM.
5. CONCLUSIONS
This paper introduced a novel encoding ladder estimation method for tiled 360◦ video streaming systems, considering both the provider’s and client’s perspectives. To this end, the objective of our proposed method was to provide cost-optimal and enhanced video streaming experiences for VR end-users. The developed system included classification of the content type, distortion modeling, cost modeling, and problem for-mulation. The performance of our proposed method was verified in experimental evaluations. The results showed that our method achieved significant bitrate savings (especially for the content typeso1ando2) compared to the
one-size-fits-all encoding ladders which are recommended by streaming service providers. Furthermore, the developed method can automatically find cost-optimal encoding ladders using sev-eral practical constraints, and provides efficient streaming service for tiled 360◦ video. As future work, we plan to ex-tend our optimization framework by considering the number of tiles for a given content type and investigating the effect of total costs by evaluating the effects of the various constraint parameters using a larger set of video sequences.
References
[1] VideoLAN, 2017.
[2] A. Abbas and B. Adsumilli, Ahg8: New gopro test sequences for virtual reality video coding, Technical Report JVET-D0026, JTC1/SC29/WG11, ISO/IEC, Chengdu, China, 2016.
[image:7.612.74.534.173.260.2] [image:7.612.53.298.377.450.2]10 15 20 25 30 35 40 45 Bitrate [Mbps]
41.5 42.0 42.5 43.0 43.5 44.0 44.5 45.0 45.5
A
v
er
age
WS-PSNR
[dB]
Stitched left Dancing360 8K
Apple Axinom Netflix Proposed
10 15 20 25 30 35 40 45
Bitrate [Mbps] 35
36 37 38 39 40 41 42
A
v
er
age
WS-PSNR
[dB]
KiteFlite
Apple Axinom Netflix Proposed
10 15 20 25 30 35 40 45
Bitrate [Mbps] 36.5
37.0 37.5 38.0 38.5 39.0
A
v
er
age
WS-PSNR
[dB]
SkateboardInLot
Apple Axinom Netflix Proposed
Fig. 4: Performance comparison using the RD curves computed with the average WS-PSNR.
Sequencev γ Representationi
1 2 3 4 5 6 7 8 9 10 11 12
Stitched left Dancing360 8K
0.0 (g1,1.47) (g1,1.78) (g1,2.15) (g1,3.8) (g1,4.6) (g1,5.6) (g2,10.84) (g2,13.11) (g2,15.87) (g2,28.11) (g3,34.01) (g3,41.15)
0.1 (g2,1.34) (g2,1.61) (g2,1.95) (g2,2.60) (g3,3.14) (g3,3.80) (g3,6.12) (g3,7.40) (g3,8.96) (g3,17.45) (g3,21.12) (g3,25.55)
0.5 (g2,1.00) (g2,1.21) (g2,1.47) (g2,2.36) (g3,2.86) (g3,3.46) (g3,6.12) (g3,7.40) (g3,8.96) (g3,17.45) (g3,21.12) (g3,25.55)
KiteFlite
0.0 (g1,1.47) (g1,1.78) (g2,2.15) (g2,3.80) (g2,4.60) (g3,5.56) (g3,10.84) (g3,13.11) (g3,15.87) (g3,28.11) (g3,34.01) (g3,41.15)
0.1 (g1,1.47) (g1,1.78) (g2,2.15) (g2,3.80) (g2,4.60) (g3,5.56) (g3,6.73) (g3,8.14) (g3,9.85) (g3,17.45) (g3,21.12) (g3,25.55)
0.5 (g1,1.00) (g1,1.21) (g1,1.47) (g2,2.36) (g2,2.86) (g2,3.46) (g3,6.12) (g3,7.40) (g3,8.96) (g3,17.45) (g3,21.12) (g3,25.55)
SkateboardInLot
0.0 (g1,1.47) (g1,1.78) (g1,2.15) (g1,3.80) (g1,4.60) (g1,5.56) (g2,10.84) (g2,13.11) (g2,15.87) (g2,28.11) (g3,34.01) (g3,41.15)
0.1 (g1,1.47) (g1,1.78) (g1,2.15) (g1,2.86) (g1,3.46) (g1,4.18) (g1,6.12) (g1,7.40) (g1,8.96) (g1,17.45) (g2,21.12) (g2,25.55)
[image:8.612.66.554.73.188.2]0.5 (g1,1.21) (g1,1.47) (g1,1.78) (g1,2.36) (g1,2.86) (g1,3.46) (g1,6.12) (g1,7.40) (g1,8.96) (g2,17.45) (g2,21.12) (g2,25.55)
Table 6: Results of the proposed encoding ladder estimation forγ= 0,γ= 0.1, andγ= 0.5.
Sequencev ∆cost (%) ∆distortion (%)
γ= 0.1 γ= 0.5 γ= 0.1 γ= 0.5
Stitched left Dancing360 8K 37.463 39.683 -13.628 -42.914
KiteFlite 33.165 39.206 -9.564 -25.326
[image:8.612.53.560.212.311.2]SkateboardInLot 37.214 38.884 -8.977 -15.26
Table 7: Total cost saving and distortion gain with respect to
γ=0.0.
[4] Augmented and Virtual Reality Market Report,Augmented and virtual reality market expected to reach $59,511 million, globally, by 2022, Allied Market Research, 2017.
[5] G. Bang, G. Lafruit, and M. Tanimoto,Description of 360 3D video application exploration experiments on divergent multiview video, Technical Report MPEG2015/ M16129, ISO/IEC JTC1/SC29/WG11, Chengdu, CN, 2016.
[6] G. Bjøtegaard,Calculation of average PSNR differences between RD-curves (vceg-m33), Technical Report M16090, VCEG Meeting (ITU-T SG16 Q.6), Austin, Texas, USA, 2001.
[7] Netflix Technology Blog, Per-title encode optimization, 2015. Ac-cessed: 2017-4-27.
[8] C. Chen, S. Inguva, A. Rankin, and A. Kokaram,A subjective study for the design of multi-resolution abr video streams with the vp9 codec, Electronic Imaging2016(2016), no. 2, 1–5.
[9] X. Corbillon, A. Devlic, G. Simon, and J. Chakareski, Viewport-adaptive navigable 360-degree video delivery, arXiv:cs.MM 1609.08042 cs.MM (2017May.), no. 1609.08042, 1–7, available at1609.08042.
[10] Look around you: Saliency maps for omnidirectional images in vr ap-plications (Erfurt, 2017May)
[11] Apple Developer,General authoring requirements, 2016. Accessed: 2017-6-04.
[12] Quality of experience and http adaptive streaming: A review of subjec-tive studies (2014Sept)
[13] Towards bandwidth efficient adaptive streaming of omnidirectional video over http: Design, implementation, and evaluation (New York, NY, USA, 2017)
[14] Efficient representation and interactive streaming of high-resolution panoramic views (September 2002)
[15] W. E. Hart, C. Laird, J. Watson, and D. L. Woodruff, Pyomo-optimization modeling in python, Vol. 67, Springer, 2012.
[16] Representation, coding and interactive rendering of high-resolution panoramic images and video using MPEG-4 (Berlin, Germany, 2005Feb.)
[17] Adaptive 360 VR video streaming: Divide and conquer! (2016Sep) [18] ISO/IEC 23009-1,Information technology — dynamic adaptive
stream-ing over HTTP (DASH) — part 1: Media presentation description and segment formats, ISO/IEC JTC1/SC29/WG11, 2014.
[19] JVET, AHG8: WS-PSNR for 360 video objective quality evalua-tion, Technical Report JVET-D0040, JTC1/SC29/WG11, ISO/IEC, Chengdu, CN, 2016.
[20] Tiled-based adaptive streaming using MPEG-DASH (New York, NY, USA, 2016)
[21] MPEG-DASH,Descriptions of core experiments on DASH amendment, Technical Report MPEG2016/ N16224, JTC1/SC29/WG, ISO/IEC, Geneva, Switzerland, 2016.
[22] MPEG DASH SRD: Spatial relationship description (2016)
[23] Viewport-aware adaptive 360 video streaming using tiles for virtual re-ality (2017Sep)
[24] J. L. Ozer,Video encoding by the numbers: Metric-based encoding, Do-ceo Publishing, 2016.
[25] S. Saares,General purpose media format, Technical Report 7, Axinom, Germany, 2016.
[26] Tile based HEVC video for head mounted displays (San Jose, CA, USA, 2016Dec)
[27] Optimal set of video representations in adaptive streaming (New York, NY, USA, 2014)
[image:8.612.52.299.342.403.2]