GARCH Model with Jumps:
Testing the Impact of News Intensity
on Stock Volatility
Sergei P. Sidorov, Andrey Revutskiy, Alexey Faizliev, Eugene Korobov, Vladimir Balash
Abstract—The emphasis of the paper is on assessing the added value of using news analytics data in improving the explanatory power of the GARCH–Jump model. Based on empirical evidences for some of FTSE100 companies, the paper examines two GARCH models with jumps. First we consider the well-known GARCH model with jumps proposed in [1]. Then we introduce the GARCH-Jumps model augmented with news intensity and obtain some empirical results. The main assumption of the model is that jump intensity might change over time and that jump intensity depends linearly on the number of news (the news intensity). The comparison of the values of log likelihood supports the hypothesis of impact of news on jump intensity of volatility.
Index Terms—stock volatility modelling, GARCH models, news analytics.
I. INTRODUCTION
Empirical studies based on the log return time series data of some stocks showed that serial dependence is present in the data; volatility changes over time; distribution of the data is heavy-tailed, asymmetric and therefore not Gaussian. These facts show that a random walk with Gaussian incre-ments is not a very realistic model for financial time series. The ARCH (Autoregressive Conditionally Heteroscedastic) model was introduced by Engle in 1982 [2]. In the model it is supposed that the conditional variance (squared volatility) is not constant over time and shows autoregressive structure. This model is a convenient way of modeling time-dependent conditional variance. Some years later, Bollerslev [3] gen-eralized this model as the GARCH model (Gengen-eralized Autoregressive Conditional Heteroscedasticity). A distinctive feature of the modern financial series is the presence of jump dynamics of asset prices. One of the models describing this behavior is GARCH model with jumps was proposed in [1]. Recent studies on the volatility of stock returns have been dominated by time series models of conditional heteroscedas-ticity and have found strong support for ARCH-GARCH-type effects. However, ARCH-GARCH-ARCH-GARCH-type models do not provide a theoretical explanation of volatility or what, if any, the exact contributions of information flows are in the volatility-generating process.
Different measures of information arrivals were employed in variety of empirical studies in order to test the impact of the rate of information on the market volatility:
• macroeconomic news, in the paper [4];
Manuscript received January 11, 2014; revised February 11, 2014. This work was supported by the Russian Fund for Basic Research (Grant 13-010-0175).
S. P. Sidorov, A. Revutskiy, A. Faizliev, E. Korobov, V. Balash are with Saratov State University, Saratov, Russian Federation. e-mail: [email protected]
• the number of daily newspaper headlines and earnings announcements, in the paper [5];
• the number of specific stock market announcements, in the paper [6].
In the papers [7], [8] volatility of log returns depends on the intensity of news flow on market directly. It is worth to be mentioned the works [9] and [10]. In the paper of [9] firm-specific announcements were used as a proxy for information flows. It was shown that there exists a positive and significant impact of the arrival rate of the selected news variable on the conditional variance of stock returns on the Australian Stock Exchange in a GARCH framework. They split all their press releases into different categories according to their subject. In the second of the papers the author examines impact of news releases onindexvolatility, while in our work we analyze the impact on stock volatility following study of [9]. However, we restrict our choice by some of the FTSE100 companies, while [9] considered some French companies.
In the papers [11] and [12] authors analyze the impact of extraneous sources of information (viz. news and trade volume) on stock volatility by considering some augmented Generalized Autoregressive Conditional Heteroscedasticity (GARCH) models. Following the study of [13], it was supposed that trading volume can be considered as a pro-portional proxy for information arrivals to the market. Also it was considered the daily number of press releases on a stock (news intensity) as an alternative explanatory variable in the basic equation of GARCH model.
II. MODELSDESCRIPTION
LetXtbe the log return of a particular stock or the market
portfolio from time t−1 to time t. Let It−1 denote the past information set containing the realized values of all relevant variables up to time t−1. Suppose investors know the information in It−1 when they make their investment decision at timet−1. Then the relevant expected returnµt
to the investors is the conditional expected value ofXt, given
It−1, i.e.
µt=E(Xt|It−1).
The relevant expected volatilityσ2
t to the investors is
condi-tional variance of Xt, givenIt−1, i.e.
σ2t =V ar(Xt|It−1).
Then
t=Xt−µt
is the unexpected return at time t.
A. GARCH model
We recall ( [3]) that a process (t) is said to be the
generalized autoregressive conditionally heteroscedastic or GARCH(1,1) process if t = σtut, t ∈ Z, where (σt) is
a nonnegative process such that
σt2=ω+α2t−1+βσ2t−1, (1)
and (ut) is a sequence of i.i.d. random variables such that
ut∼N(0,1).
In the model,αreflects the influence of random deviations in the previous period on σt, whereas β measures the
part of the realized variance in the previous period that is carried over into the current period. The sizes of the parametersαandβdetermine the short-run dynamics of the resulting volatility time series, i.e. the sum α+β of these parameters reflects the degree of persistence. Large ARCH error coefficients α mean that volatility reacts intensely to market movements, while large GARCH lag coefficients β indicate that shocks to volatility persist over time.
B. GARCH model with Jumps
GARCH–Jumps model with constant jump intensity was proposed and studied in [1]. In GARCH–Jumps model it is supposed that news process have two separate components (normal and unusual news), which cause two types of inno-vation (smooth and jump-like innoinno-vations):
t=1,t+2,t. (2)
These two news innovations have a different impact on return volatility. It is assumed that the first component 1,t reflects
the impact of unobservable normal news innovations, while the second one2,t is caused by unusual news events.
The first term in (2) reflects the impact of normal news to volatility:
1,t=σtut, t∈Z, (3)
where(un)be a sequence of i.i.d. random variables such that
ut ∼ N(0,1), (σt) is a nonnegative GARCH(1,1) process
such that
σ2t =α0+α1
2
t−1+β1σ 2
t−1 (4)
andα0, α1, β1>0. Note thatE(1,t|It−1) = 0.
The second term in (2) is a jump innovation with
E(2,t|It−1) = 0. The component 2,t is a result of
unex-pected events and is responsible for jumps in volatility. The distribution of jumps is assumed to be Poisson distri-bution. Letλbe intensity parameter of Poisson distribution. Denotenta number of jumps occurring between timet−1
andt. Then conditional density ofnt is
P(nt=j|It−1) =
exp(−λ)λj
j! , j= 0,1, . . . . (5)
In this paper we suppose that the intensity parameterλis constant over time.
The development of GARCH–Jumps model of [1] can be found in the papers [14] and [15], where it is assumed that the conditional jump intensity, i.e. the expected number of jumps occurring between time t−1 and t conditional on information It−1, is autoregressive and related both to the last period’s conditional jump intensity and to an intensity residual.
C. GARCH Model with Jumps Augmented with News Ana-lytics Data
Many investment companies in the U.S. and Europe have been using news analytics to improve the quality of its business [16]. Interest in news analytics is related to the ability to predict changes of prices, volatility and trading volume on the stock market [17]. News analytics uses some methods and technics of data mining [18] and relies on methods of computer science, artificial intelligence (includ-ing algorithms for natural language process(includ-ing), financial engineering, mathematical statistics and mathematical mod-eling. News analytics software signalize traders about the most important events or send their output data directly to automated trading algorithms, which take into account this signals automatically during the trade.
We are going to analyze the impact of news process intensity on stock volatility by extending GARCH–Jumps model in [1]. The main assumption of the model is that jump intensity might change over time and that jump intensity de-pends linearly on the news intensity (the number of company news per day).
Unlike [1] we consider the model (2), (3), (4), (5), where Nt is a Poisson random variable with conditional jump
intensity
λt=λ+ρnt−1, (6)
where ζt−1 = E(Nt−1|It−1) −θλt−1, and nt−1 is the number of news from t−2 tot−1 respectively. Therefore we directly take into account the qualitative data of news intensity (source: RavenPack News Scores).
III. EMPIRICAL RESULTS
Our sample covers a period ranging from July 15, 2005 to July 15, 2008 (i.e. 752 trading days). Our sample is composed of the 10 UK stocks that were part of the FTSE100 index in the beginning of 2005 and which survived through the period of 3 years (see Table I).
Daily stock closing prices (the last daily transaction price of the security), as well as daily transactions volume (number of shares traded during the day) are obtained from Yahoo Finance database. Table I presents
• the list of stocks,
• the Kiefer-Salmon skewness test statistic (S)
• the Kiefer-Salmon kurtosis statistic (K)
• p-value of the Shapiro-Wilk statistic (marginal
signifi-cance level)
• the Box-LjungQ-statistic, constructed for maximum lag
of 20.
It is well-known thatS andK are asymptoticallyχ2(1) -distributed, and K+S isχ2(2)-distributed.
Based on the results presented in Table I we can conclude that the null hypothesis of normality is rejected for all stocks. The values of skewness is more than 3 for all companies.
The Box-LjungQ-statistic shows that there is no autocor-relation of log returns. Using this fact, we do not include autoregressive and moving average terms in mean equation. We will assume µ=E(rt).
Consistent with the findings in [13], we find that the p -values of Shapiro-Wilk statistic of log returns for all five companies are close to zero. We may conclude that all series are non-normal.
In our research we use the Raven Pack data, one of the most well-known providers of news analytics data. Raven-Pack News Scores measures the news sentiment and news flow of the global equity market based on all major investable equity securities. News scores include analytics on more than 27,000 companies in 83 countries and covers over 98% of the investable global market. All relevant news items about companies are classified and quantified according to their sentiment, relevance, topic, novelty, and market impact; the result is a data product that can be segmented into many dis-tinct benchmarks and used in various applications. For every new instance a company is reported in the news, RavenPack produces a company level record. Each record contains 16 fields including a time stamp, company identifiers, scores for relevance, novelty and sentiment, and a unique identifier for each news story analyzed. In the historical data files, each row in the file represents a company-level record. Empirical properties of news analytics data for 10 companies can be found in Table II.
We restrict the sample to news released with high rele-vance score (more or equal to 90). We do not eliminate all news releases with the same headlines and lead paragraphs, since we suppose that the number of the same news published by different news agencies reflects the importance of the news.
Letrtandrt∗denote log return of the stock and log return
of FTSE100 index on intervaltrespectively. We will consider a process (t) = rt−(θ1+θ2r∗t), where θ1 and θ2 are parameters of models.
The GARCH model of [3] provides a flexible and par-simonious approximation to conditional variance dynamics.
TABLE II
EMPIRICAL PROPERTIES OF DAILY NEWS INTENSITY(THE NUMBER OF NEWS PER STOCK)IN THE SAMPLE
Company mean min max S K
Aviva 2,4628 0 48 4,7524 25,849
Barclays 5,9628 0 118 5,9982 50,198
BP 10,862 0 104 3,5522 15,612
Brit Amer Tobacco 1,496 0 43 6,3312 45,129
BT Group 3,3045 0 78 5,5557 39,48
Carnival 1,3471 0 39 6,2927 60,664
Centrica 2,2793 0 39 4,4865 24,442
CRH Plc 0,74601 0 27 6,0312 40,205
Intl. Cons. Air Grp 0,75532 0 27 4,9172 31,434 Vodafone Grp 6,6449 0 171 6,1667 61,667
TABLE III
MAXIMUM LIKELIHOOD ESTIMATES OF THEGARCH(1,1)MODEL
Company α β α+β LLF1
Aviva 0,10 0,88 0,98 2105,43
Barclays 0,15 0,84 0,99 2033,27
BP 0,05 0,93 0,98 2189,00
Brit Amer Tobacco 0,02 0,98 0,99 2275,18 BT Group 0,06 0,89 0,95 2103,10 Carnival 0,06 0,90 0,96 2014,07 Centrica 0,09 0,81 0,90 2126,82 CRH Plc 0,17 0,82 0,99 2029,54 Intl. Cons. Air Grp 0,08 0,91 0,99 1839,54 Vodafone Grp 0,06 0,85 0,91 1991,97
Maximum likelihood estimates of the GARCH(1,1) model defined by (1) for log returns of closing daily prices are presented in Table III. Using GARCH estimates, Table III shows that volatility persistence, i.e.α+β, is more than 0.9. It provides clear evidence of GARCH effect. The coefficients of the model are significant with levels of 5%.
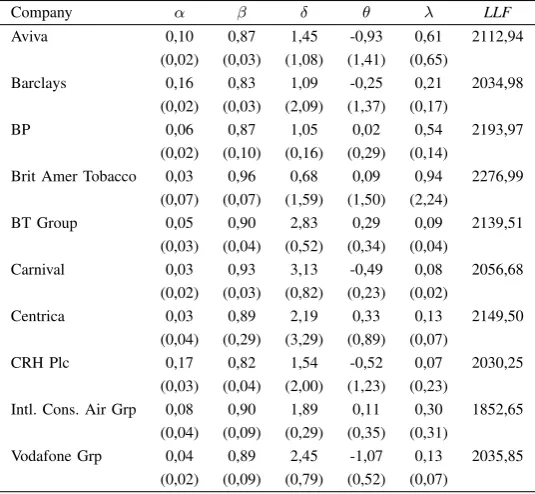
Table IV shows the maximum likelihood estimates of GARCH(1,1) model with Jumps for log returns of the closing daily prices of the 16 companies for 3 years (July 5, 2005 -July 5, 2008).
It can be seen that the coefficientsα, β of the model are highly significant. Table IV shows that volatility persistence, i.e. α+β, is more than 0.9. It provides clear evidence of GARCH effect.
Note that jumps are mainly related with negative move-ments in the price, because the estimates of parameterθare either negative or insignificant. The size of jumps (standard deviation of jumps,δ) is the highest for Carnival (δ= 3,13) and is the lowest for British Americo Tobacco (δ= 0,68).
Despite the fact that many of parameters are non-significant, the Box-Ljung statistics reject the model only for the company Intl. Cons. Air Grp. The average jump intensity is different for different companies. For example, the average of the jump intensity for Aviva is equal to 0,61, while for CRH Plc it is 0,07. Since the average intensity for BP is close to 0.5, the jumps are occurred every two days in average.
TABLE I
EMPIRICAL PROPERTIES OF DAILY LOG RETURNS IN THE SAMPLE
Company S K SW(p) Q(20) mean min max
Aviva 0,048 2,512 0,965 52,762 -0,026 -0,068 8,037 (0,000)
Barclays 0,047 2,768 0,957 35,056 -0,084 -9,693 7,801 (0,020)
BP -0,058 1,472 0,988 29,771 -0,013 -6,526 5,793 (0,074)
Brit Amer Tobacco -0,106 0,911 0,990 27,750 0,059 -5,357 3,705 (0,117)
BT Group -0,121 4,603 0,959 29,666 -0,019 -10,314 7,811 (0,076)
Carnival -0,482 5,930 0,946 12,503 -0,101 -13,116 6,842 (0,898)
Centrica 0,612 4,430 0,964 25,411 0,034 -4,932 10,536 (0,187)
CRH Plc -0,152 2,284 0,974 17,197 -0,029 -9,110 7,471 (0,642)
Intl. Cons. Air Grp 0,038 1,210 0,984 29,868 -0,032 -8,514 8,747 (0,073)
Vodafone Grp -0,502 5,086 0,953 16,330 -0,013 -11,499 8,144 (0,697)
TABLE IV
MAXIMUM LIKELIHOOD ESTIMATES OFGARCH(1,1)–JUMPS MODEL FOR LOG RETURNS OF THE CLOSING DAILY PRICES
Company α β δ θ λ LLF
Aviva 0,10 0,87 1,45 -0,93 0,61 2112,94
(0,02) (0,03) (1,08) (1,41) (0,65)
Barclays 0,16 0,83 1,09 -0,25 0,21 2034,98 (0,02) (0,03) (2,09) (1,37) (0,17)
BP 0,06 0,87 1,05 0,02 0,54 2193,97
(0,02) (0,10) (0,16) (0,29) (0,14)
Brit Amer Tobacco 0,03 0,96 0,68 0,09 0,94 2276,99 (0,07) (0,07) (1,59) (1,50) (2,24)
BT Group 0,05 0,90 2,83 0,29 0,09 2139,51 (0,03) (0,04) (0,52) (0,34) (0,04)
Carnival 0,03 0,93 3,13 -0,49 0,08 2056,68 (0,02) (0,03) (0,82) (0,23) (0,02)
Centrica 0,03 0,89 2,19 0,33 0,13 2149,50 (0,04) (0,29) (3,29) (0,89) (0,07)
CRH Plc 0,17 0,82 1,54 -0,52 0,07 2030,25 (0,03) (0,04) (2,00) (1,23) (0,23)
Intl. Cons. Air Grp 0,08 0,90 1,89 0,11 0,30 1852,65 (0,04) (0,09) (0,29) (0,35) (0,31)
Vodafone Grp 0,04 0,89 2,45 -1,07 0,13 2035,85 (0,02) (0,09) (0,79) (0,52) (0,07)
[image:4.595.164.432.365.612.2]Volatility of the stock has a high persistence, since the sum of the coefficientsα+β is close to 1. It provides clear evidence of ARCH–GARCH effect.
Table V shows that jumps are mainly related with negative movements in the price, because the estimates of parameter θ are either negative or insignificant. The size of jumps (standard deviation of jumps, δ) varies between 0,01 and 2,19.
Despite the fact that many of parameters are non-significant, the Box-Ljung statistics reject the model only for the company Intl. Cons. Air Grp. The highest average of the jumps intensity (λ) is equal to 0,55 (for BP), while the
lowest is 0,01 (for British Americo Tobacco).
Note that the GARCH model with jumps (the null model) is a special case of the augmented GARCH-Jumps model (the alternative model). Therefore, to compare the fit of two models it can be used a likelihood ratio test (see e.g. [20]). It is the most common approach to testing problem. This test has been discussed in the papers [21] and [22]. We use this approach to test the augmented GARCH-Jumps model against ’pure’ GARCH model with jumps.
LetH0 denote the ’pure’ GARCH–Jumps model and H1 denote the augmented GARCH-Jumps model. Let t be a
TABLE V
MAXIMUM LIKELIHOOD ESTIMATES OFGARCH(1,1)–JUMPS MODEL AUGMENTED WITH NEWS INTENSITY FOR LOG RETURNS OF THE CLOSING DAILY PRICES
Company α β δ θ λ ρ LLF2
Aviva 0,10 0,87 1,11 -0,79 0,09 0,055 2122,58
(0,03) (0,03) (3,20) (0,76) (0,09) (0,033)
Barclays 0,15 0,83 0,81 -0,16 0,11 0,077 2039,48 (0,02) (0,02) (25,84) (0,34) (1,27) (0,038)
BP 0,07 0,87 0,82 0,08 0,55 0,036 2198,82
(0,02) (0,03) (7,78) (0,04) (0,22) (0,013)
Brit Amer Tobacco 0,02 0,97 1,40 -0,03 0,01 0,055 2283,09 (0,02) (0,02) (0,53) (0,09) (0,01) (0,012)
BT Group 0,04 0,90 2,02 0,36 0,04 0,039 2159,51 (0,02) (0,02) (5,62) (2,35) (0,09) (0,019)
Carnival 0,05 0,88 2,19 -0,17 0,06 0,101 2072,07 (0,02) (0,02) (1,14) (0,04) (0,01) (0,018)
Centrica 0,03 0,85 1,76 0,27 0,14 0,041 2156,53 (0,02) (0,05) (0,86) (0,11) (0,13) (0,032)
CRH Plc 0,19 0,80 0,01 -2,70 0,02 0,03 2034,37
(0,03) (0,05) (0,01) (0,75) (0,01) (0,02)
Intl. Cons. Air Grp 0,08 0,90 1,88 0,54 0,28 -0,009 1853,87 (0,05) (0,07) (4,64) (3,24) (0,32) (0,174)
Vodafone Grp 0,06 0,83 1,99 -0,32 0,12 0,029 2053,31 (0,02) (0,02) (1,62) (0,13) (0,06) (0,010)
on the information setIt−1.
Denote the corresponding log likelihood functions by LLFH0(;θ0)andLLFH1(;θ1), respectively.
We will consider the test statistic defined by
LR= 2(LLFH1(;θ1)e −LLFH0(;θ0)).e (7)
While the asymptotic null distribution of (7) is unknown, it can be approximated by Monte Carlo simulation.
We can assume that the augmented GARCH-Jumps model is the alternative model and that θ1e is the true parameter. Using Monte Carlo approach we will generateN realizations of T observations (i) = ((i)
t )Tt=1,i = 1, . . . , N, from this model. Then we will estimate both models and calculates the value of (7) using each realization(i).
Ranking theN values gives an empirical distribution with which one compares the original value of (7). The true value ofθ1e is unknown, but the approximation error due to the use of θ1e as a replacement vanishes asymptotically asT → ∞.
If the value of (7) is more or equal to the 100(1−α)% quantile of the empirical distribution, the null model is re-jected at significance levelα. As it was mentioned in [21] the models under comparison need not have the same number of parameters, and the value of the statistic can also be negative. Reversing the roles of the models, it can be possible to test GARCH–Jumps models against the augmented GARCH-Jumps model.
Finally, we have set the number of trialsN in each Monte Carlo experiment to 500.
Results of likelihood ratio test for GARCH–Jumps model (null model) and the augmented GARCH–Jumps model (alternative model) one can find in Table VI. For 9 of 10 com-panies the alternative model is preferable with confidence level of 1%.
TABLE VI
RESULTS OF THE LIKELIHOOD RATIO TEST FOR THEGARCHMODEL WITH JUMPS AND THE AUGMENTEDGARCH-JUMPS MODEL
Company Null Hypothesis
Aviva rejected
Barclays rejected
BP rejected
Brit Amer Tobacco rejected
BT Group rejected
Carnival rejected
Centrica rejected
CRH Plc rejected
Intl. Cons. Air Grp accepted Vodafone Grp rejected
IV. CONCLUSION
We have studied GARCH model augmented with news analytics data to examine the impact of news intensity on stock volatility. Likelihood ratio test has shown that the GARCH–Jump model augmented with the news intensity performs efficiently than the ‘pure’ GARCH–Jump model. To calibrate the models we have used the Maximum Like-lihood Estimation (MLE) and Quasi Maximum LikeLike-lihood Estimation (QMLE) methods. We have used RavenPack news analytics data. We may conclude that
• the likelihood ratio test supports the hypothesis of
impact of news on jump intensity of volatility;
• GARCH–Jump model augmented with the news inten-sity does not remove GARCH and ARCH effects for all companies.
Based on the research it can be suggested some directions of future work.
• It is worth considering the problem of mutual depen-dence of volatility and news intensity.
• Future work may be also associated with the study of
– Markov – Switching GARCH models.
– HMM – GARCH Model.
There are some evidences (see e.g. [16]) that effect of news on prices is short-term, therefore it is more likely that we need tick by tick data to examine impact of news on stock volatility.
ACKNOWLEDGEMENTS
We would like to express our gratitude to Prof Gautam Mitra, director of CARISMA, for the kindly provided op-portunity to use RavenPack news analytics data, and to Prof Brendan McCabe and Keming Yu for helpful comments and remarks.
REFERENCES
[1] P. Jorion, “On jump processes in the foreign exchange and stock markets,”Review of Financial Studies, no. 1, pp. 427–445, 1988. [2] R. F. Engle, “Autoregressive conditional heteroscedasticity with
esti-mates of variance of united kingdom inflation,”Econometrica, vol. 50, pp. 987–1008, 1982.
[3] T. Bollerslev, “Generalized autoregressive conditional heteroskedastic-ity,”Journal of Econometrics, vol. 31, pp. 307–327, 1986.
[4] L. H. Ederington and J. H. Lee, “How markets process information: News releases and volatility,”Journal of Finance, vol. 48, pp. 1161– 1191, 1993.
[5] T. D. Berry and K. M. Howe, “Public information arrival,”Journal of Finance, vol. 49, pp. 1331–1346, 1993.
[6] M. L. Mitchell and J. H. Mulherin, “How markets process information: News releases and volatility,”Journal of Finance, vol. 49, pp. 923– 950, 1994.
[7] G. Tauchen and M. Pitts, “The price variability volume relationship on speculative markets,”Econometrica, vol. 51, pp. 485–505, 1983. [8] T. G. Andersen, “Return volatility and trading volume: An information
flow interpretation of stochastic volatility,”Journal of Finance, vol. 51, pp. 169–204, 1996.
[9] P. S. Kalev, W.-M. Liu, P. K. Pham, and E. Jarnecic, “Public informa-tion arrival and volatility of intraday stock returns,”Journal of banking and Finance, vol. 28, no. 6, pp. 1447–1467, 2004.
[10] G. Janssen, “Public information arrival and volatility persistence in financial markets,” The European Journal of Finance, vol. 10, pp. 177–197, 2004.
[11] S. Sidorov, P. Date, and V. Balash, “Using news analytics data in garch models,”Applied Econometrics, vol. 29, pp. 82–96, 2013.
[12] S. Sidorov, P. Date, and V. Balash, “Garch type volatility models augmented with news intensity data,” in Chaos, Complexity and Leadership 2012, ser. Springer Proceedings in Complexity, S. Banerjee and S¸.S¸. Erc¸etin, Eds. Springer Netherlands, 2014, pp. 199–207. [13] C. G. Lamoureax and W. D. Lastrapes, “Heteroskedasticity in stock
return data: volume versus garch effects,” Journal of Business & Economic Statistics, vol. 2, pp. 253–260, 1990.
[14] W. H. Chan and J. M. Maheu, “Conditional jump dynamics in stock market returns,”Journal of Business and Economic Statistics, vol. 20, pp. 377–389, 2002.
[15] J. M. Maheu and T. H. McCurdy, “News arrival, jump dynamics, and volatility components for individual stock returns,”Journal of Finance, vol. 59, no. 2, pp. 755–793, 2004.
[16] G. Mitra and L. Mitra, Eds., The Handbook of News Analytics in Finance. John Wiley & Sons, 2011.
[17] P. C. Tetlock, “Giving content to investor sentiment: The role of media in the stock market,”Journal of Finance, vol. 62, pp. 1139–1168, 2007. [18] M. Kantardzic,Data Mining: Concepts, Models, Methods, and
Algo-rithms. John Wiley & Sons, 2003.
[19] C. Francq and J.-M. Zako¨ıan,GARCH Models: Structure, Statistical Inference and Financial Applications. Chichester, UK: John Wiley & Sons, Ltd, 2010, ch. Estimating GARCH Models by Quasi-Maximum Likelihood.
[20] D. R. Cox and D. V. Hinkley,Theoretical Statistics. Chapman and Hall, 1974.
[21] J. H. Lee and B. W. Brorsen, “A cox-type non-nested test for time series models,”Applied Economics Letters, vol. 4, pp. 765–768, 1997.