Inferring phylogenies of evolving
sequences without multiple sequence
alignment
Cheong Xin Chan1, Guillaume Bernard1, Olivier Poirion1*, James M. Hogan2& Mark A. Ragan1
1Institute for Molecular Bioscience, and ARC Centre of Excellence in Bioinformatics, The University of Queensland, Brisbane, QLD
4072, Australia,2School of Electrical Engineering and Computer Science, Queensland University of Technology, Brisbane, QLD
4000, Australia.
Alignment-free methods, in which shared properties of sub-sequences (e.g. identity or match length) are extracted and used to compute a distance matrix, have recently been explored for phylogenetic inference. However, the scalability and robustness of these methods to key evolutionary processes remain to be investigated. Here, using simulated sequence sets of various sizes in both nucleotides and amino acids, we systematically assess the accuracy of phylogenetic inference using an alignment-free approach, based onD2 statistics, under different evolutionary scenarios. We find that compared to a multiple sequence alignment approach,D2methods are more robust against among-site rate heterogeneity, compositional biases, genetic rearrangements and insertions/deletions, but are more sensitive to recent sequence divergence and sequence truncation. Across diverse empirical datasets, the alignment-free methods perform well for sequences sharing low divergence, at greater computation speed. Our findings provide strong evidence for the scalability and the potential use of alignment-free methods in large-scale phylogenomics.
M
ultiple sequence alignment (MSA) has long been a standard stage in phylogenetic workflows1,2. In this approach, homologous sequences are first multiply aligned along their full length, yielding positional hypotheses of homology (alignment columns) that are input to maximum parsimony, maximum likelihood (ML) or Bayesian inference, or summarised in a distance matrix and used to compute a tree e.g. by neighbour-joining (NJ). A key assumption of MSA is that in each such set of sequences, homologous positions occur in the same order relative to one another. This is not fully realistic, as genes and genomes are subject to recombination, rearrangement and lateral genetic transfer3–5. In sequences so affected, the positional hypothesis of homology generated by MSA will be incomplete or incorrect, diffusing the phylogenetic signal, violating models of the substitution process across sites and branches, and consequently misleading phylogenetic infer-ence6,7. These issues can only be intensified by the on-going deluge of sequencing data arising from advances in sequencing technologies8.An alternative to MSA in phylogenetic inference is the so-calledalignment-freeapproach in which pairwise similarity is computed from sub-sequences, e.g. counts of exact (or inexact) sub-sequences of defined length, or by extension, of conserved sequence patterns9,10, or alternatively of match lengths11. These sub-sequences are known
variously as words,k-mers orn-grams12; see refs. 13–15 for recent reviews. A word-count approach for
alignment-free sequence comparison uses theD2statistic15–18. AD2score is calculated based on the exact count of sharedk -mers between any two sequences, thus representing the extent of similarity they share (see Supplementary Note for details). Since the profile ofk-mers depends on length of the sequence, modifications have been proposed to accommodate this bias, e.g. normalising theD2score by the probability of occurrence for eachk-mer observed in the sequences (DS2), or by the mean and variance ofk-mer occurrences (D2)17,18. These studies have demonstrated
thatDS2andD2have greater statistical power thanD2, and that this power increases with sequence length15,17,18.
These statistics can be easily transformed into a pairwise measure of dissimilarity or distance, which can then be used to compute phylogenetic relationships.
Alignment-free approaches have been adopted in searches of sequence databases19, clustering of expressed
sequence tags20, and more recently in detecting lateral genetic transfer11. By directly computing pairwise
dissim-ilarity or distance using these methods, one can bypass resource-intensive ML or Bayesian approaches in favour of NJ. Some methods implementing approximate ML measures21,22, although less accurate, are less
resource-intens-OPEN
SUBJECT AREAS:
PHYLOGENETICS COMPUTATIONAL BIOLOGY AND BIOINFORMATICS Received 6 March 2014 Accepted 10 September 2014 Published 30 September 2014 Correspondence and requests for materials should be addressed to M.A.R. (m.ragan@uq. edu.au) *Current address: Laboratoire Ampe`re, CNRS UMR 5005, E´cole Centrale de Lyon, France.
ive. However, the sensitivity of alignment-free methods to different evolutionary scenarios, and the scalability of these methods, have not been systematically investigated.
Here, using both simulated and empirical data we assess the accu-racy of alignment-free phylogenetic approaches using D2statistics compared to standard MSA-based approaches. Using sets of simu-lated nucleotide and amino acid sequences, we systematically exam-ine the accuracy and sensitivity of D2 methods to key molecular evolutionary processes including sequence divergence, among-site rate heterogeneity, biases of G1C content, genetic rearrangements and insertions/deletions, as well as to the technical issue of incom-plete sequence data. We demonstrate the scalability and potential of using alignment-free approaches to compute phylogenetic trees quickly and accurately from large-scale DNA or protein data. Results
For our alignment-free phylogenetic approach, we usedD2statistics (independently forD2,DS2,D2)17,18to generate a score for each pos-sible pair of sequences within a set. Here we also introduceDn2, aD2 statistic that extends eachk-mer recovered in the sequences to its neighbourhoodn, i.e. allowsnnumber of wildcard residue(s). This simple extension ofD2is analogous to generation of high-scoring words for the query phase of BLAST23, and to a published
alignment-free measure of sequence similarity24; a measure of inexact match has
recently been extended to a position-specific context25. We denote
cases ofDn2wheren51 asDn
~1
2 hereinafter. Each of these metrics is described in the Supplementary Note. For each method, we trans-form the scoresvialogarithmic representation of the geometric mean to estimate evolutionary distances (see Methods). Each resulting distance matrix was then used to calculate phylogenetic relationships using NJ. For comparison, for each sequence set we performed MSA using the popular tool, MUSCLE26and inferred a phylogenetic tree
using the widely used MrBayes27. We use Robinson-Foulds
dis-tances28 to evaluate topological congruence between each of the
resulting test trees and a reference tree, normalised to adjust for
different tree sizes (see Methods for details). We denoteRFas the normalised Robinson-Foulds distance.RF50 indicates that the test tree shows complete topological congruence with the reference, while
RF51 indicates that the test tree has no bipartition in common with the reference. TheRFfor a test tree generatedviaone of the fourD2 methods is denoted asRFD2,RFD2S,RFD2*orRFD2n1, and the
equi-valent for a test tree generatedviaMSA and MrBayes is denoted as
RFMSA.
Using simulated data, we independently assess the sensitivity ofD2 methods to variation in key evolutionary processes: sequence diver-gence, genetic rearrangement, and insertions/deletions. Because the phylogenetic tree is known for each simulated sequence set, we use that as the reference.
Sequence divergence. We simulated nucleotide sequence sets of
various size categories N 5 8, 32 and 128 (total length, L 5 1500 nt). For each category, six sequence sets were simulated under an unrooted tree topology across distinct situations of rela-tive branch lengths, witha51 in an 8-category discrete gamma distribution. Each of these trees (T1 through T6 in Fig. 1; shown for 8-taxon trees) represents a fine-scale scenario of sequence divergence, as determined by different combinations of internal (x) and terminal (y) branch lengths. In some simulations, we recognise two subsets ofy(y1andy2) of different length. Sets containing varied
divergence levels had different combinations ofx,y1andy2as shown
in T2, T3, T5 and T6; these are the reference trees for the corres-ponding sequence sets. For 32- and 128-taxon trees, the topologies were simply expanded for each upper and lower half, as indicated in Fig. 1 (labelsp1andp2). For instance in a 128-taxon tree, the relative lengths (x,y1,y2) of the first 64 taxa follow patternp1, while the
others followp2. For simplicity,xandy(ory1andy2) were set at
either 0.01 or 0.05 (unit in number of substitutions per site). The least-divergent (most-similar) sequence set (T1) was simulated with all branch lengthsx5y15y250.01 (two most dissimilar sequences
differ at 0.14 substitutions per site atN5128), whereas the most-divergent (most-dissimilar) set (T4) hadx5y15y250.05 (two
Figure 1|Trees for simulation of sequence data.Six situations showing distinct combinations of internal (x) and terminal (y) branches, labelled as T1 through T6, withyspecified differently between the first (p1) and second (p2) half of the branches on a tree. The unit of branch lengths is number of substitutions per site. The length of each edge is either 0.01 or 0.05 substitutions per site.
most dissimilar sequences differ at 0.70 substitutions per site atN5 128). The branch lengths in all these trees are short (two most dissimilar sequences in any set differ at ,0.70 substitutions per site), so any MSA-based approaches should have no problem recovering these phylogenies. However, these datasets provide a testable range of sequence divergence to assess the sensitivity of alignment-free methods in recovering the topologies. For each sequence set, we independently derived pairwise distances using
D2,DS2,D2andD
n~1
2 , in each case across differentk-mer lengths (k 54, 8, 12, 16, 20 and 24). Each parameter setting was run with 100 replicates, i.e. 10033 size categories36 trees34 methods ofD2 statistics36k-mer lengths (total of 43200 sequence sets). The same experimental design applies to protein sequences with fixed sequence length of 500 amino acids. See Methods for details.
To compare the performance between MSA-based and the D2 methods, we denote a relative measure of accuracyQDX5RFMSA
–RFDX, whereDXrepresents any of theD2methods, i.e.QD2is theQ
that corresponds toRFMSA–RFD2, and so forth. Derived fromRF, the
Qvalues reflect the proportion of bipartitions in a tree, and can be interpreted as the difference between the deviation of each tree from the common reference. The sign of theQvalue indicates which of the two approaches performs better; if aD2method performs better than MSA in recovering the reference tree then Q .0 (i.e. RFMSA.
RFDX), whereas if aD2method performs worse than MSA thenQ
,0 (i.e.RFMSA,RFDX). WhereQ50 (i.e.RFMSA5RFDX) theD2 method performs as well as the MSA-based approach, although the trees could still be incongruent with the reference (i.e. theirRFcould be non-zero).
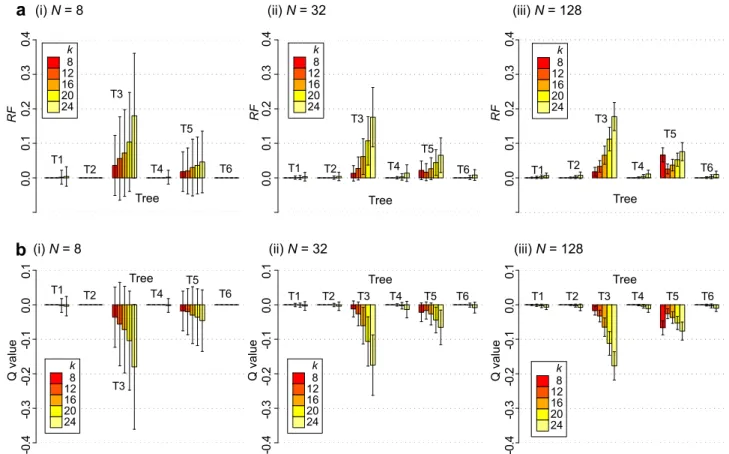
Across allD2methods used in this study, we found thatDn
~1 2 yielded the smallestRF across all categories of size and situations of relative branch length, for both nucleotide (Supplementary Fig.
S1) and protein (Supplementary Fig. S2) sequence sets. Figure 2a shows meanRFD2n1at differentk-mer lengths (shown fork$8)
in each size categoryNof nucleotide sequence sets, across all trees (T1 through T6; Fig. 1), with the corresponding meanQvalue shown in Fig. 2b. Across allN,Dn2~1recovered the reference topology almost perfectly for sets of sequences simulated under trees T1, T2, T4 and T6 (atk516, meanRFD2n1#0.001 across these sets and allN;
Fig. 2a), whereas largerRFD2n1distances are observed for cases of T3
and T5 (e.g. forN532 atk516, meanRFD2n150.06 and 0.03
respectively for T3 and T5; Fig. 2a). The accuracy decreased with increasingk, e.g. forN5128 and T3, meanRFD2n150.01, 0.03, 0.06,
0.11, 0.18 atk58, 12, 16, 20 and 24.
While relative performance differed across the simulated scen-arios, overall across these sequence sets we find thatDn2~1performed as well as the standard MSA-based approach (e.g. for T1 and T2 atk
58, meanQD2n150.00 in all cases ofN58, 32 and 128; Fig. 2b),
with the relative performanceQdecreasing slightly with increasedk
(e.g. forN532 at T3,Q5 20.01,20.03,20.06,20.11,20.17 atk5 8, 12, 16, 20 and 24). Across allNexamined here,Dn~1
2 performed slightly worse than MSA for T3 and T5, e.g. atk58,QD2n15 20.01
and20.02 respectively atN532;QD2n15 20.02 and20.07
respect-ively atN5128. The bar plots in Fig. 2a almost mirror those in Fig. 2b, suggesting thatRFMSA50 in most cases. Both T3 and T5, the
cases problematic forD2methods, have short internal branches (x) with long terminal branches (y: Fig. 1). Our results suggest thatD2 methods are more vulnerable to this situation, while the MSA-based approach performed well across these six cases.Qvalues observed for otherD2methods across nucleotide and protein sequence sets are shown in Supplementary Fig. S3 and S4 respectively.
To assess the optimal k-mer length for use inD2methods in deducing phylogenetic relationships from nucleotide and protein Figure 2|The accuracy ofD2methods based on sequence divergence of the nucleotide sequence sets.For each sizeNat (i) 8, (ii) 32 and (iii) 128, meanRFD2n1are shown in (a) across differentk-mer lengths (shown fork58, 12, 16, 20, 24), for cases simulated under each of the six trees (T1 through
T6 on thex-axis). The correspondingQD2n1for each case is shown in (b). Error bars indicate standard deviation from the mean. See Supplementary
Figures S1 through S4 for complete results for allD2methods for both nucleotide and protein sequence sets.
sequences, we comparedRFvalues from allD2methods between the two sequence types acrossN58, 32 and 128 pooled from all six trees, as shown in Supplementary Fig. S5. For nucleotide sequences,k58 yielded the lowestRFdistances, withRF50 atN58 and 32, andRF
,0.002 atN5128 across allD2methods. For protein sequences,k5 4 is the optimal length across allD2methods, withDn
~1
2 yielding the smallest RF distances across all size categories, i.e.RFD2n150.012,
0.009 and 0.009 atN58, 32 and 128. This result supports the notion that optimal k is negatively correlated with alphabet size of the sequence data9,29,30. Formal proof appears to be lacking, but might
be approached analogously to an earlier study31.
Two other scenarios relevant to sequence divergence are among-site rate heterogeneity (the presence of fast- versus slow-evolving sequence regions), and compositional (G 1C content) biases in the sequences. We examined the sensitivity ofD2methods indepen-dently to each these scenarios (see Supplementary Note for detail). Overall, among-site rate variation does not appear to affect drastic-ally the accuracy of eitherD2or MSA-based approaches (Q50 in most cases at optimalkin Supplementary Fig. S6); theRFvalues for all analyses of nucleotide and protein sequences are shown respect-ively in Supplementary Fig. S7 and S8. Interestingly, we note that high G1C proportion (thus low complexity of sequences) plays to the strength of local exact matches, rather than neighbourhood (non-exact) matches as allowed inDn2~1(Supplementary Fig. S9).
Genetic rearrangement.Here we simulated sequence data to assess
the direct impact of genetic rearrangement on the performance ofD2 methods in phylogenetic inference. We defineRas the percentage length of a full-length nucleotide sequence that has undergone a non-overlapping rearrangement. We simulated post-hoc rearrangements in half of the sequences in a set of 5000-nt sequences, i.e. atN58, each of any 4 sequences would haveR% of its length rearranged in a non-overlapping manner. Each rearrangement event involves one or more fragments of 250 nt, such that the total rearranged region (i.e.
R%of full length) is no longer contiguous (see Methods). Figure 3a shows the average RFD2n1 for each k-mer length in nucleotide
sequence sets (N 5 8) across R 5 10, 25 and 50%, including
RFMSAof the MSA-based approach MUSCLE1MrBayes. Across
all categories and allk-mer sizes, all methods, alignment-free or not, yielded averageRF,0.05 compared to the reference tree.Dn2~1atk 58 or 12 perfectly recovered the reference topologies (RFD2n150 in
both cases) regardless ofR. Figure 3b shows the meanQvalues for each of these cases. AtR510% and 25%, we observedQ50 fork58 and 12, i.e.Dn2~1performed as well as did the MSA-based approach in recovering the reference topologies. AtR550%, theD2methods yielded higher accuracy than did MUSCLE1MrBayes (Q.0 for all
k-mer lengths). Compared to MUSCLE (Fig. 3), the use of MAFFT resulted in higherRFandQvalues (Supplementary Fig. S10), thus lower accuracy (p,2.2 310216; see Supplementary Note). Our
findings suggest thatD2methods are more robust to the effect of genetic rearrangement than is the standard approach based on MSA.
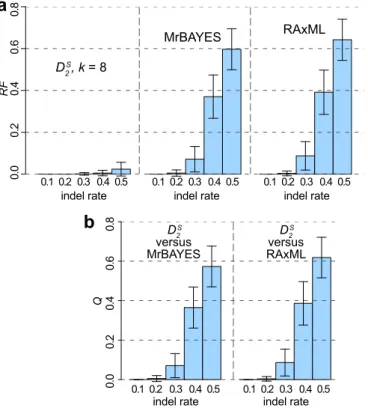
Insertions/deletions.To assess the sensitivity of the alignment-free
approach to insertions/deletions (indels) we simulated nucleotide sequence sets (N532) under tree T4 by incorporating indel events at a predefined rate (r) along the tree branches32, with the inserted/
deleted fragment lengths following a Lavalette distribution33,34
(maxi-mum length5100 nt). Figure 4a shows theRFvalues obtained using
DS
2, two MUSCLE-based methods (MrBayes and the popular ML method RAxML35,36) across cases at different values of r; the
correspondingQvalues for each MSA-based approach are shown in Fig. 4b. At r 5 0.1, all approaches recovered the reference topology perfectly (RF 5 0 in all cases). Asr increases, observed
RF increases proportionately: for trees generated usingDS2 at r 5 0.3, 0.4 and 0.5,RF 50.001, 0.005 and 0.024. In comparison, the correspondingRFvalues for MSA-based methods are higher:RF5 0.071, 0.370 and 0.597 for MUSCLE1MrBayes andRF 50.087, 0.391, and 0.642 for MUSCLE1RAxML. These results suggest that alignment-free methods are more robust to insertions/deletions (RF
,0.025 atr50.5) than MSA-based approaches (RF$0.60 atr5 0.5 in both cases), with all observedQ$0 (e.g.Q50.07, 0.37 and Figure 3|The accuracy ofD2methods based on genetic rearrangement.
RFD2n1are shown in (a) across differentk-mer lengths (k$8), as well as
that of the standard approach (RFMSA), across differentRat 10%, 25% and
50%. The correspondingQD2n1values are shown in (b). Error bars indicate
standard deviation from the mean.
Figure 4|The accuracy of phylogenetic approaches based on insertions/ deletions.RFvalues are shown in (a) forDS2, MUSCLE1MrBayes and MUSCLE1RAxML across different indel ratesr. The correspondingQ values for MUSCLE1MrBayes and MUSCLE1RAxML are shown in (b). Error bars indicate standard deviation from the mean.
0.57 atr50.3, 0.4 and 0.5 for MUSCLE1MrBayes: Fig. 4b). Here the use of MAFFT instead of MUSCLE yielded lower RF and Q
values, i.e. a higher accuracy of phylogenetic inference (Supplementary Fig. S11 versus Fig. 4; p , 2.2 3 10216). These
findings are consistent with our analysis of other insertion/deletion scenarios including vertically staggered deletions (Supplementary Note and Fig. S12), a (biologically not very realistic) scenario in which MSA is known to perform poorly37. Independently, we
observed that the accuracy ofD2methods decreases with increasing extent of sequence truncation, and increases proportionately with sequence length (Supplementary Note and Fig. S13).
Gene family evolution based on coalescence.Here we simulated
nucleotide sequence sets under the coalescent model of gene family evolution (within a population)38,39 across different fixed effective
population sizes Ne (see Methods). The Neparameter affects the
overall population structure, thus branching patterns and branch lengths of a tree. Coalescent rate between two lineages is higher within a smaller population40, thus a smaller N
e yields shorter
branch lengths in a tree. All trees are asymmetric, and thus represent a more-realistic biological scenario. We note that the observed performance in this part of our analysis could be affected by one or more scenarios in addition to Ne (and sequence
divergence). Figure 5a shows theRF values obtained using Dn2~1, and by MSA-based approaches using MUSCLE, across cases at varied Ne; the corresponding Q values for each MSA-based
approach are shown in Fig. 5b. RF .0 was observed across all cases, suggesting that all approaches on average failed to recover known tree topologies perfectly. Observed RF values for all approaches increase proportionately with increasingNewhenNe$
100000, e.g. forDn2~1,RF50.072, 0.119, 0.239 and 0.407 atNe5
100000, 250000, 500000 and 1000000 (Fig. 5a), suggesting an inverse relationship betweenNeand the accuracies of these approaches in
recovering the known tree topology. At Ne510000, 100000 and
250000, both Dn2~1 and MSA-based approaches yielded almost identical trees (e.g.Q5 20.007,20.010,20.016 against MUSCLE 1RAxML; Fig. 5b), althoughDn2~1yielded less-accurate topologies (Q,0). In the extreme cases ofNe.250000,Dn
~1
2 performed substantially worse than any of the two MSA-based methods, e.g.
Q5 20.146 and20.279 for MUSCLE1RAxML (Fig. 5b). At the other end of the spectrum, cases of smallNe51000 also negatively
impacted the accuracies of all approaches, i.e.RF50.240, 0.230 and 0.213 for Dn2~1, MUSCLE 1MrBayes and MUSCLE 1 RAxML (Fig. 5a). Results of the corresponding analysis using MAFFT are shown in Supplementary Figure S14 (p 5 0.74; no significant difference). These findings indicate that in these scenarios, the alignment-free approach yields results similar to those of the MSA-based approaches, regardless of which MSA tool is used, when Neis reasonably large, but performs substantially worse in
extreme cases i.e. when Ne is very small or very large. This
observation is plausibly explained by extreme (high/low) sequence divergence (See Supplementary Table S1), although we cannot rule out the impact of other evolutionary scenarios. In an independent analysis across datasets that were simulated under non-ultrametric trees (specifically violating the molecular clock) we observed a similar trend (RF.0;Q,0), with higherRFobserved forDn2~1
than for MSA-based approaches (Supplementary Fig. S15). This complex scenario is more realistic than ultrametric trees, but we cannot distinguish the effect of clock violation from that of other evolutionary processes.
Analysis of empirical data.To examine the performance of these
methods with empirical data, we used 4156 sets of nucleotide sequences and their corresponding phylogenetic trees from TreeBASE (treebase.org)41. These sequence sets and trees were
obtained from 2471 studies deposited in TreeBASE as of 27 May
2013 (see Supplementary Data for the complete list). As shown in Supplementary Fig. S16, the sizes of these sequence sets range between 6 and 2957 sequences (mean 59.41, median 41 sequences), and within-set sequence similarity has a mean of 90.12% (median 92.37%). For each sequence set, we used each of theD2methods (independently for k 5 6 and 8) to generate a distance matrix, from which we reconstructed a NJ tree. The selection ofkis based on our observation of an optimal length in the analysis of simulated nucleotide sequence sets (Supplementary Fig. S5). Because the true reference tree is unknown for empirical datasets, we cannot readily assess accuracy. Here we compare each of our resulting test trees inferred using the D2 methods against the corresponding tree published (and peer-reviewed) in TreeBASE. Because we cannot assume that published trees perfectly reflect true evolutionary relationships, we intentionally do not interpretRFas a measure of accuracy here, but instead simply as a measure of (dis)agreement between the trees produced by an alignment-free and an MSA-based approach.
As shown in Supplementary Table S2, the use ofk56versus8 does not impactRFfor anyD2method, withDS2yielding the smallest average RF (0.438; median 0.409 at k5 8). Figure 6 shows the distribution density ofRFas observed forDS2atk58, based on sizes of the sequence setsN(Fig. 6a) and within-set sequence similarity (Fig. 6b). See Supplementary Tables S3 and S4 respectively for the corresponding values. As shown in Fig. 6a and Supplementary Table S3,DS2yielded topologies that are more congruent with those gener-ated using the standard MSA approach for small sequence sets (e.g. meanRF0.363, median 0.333 atN#25) than for larger sequence sets ofN.25 (meanRF0.661, median 0.635 atN.500), and theseRF
distances increase proportionately with increasingN. Interestingly, across different categories of within-set sequence similarity (percent identity;ID) regardless ofN(Fig. 6b), density plots ofRFfor cases of
ID.70% peak at values of RF between 0.25 and 0.40, with the Figure 5|The accuracy of phylogenetic approaches based on coalescent evolution of gene families.RFvalues are shown in (a) forDn2~1, MUSCLE
1MrBayes and MUSCLE1RAxML across different effective population sizeNe. The correspondingQvalues for MUSCLE1MrBayes and
MUSCLE1RAxML are shown in (b). Error bars indicate standard deviation from the mean.
smallest means observed for highly similar sequence sets (0.424 atID
between 80% and 90%, median 0.392; Supplementary Table S4).RF
values increase with decreasing ID, with mean RF 0.533, median 0.528 observed for cases ofID,70% (Supplementary Table S4). These findings suggest that theD2-based approach, across most of these diverse empirical data, yield topologies that are slightly incon-gruent (RF,0.5 in 2809/4156 trees;DS2atk58) to those arising from the standard MSA-based approach, and that it is rare for both approaches to recover the exact same tree topology (RF50 recov-ered by anyD2-based approach in 106/4156 trees).
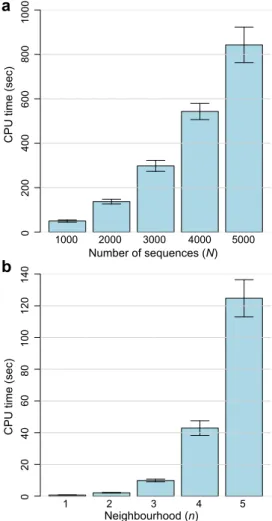
Computational efficiency and scalability. The computational
complexity of variousD2methods has been described earlier24(see also Supplementary Note). Figure 7a shows the computation time required to generate pairwise D2 distance matrices across large empirical sequence sets (N51000, 2000, 3000, 4000 and 5000); for the corresponding numerical values see Supplementary Table S5. These large sequence sets are of 16S ribosomal RNA genes sampled from the GreenGenes database (see Methods). Mean computation time increases with N, from 49.77 seconds at N5
1000 to 842.98 seconds atN55000 (17-fold increase). Similarly, memory usage (Supplementary Table S5) increases with N, from 378.24 MB (N51000) to 2445.31 MB (N55000; approximately 6-fold increase).
Phylogenetic inference involves details not only of software (e.g.
D2andneighborin PHYLIPversusMUSCLE and MrBayes) but also
of parameter settings, implementation (e.g. programming language used, and capacity for multi-threading) and hardware (e.g. machine architecture and its efficiency of memory usage). Therefore, compar-ing computation time and memory usage between the two approaches is not straightforward. For 50 sets of nucleotide sequence (N58;L51500 nt), we observe an average wall time of 1.50, 86.38 and 491.16 seconds forD21neighbor, MUSCLE 1RAxML and MUSCLE1MrBayes (four-threaded runs; see Methods). For the same analysis across protein sequence sets (N58;L5500aa), wall times are respectively 1.82, 255.48 and 3047.14 seconds. Here, our alignment-free approach is approximately 140-fold and 1670-fold faster respectively, compared to MUSCLE 1 RAxML and MUSCLE1MrBayes. These findings suggest thatD2methods are highly scalable for phylogenetic inference of large-scale sequence data.
In an independent experiment on nucleotide sequence sets ofN5 8 (Fig. 7b), we found that computation time forDn2~1(atk58) increases exponentially with increasing neighbourhoodn, from 0.71 atn51 to 124.73 seconds atn55. At greater values of
neighbour-0.50 0.25 RF 0.00 0.75 1.00 2.0 1.0 Density 0.0 3.0 N <25 26-50 51-75 76-100 101-200 201-500 >501
a
ID (%) ID > 90 80 < ID ≤ 90 70 < ID ≤ 80 ID ≤ 70 0.50 0.25 0.00 0.75 1.00 RF 1.0 0.5 Density 0.0 1.5 2.0b
Figure 6|The accuracy ofD2methods based on TreeBASE data.The probability density ofRFD2n1atk58 as categorised based on (a) total
number of sequences within a set,N(mean and median in Supplementary Table S3), and (b) within-set sequence similarity,ID(mean and median in Supplementary Table S4).
Figure 7|Computation time ofD2methods.The computation time in seconds is shown for (a)D2method atk58 across subset of GreenGenes
data across datasets ofN51000, 2000, 3000, 4000 and 5000, and for (b)Dn2 analysis across neighbourhood sizen51 through 5, for nucleotide sequence sets ofN58. Error bars indicate standard deviation from the mean.
hood (n.2) i.e. when a higher number of wildcards is considered, the accuracy of Dn2 appears to decrease, more so at larger N (Supplementary Fig. S17; shown fork58 across nucleotide sequence sets). However, the interplay amongn,kandNremains to be inves-tigated systematically.
Discussion
Alignment-free methods yielded similar if not identical tree topolo-gies to those generated using MSA-based approaches across a wide range of data sizes and scenarios. Our findings demonstrate that the accuracy of alignment-free methods, compared to the current stand-ard based on MSA, is more robust against among-site rate hetero-geneity, compositional biases, genetic rearrangements and insertions/deletions, but is more sensitive to sequence divergence and the presence of incomplete (truncated) sequence data. The align-ment-free methods operated at far greater computation speed (more than 2000 times faster in some cases).
Opposing views have recently been expressed on whether the application of alignment-free methods in phylogenetics reflects a model-free, purely informatic exercise, or alternatively can capture homology signal inherent in evolving sequences42–44. Our results
support the latter view. The alignment-free approach implemented here appears to have no difficulty, at appropriate parameter settings across our simulated datasets, in capturing homology signal and generating topologies that are very similar or identical to those gen-erated by MSA followed by Bayesian inference, arguably the current standard in phylogenetics (see below). The robustness of alignment-free methods to rearrangements and insertions/deletions represents a critical advantage, since these events are common among microbial genomes3and frequently interrupt individual genes45. Our findings
support the notion that gappy regions tend to be forced into align-ment within an MSA framework and thereby bias subsequent phylo-genetic inference37.
Here we used MUSCLE26and MrBayes27as the standard
phylo-genetic approach in the analysis of simulated data. Another popular MSA tool is MAFFT46; both MUSCLE and MAFFT compare
favour-ably against other MSA tools in a number of benchmark studies26,47.
A comprehensive analysis of performance across different MSA tools is beyond the scope of this study. Across scenarios of random inser-tions/deletions, we found little difference in our inference between the use of MUSCLE and MAFFT (p.0.5; Supplementary Table S6), except under the unrealistic scenarios of vertically staggered dele-tions (Supplementary Fig. S12;p,2.2310216) in which MAFFT
performed better, lending support to an earlier report37. The use of
other programs for MSA and phylogenetic inference, or indeed the use of different parameter settings in these programs (e.g. fewer MCMC generations in MrBayes than the 1.5 million used in this study), would inevitably yield somewhat different results. ML is another popular MSA-based method of phylogenetic inference, which estimates goodness-of-fit of sequence data given an under-lying evolutionary (substitution) model. ML methods e.g. RAxML35
are time-consuming, and this has prompted the development of faster though less-accurate implementations e.g. PhyML21 and/or
scalable methods that approximate ML estimates e.g. FastTree22
(see ref. 48 for a comparative analysis). We generated ML trees for a subset of the simulated sequence data using RAxML and found no or little topological difference between these trees and those gener-ated using MrBayes, as shown by the similar trends ofRFandQin Figs 4 and 5. In fact, RAxML yielded less-accurate topologies than MrBayes in many cases (largerRFobserved for RAxML: Fig. 5).
Using extensive simulated data and diverse empirical data (here from the TreeBASE dataset, generated by various programs and phylogenetic inference methods common in the peer-reviewed lit-erature), our results consistently demonstrate the relative accuracy and scalability of alignment-free methods in large-scale phylogenetic inference, regardless of which specific method they were compared
against. The empirical datasets used in this study are highly diverse, with various extents of within-set sequence divergence and data sizes. Many of these sequence sets contain partial and/or fragmented sequences (Supplementary Data). As per our analysis of simulated sequence sets, these aspects impact the accuracy of alignment-free methods more than that of MSA-based approach in recovering accurate phylogenies. In addition, we appliedk56 and 8 in our alignment-free approach across these datasets, a decision based on our observation in simulated sets of 1500 nt sequences (Supplementary Fig. S5). In cases where sequences are longer, the representation of distinctk-mers (atk56 or 8) could be saturated, thus losing the resolution (reducing the distinguishing power of the
k-mers) necessary to accurately infer dissimilarity (vis-a`-vis phylo-genetic) relationships among the sequences9,30. The correlation
between sequence length andkwithin the context of phylogenetics has been explored to some extent30,49, e.g. using shortest unique
sub-strings50, but this issue remains to be systematically investigated. In
this study we used NJ to infer phylogenetic trees from the distance matrices generated fromD2methods; one can imagine using other distance-based approaches, e.g. a weighted least-squares method such as Fitch-Margoliash51. In small-scale investigations, we find
no topological difference across trees generated using NJ or Fitch-Margoliash.
Conversion of subsequence similarity (profile) scores into a mea-sure that represents the evolutionary relatedness between two full-length sequences remains an active field of research. Here we simply transformedD2scores into pairwise distances of sequences using a logarithmic representation of the geometric mean. Other strategies have been proposed to create more-realistic measure of distance or dissimilarity, including the assignment of ap-value for each pairwise score based on a null distribution (hypothesis) of subsequences as observed across the whole dataset29,52. Approaches inspired by
information retrieval are under consideration.
In general, our results demonstrate the utility and robustness of alignment-free methods across the choice of scoring methods. The non-monotonic relationship between word length and performance, the utility ofDS2,D2andDn2~1, and the failure of larger mismatch neighbourhoods are broadly consistent with previous reports18,52.
However, simpleD2scoring is known to be dominated by single-sequence noise effects askincreases18; its good performance here
may in part be explained by the normalisation inherent in our dis-tance measure. The one exception to these comments lies in the vulnerability ofD2-based approaches to heterogeneous variation, an effect especially pronounced for protein sequences (Supplementary Fig. S6), which may arise from the failure of the variance estimate in the denominator.
Crucially, the computational advantages identified above extend to a broad range of scoring methods and distance transformations. The use of a mismatch neighbourhood has potential to add signifi-cantly to both the compute and memory requirements of the process, but these demands are modest forDn2~1and larger neighbourhoods seem not to improve its performance in phylogenetic inference. Alignment-free methods thus offer computational speed many hun-dreds or thousands of times faster than the comparable MSA-based approaches, with memory requirements in the hundreds of mega-bytes, well within the capabilities of even portable commodity devices. To the extent that memory is not an issue, alignment-free methods present an attractive, highly scalable alternative to MSA-based methods in large-scale phylogenetic (and phylogenomic) analyses.
Methods
Simulated sequence data.For all programs, default settings were used unless otherwise specified. We simulated sets of DNA and protein sequences of different sizes (N58, 16, 32, 128) usingevolveras implemented in PAML 4.553, unless otherwise specified. We used GTR54(rate parametersa50.987,b50.110,c50.218,
d50.243,e50.395)55and WAG56substitution models respectively for simulation of
www.nature.com/
scientificreports
nucleotide and protein sequences. We detail simulation strategy for each evolutionary scenario below.
Sequence divergence.For each set, sequences of fixed length (L51500 nt for DNA; 500 amino acids for protein) were simulated on an unrooted symmetrical tree on which the lengths of internal (x) and terminal (y, ory1andy2) branches are set separately, at either 0.01 or 0.05 substitutions per site, to represent six distinct scenarios (Fig. 1; shown for 8-taxon trees). These sequence sets were simulated under a discrete approximation of the gamma distribution (shape parametera51.0, 8 categories).
Genetic rearrangement.For each nucleotide sequence set (N58;L55000 nt), we relocated one or more region (i.e. individual rearrangement events) of 250 nt within a sequence in a cut-and-paste manner, with no overlaps. We defineRas the total percentage length ofLthat has been relocated. We simulated sequence sets withR5 10, 25 and 50% (each in 50 replicates), such that the total rearranged region is not contiguous. Given the prior expectation that alignment-free methods would be less sensitive to sequence rearrangements, here we simulated sequence sets under tree T3 (Fig. 1), one of the more problematic cases forD2methods (as shown in Fig. 2).
Insertions/deletions.For this analysis, we simulated nucleotide sequence sets of size
N532 (L51500 nt) using INDELible32under tree T4 (Fig. 1), a discrete approximation of the gamma distribution (a51.0, 8 categories) and GTR model. Indel rates were set at 0.1, 0.2, 0.3, 0.4 and 0.5, with insertion rate5deletion rate; these rates are relative to site substitution rate of 1. Length distribution of inserted/deleted fragments follows a Lavalette distribution33,34(a51.1; maximum indel size 100 nt) as implemented in INDELible32.
Coalescent model of gene family evolution.We used NetRecodon57to simulate gene family evolution under the coalescence model along a tree, each case at a defined effective population size (Ne) of 1000, 10000, 100000, 250000, 500000 and 1000000, with a discrete approximation of the gamma distribution (a50.5, 8 categories), GTR model and mutation rateu51025. Sequence sets of sizeN532 (L51500 nt) were used. LargerNevalues result in longer branch lengths on a tree (see Supplementary Table S1). To simulate violation of molecular clock, relaxed branch lengths were further simulated on these trees usingBranchRelaxerin GenPhyloData58, with substitution rates along branches modelled as independent and identically distributed variables in a log-normal scale (IIDLogNormal model: mean 0.0, variance 1.0)59. Sequences were then simulated usingevolveralong these new trees as per above.
Empirical sequence data.All 2471 nucleotide datasets in NEXUS format were downloaded from TreeBASE (treebase.org as of 27 May 2013)41using a custom script kindly provided by Dr William Piel. For each dataset, one or more nucleotide sequence alignment and their corresponding phylogenetic trees (totalling 4156) were extracted (Supplementary Data). All 406997 unaligned 16S ribosomal RNA gene sequences (sequences_16S_all_gg_2011_1_unaligned.fasta.gz)60were downloaded from the GreenGenes database (secondgenome.com/go/2011-greengenes-taxonomy). To assess scalability ofD2methods on different sizes of sequence sets, these 406997 sequences were randomly selected across setN51000, 2000, 3000, 4000 and 5000, each in 100 replicates. We follow ref. 61 in defining within-set sequence similarity as the average pairwise similarity between each sequence in a set to the centroid sequence. A centroid sequence within a set is one that yielded the single highest bit score across all pairwise comparisons within the set using BLAST (e, 1023).
Alignment-free phylogenetic approach.For each sequence set, we usedD2statistics independently forD2,DS2,D2, andDn
~1
2 to generate a score for each possible pair of sequences within a set (see Supplementary Note for details). These scores were transformedvialogarithmic representation of the geometric mean to generate a distance. The pairwise distance between sequencesaandb,Dabis defined as
Dab~ln Sab ffiffiffiffiffiffiffiffiffiffiffiffiffiffiffiffiffi Saa|Sbb p
whereSabis the pairwise score between them, andSaaandSbbare the self-matching scores. These transformed pairwise distances closely approximate the angle-based distances in an earlier alignment-free method for inferring protein phylogenies62. The resulting distance matrix was used to reconstruct a phylogenetic tree usingneighbor
in PHYLIP v3.69 (evolution.genetics.washington.edu/phylip). Generation of the distance matrix from any of theseD2methods is implemented in a JAVA program, JIWA, which is freely available at http://bioinformatics.org.au/tools/jiwa/.
Standard phylogenetic approach using multiple sequence alignment.For each sequence set, we used MUSCLE v3.8.3126to generate a multiple sequence alignment. For scenarios of genetic rearrangement, insertions/deletions and the coalescent model, we also used MAFFT (mafft-linsi) v7.158b46. For other simulated scenarios, alignments were perfectly given during the process of simulation; the use of any MSA tool would not yield any difference in the final alignments. For Bayesian phylogenetic inference, we used MrBayes v3.2.127(MCMC ngen51500000 generations, samplefreq5100, burn-in510000 samples, temp50.5, nchains54; sumt contype 5allcompat). We assume the general reversible substitution model (lset Nucmodel5 4by4 Nst56) and a mixed amino acid substitution model (prset aamodel5mixed)
respectively for nucleotide and protein sequences, under a four-category discrete gamma distribution across all runs (lset rate5gamma ngammacat54). In all cases except the insertions/deletions analysis, the standard deviation of split frequencies was,0.01 after 200000 generations. For insertions/deletions analysis, MrBayes was run at larger number of MCMC generations (ngen55000000) and burnin (samplefreq5100, burn-in525000 samples), while other parameters remain the same. The standard deviation of split frequencies in most cases was,0.01 after 1000000 generations. For maximum likelihood inference of phylogenetic trees, we used RAxML v8.0.236(-# 100, -t 4, -m GTRGAMMA or PROTGAMMAWAG respectively for nucleotide and protein sequences).
Assessment of accuracy.For each tree generated from a sequence set usingD2 statistics or the standard approach, we compared its topological congruence to a reference tree using the Robinson-Foulds distance28, as implemented intreedistin PHYLIP v3.69 (evolution.genetics.washington.edu/phylip). This distance represents the number of splits (i.e. bipartitions) that are present in only one of the two trees. To facilitate comparison of our results across trees (i.e. sequence sets) of various sizesN, we normalised the distances by the maximum possible distance between two unrooted trees, 2(N23), following ref. 63. Here we denoteRFas the normalised Robinson-Foulds distance, with a value between 0 and 1 that can be interpreted as the proportion of false or missing bipartitions in the test tree topology compared to the reference topology63. WhenRF50, the test and reference topologies are identical, suggesting high accuracy of the approach. WhenRF51, none of the bipartitions in the reference is recovered in the test. In these cases, the trees could have been generated at random, as a pair of randomly generated tree topologies ofNtaxa has a Robinson-Foulds distance that approximates the denominator for normalisation, 2(N23)64. For the simulated data, we used the known tree (under which the sequences were simulated) as the reference. For empirical data from TreeBASE we used the published tree in the database as reference; in these cases, a zeroRFdoes not relate directly to accuracy, but rather reflects the extent to which our method recovers the same topology as the published method based on multiple sequence alignment.
Assessment of computational scalability and runtime.The assessment of computational scalability was carried out using a high-performance distributed-memory computing cluster based on Intel Sandy Bridge 8-core 2.6 GHz processors. Comparative runtime analysis of alignment-free and MSA-based phylogenetic approaches was done on Intel Xeon L5520 8-core 2.26 GHz processors (multi-threaded, four threads). MCMC ngen51500000 was used for MrBayes runs.
1. Edgar, R. C. & Batzoglou, S. Multiple sequence alignment.Curr. Opin. Struct. Biol.
16, 368–373 (2006).
2. Notredame, C. Recent evolutions of multiple sequence alignment algorithms.
PLoS Comput. Biol.3, 1405–1408 (2007).
3. Darling, A. E., Miklos, I. & Ragan, M. A. Dynamics of genome rearrangement in bacterial populations.PLoS Genet.4, e1000128 (2008).
4. Puigbo`, P., Wolf, Y. I. & Koonin, E. V. The tree and net components of prokaryote evolution.Genome Biol. Evol.2, 745–756 (2010).
5. Zhaxybayeva, O. & Doolittle, W. F. Lateral gene transfer.Curr. Biol.21, R242–246 (2011).
6. Wong, K. M., Suchard, M. A. & Huelsenbeck, J. P. Alignment uncertainty and genomic analysis.Science319, 473–476 (2008).
7. Wu, M. T., Chatterji, S. & Eisen, J. A. Accounting for alignment uncertainty in phylogenomics.PLoS ONE7, e30288 (2012).
8. Chan, C. X. & Ragan, M. A. Next-generation phylogenomics.Biol. Direct8, 3 (2013).
9. Ho¨hl, M. & Ragan, M. A. Is multiple-sequence alignment required for accurate inference of phylogeny?Syst. Biol.56, 206–221 (2007).
10. Ho¨hl, M., Rigoutsos, I. & Ragan, M. A. Pattern-based phylogenetic distance estimation and tree reconstruction.Evol Bioinform Online2, 359–375 (2006). 11. Domazet-Losˇo, M. & Haubold, B. Alignment-free detection of local similarity
among viral and bacterial genomes.Bioinformatics27, 1466–1472 (2011). 12. Vinga, S. & Almeida, J. Alignment-free sequence comparison - a review.
Bioinformatics19, 513–523 (2003).
13. Bonham-Carter, O., Steele, J. & Bastola, D. Alignment-free genetic sequence comparisons: a review of recent approaches by word analysis.Brief. Bioinform., In Press, DOI:10.1093/bib/bbt052 (2013).
14. Haubold, B. Alignment-free phylogenetics and population genetics.Brief. Bioinform.15, 407–418 (2014).
15. Song, K.et al. New developments of alignment-free sequence comparison: measures, statistics and next-generation sequencing.Brief. Bioinform.15, 343–353 (2014).
16. Torney, D. C., Burks, C., Davison, D. & Sirotkin, K. M. inComputers and DNA -Santa Fe Institute Studies in the Sciences of Complexity, Vol. 7(eds. Bell, G. & Marr, R.) 109–125 (Addison-Wesley, Reading, MA; 1990).
17. Wan, L., Reinert, G., Sun, F. & Waterman, M. S. Alignment-free sequence comparison (II): theoretical power of comparison statistics.J Comput. Biol.17, 1467–1490 (2010).
18. Reinert, G., Chew, D., Sun, F. & Waterman, M. S. Alignment-free sequence comparison (I): statistics and power.J Comput. Biol.16, 1615–1634 (2009). 19. Hide, W., Burke, J. & Davison, D. B. Biological evaluation of d2, an algorithm for
high-performance sequence comparison.J Comput. Biol.1, 199–215 (1994).
www.nature.com/
scientificreports
20. Miller, R. T.et al. A comprehensive approach to clustering of expressed human gene sequence: the sequence tag alignment and consensus knowledge base.
Genome Res.9, 1143–1155 (1999).
21. Guindon, S.et al. New algorithms and methods to estimate maximum-likelihood phylogenies: assessing the performance of PhyML 3.0.Syst. Biol.59, 307–321 (2010).
22. Price, M. N., Dehal, P. S. & Arkin, A. P. FastTree 2 – approximately maximum-likelihood trees for large alignments.PLoS ONE5, e9490 (2010).
23. Altschul, S. F., Gish, W., Miller, W., Myers, E. W. & Lipman, D. J. Basic local alignment search tool.J. Mol. Biol.215, 403–410 (1990).
24. Go¨ke, J., Schulz, M. H., Lasserre, J. & Vingron, M. Estimation of pairwise sequence similarity of mammalian enhancers with word neighbourhood counts.
Bioinformatics28, 656–663 (2012).
25. Yi, H. & Jin, L. Co-phylog: an assembly-free phylogenomic approach for closely related organisms.Nucleic Acids Res.41, e75 (2013).
26. Edgar, R. C. MUSCLE: multiple sequence alignment with high accuracy and high throughput.Nucleic Acids Res.32, 1792–1797 (2004).
27. Ronquist, F.et al. MrBayes 3.2: efficient Bayesian phylogenetic inference and model choice across a large model space.Syst. Biol.61, 539–542 (2012). 28. Robinson, D. F. & Foulds, L. R. Comparison of phylogenetic trees.Math. Biosci.
53, 131–147 (1981).
29. Foreˆt, S., Wilson, S. R. & Burden, C. J. Empirical distribution ofk-word matches in biological sequences.Pattern Recognit.42, 539–548 (2009).
30. Foreˆt, S., Kantorovitz, M. R. & Burden, C. J. Asymptotic behaviour and optimal word size for exact and approximate word matches between random sequences.
BMC Bioinformatics7 Suppl 5, S21 (2006).
31. Huffman, D. A. A method for the construction of minimum-redundancy codes.
Proc. IRE40, 1098–1101 (1952).
32. Fletcher, W. & Yang, Z. INDELible: a flexible simulator of biological sequence evolution.Mol. Biol. Evol.26, 1879–1888 (2009).
33. Lavalette, D. Facteur d’impact: impartialite´ ou impuissance? (INSERM U350 Institut Curie-Recherche, Baˆt. 112, Centre Universitaire, Orsay, France; 1996). 34. Popescu, I. I. On a Zipf’s Law extension to impact factors.Glottometrics6, 83–93
(2003).
35. Stamatakis, A. RAxML-VI-HPC: maximum likelihood-based phylogenetic analyses with thousands of taxa and mixed models.Bioinformatics22, 2688–2690 (2006).
36. Stamatakis, A. RAxML version 8: a tool for phylogenetic analysis and post-analysis of large phylogenies.Bioinformatics30, 1312–1313 (2014).
37. Golubchik, T., Wise, M. J., Easteal, S. & Jermiin, L. S. Mind the gaps: evidence of bias in estimates of multiple sequence alignments.Mol. Biol. Evol.24, 2433–2442 (2007).
38. Kingman, J. F. C. The coalescent.Stoch. Proc. Appl.13, 235–248 (1982). 39. Tellier, A. & Lemaire, C. Coalescence 2.0: a multiple branching of recent
theoretical developments and their applications.Mol. Ecol.23, 2637–2652 (2014). 40. Sjo¨din, P., Kaj, I., Krone, S., Lascoux, M. & Nordborg, M. On the meaning and
existence of an effective population size.Genetics169, 1061–1070 (2005). 41. Piel, W. H., Donoghue, M. J. & Sanderson, M. J. inTo the interoperable ‘‘Catalog of
Life’’ with partners Species 2000 Asia Oceania. NIES Research Report,Vol. 171(eds. Shimura, J., Wilson, K. L. & Gordon, D.) 41–47 (National Institute for Environmental Studies, Tsukuba, Japan; 2002).
42. Posada, D. Phylogenetic models of molecular evolution: next-generation data, fit, and performance.J. Mol. Evol.76, 351–352 (2013).
43. Ragan, M. A. & Chan, C. X. Biological intuition in alignment-free methods: response to Posada.J. Mol. Evol.77, 1–2 (2013).
44. Ragan, M. A., Bernard, G. & Chan, C. X. Molecular phylogenetics before sequences: Oligonucleotide catalogs ask-mer spectra.RNA Biol.11, 176–185 (2014).
45. Chan, C. X., Darling, A. E., Beiko, R. G. & Ragan, M. A. Are protein domains modules of lateral genetic transfer?PLoS ONE4, e4524 (2009).
46. Katoh, K. & Standley, D. M. MAFFT multiple sequence alignment software version 7: improvements in performance and usability.Mol. Biol. Evol.30, 772–780 (2013).
47. Thompson, J. D., Linard, B., Lecompte, O. & Poch, O. A comprehensive benchmark study of multiple sequence alignment methods: current challenges and future perspectives.PLoS ONE6, e18093 (2011).
48. Liu, K., Linder, C. R. & Warnow, T. RAxML and FastTree: comparing two methods for large-scale maximum likelihood phylogeny estimation.PLoS ONE6, e27731 (2011).
49. Gunasinghe, U., Alahakoon, D. & Bedingfield, S. Extraction of high qualityk -words for alignment-free sequence comparison.J. Theor. Biol.358, 31–51 (2014).
50. Haubold, B. & Pfaffelhuber, P. Alignment-free population genomics: an efficient estimator of sequence diversity.G32, 883–889 (2012).
51. Fitch, W. M. & Margoliash, E. Construction of phylogenetic trees.Science155, 279–284 (1967).
52. Burden, C. J., Kantorovitz, M. R. & Wilson, S. R. Approximate word matches between two random sequences.Ann. Appl. Probab.18, 1–21 (2008). 53. Yang, Z. PAML 4: phylogenetic analysis by maximum likelihood.Mol. Biol. Evol.
24, 1586–1591 (2007).
54. Tavare´, S. Some probabilistic and statistical problems in the analysis of DNA sequences.Lect. Math. Life Sci.17, 57–86 (1986).
55. Yang, Z. Estimating the pattern of nucleotide substitution.J. Mol. Evol.39, 105–111 (1994).
56. Whelan, S. & Goldman, N. A general empirical model of protein evolution derived from multiple protein families using a maximum-likelihood approach.Mol. Biol. Evol.18, 691–699 (2001).
57. Arenas, M. & Posada, D. Coalescent simulation of intracodon recombination.
Genetics184, 429–437 (2010).
58. Sjo¨strand, J., Arvestad, L., Lagergren, J. & Sennblad, B. GenPhyloData: realistic simulation of gene family evolution.BMC Bioinformatics14, 209 (2013). 59. Drummond, A. J., Ho, S. Y., Phillips, M. J. & Rambaut, A. Relaxed phylogenetics
and dating with confidence.PLoS Biol.4, e88 (2006).
60. McDonald, D.et al. An improved Greengenes taxonomy with explicit ranks for ecological and evolutionary analyses of bacteria and archaea.ISME J.6, 610–618 (2012).
61. Chan, C. X., Mahbob, M. & Ragan, M. A. Clustering evolving proteins into homologous families.BMC Bioinformatics14, 120 (2013).
62. Stuart, G. W., Moffett, K. & Baker, S. Integrated gene and species phylogenies from unaligned whole genome protein sequences.Bioinformatics18, 100–108 (2002). 63. Kupczok, A., Schmidt, H. & von Haeseler, A. Accuracy of phylogeny
reconstruction methods combining overlapping gene data sets.Algorithms Mol. Biol.5, 37 (2010).
64. Bryant, D. & Steel, M. Computing the distribution of a tree metric.IEEE/ACM Trans. Comput. Biol. Bioinform.6, 420–426 (2009).
Acknowledgments
We thank The University of Queensland and James S McDonnell Foundation for financial support. CXC is supported by a University of Queensland Early Career Researcher grant. This work was supported by computational resources of the National Computational Infrastructure (NCI) National Facility systems and NCI Specialised Facility in Bioinformatics through the NCI Merit Allocation Scheme (Project d85). We thank Professor Michael Waterman for helpful suggestions, and Dr Lars Jermiin and Professor David Penny for their constructive feedback on this work.
Author contributions
C.X.C., J.M.H. and M.A.R. conceived the project. C.X.C., G.B. and M.A.R. designed the experiments, C.X.C., G.B. and O.P. implemented the analysis workflow and conducted the experiments, C.X.C., G.B., J.M.H. and M.A.R. analysed and interpreted the results, C.X.C. prepared all figures and tables, C.X.C. and M.A.R. prepared and wrote the manuscript. All authors reviewed, commented on and approved the final manuscript.
Additional information
Supplementary informationaccompanies this paper at http://www.nature.com/ scientificreports
Competing financial interests:The authors declare no competing financial interests.
How to cite this article:Chan, C.X., Bernard, G., Poirion, O., Hogan, J.M. & Ragan, M.A. Inferring phylogenies of evolving sequences without multiple sequence alignment.Sci. Rep. 4, 6504; DOI:10.1038/srep06504 (2014).
This work is licensed under a Creative Commons Attribution-NonCommercial-ShareAlike 4.0 International License. The images or other third party material in this article are included in the article’s Creative Commons license, unless indicated otherwise in the credit line; if the material is not included under the Creative Commons license, users will need to obtain permission from the license holder in order to reproduce the material. To view a copy of this license, visit http:// creativecommons.org/licenses/by-nc-sa/4.0/