Journal of Electrical Engineering and Information Technologies, Vol. 5, No. 1, pp. 13–22 (2020)
Article 167 ISSN 2545–4250
Received: March 3, 2020 e: ISSN 2545–4269
Accepted: April 30, 2020 UDC: 621.311.21-5
Original scientific paper
OPERATING MODES OF COMPLEX HYDROPOWER SYSTEMS
Sofija Nikolova Poceva, Anton Čauševski
Faculty of Electrical Engineering and Information Technologies, "Ss. Cyril and Methodius" University in Skopje,
P.O. box 574, 1001 Skopje, North Macedonia
A b s t r a c t: The paper presents the methodology of operation modes for hydropower plants (conventional and pump storage) in a complex hydroenergy system. Operation involves water management in generating and/or pumping mode of hydropower units taking into accounts technical characteristics of the power plants facilities (turbine/generator and pump/motor systems), reservoirs characteristics considering all hydraulically connected infrastructures, as well as the hydrological conditions (for run offs and turbine inflows). The purpose of the operating mode for the entire hydropower system is to maximize financial profits from electricity generation, taking into account market electricity prices, electricity needs, with respecting the technical requirements and of course avoiding or minimizing overflow. Operating regimes depend on the electricity market price, the tariff models and the duration of each tariff (base, peak), the tech-nical characteristics of the units and the hydrological conditions. The model application is presented at the hydropower Complex on the Crn Drim river with existing construction and new facilities that can be upgraded in the future. The results are presented for long-term and short-term planning of the system operation under various technical and hydrological conditions. The model can be used to perform preliminary analyses in order to improve hydroenergy systems with additional installed capacity of the existing system. Selected outputs are presented with appropriate comparisons and conclusions.
Key words: generation; hydropower plant; pump; operation modes
РАБОТНИ РЕЖИМИ НА КОМПЛЕКСНИ ХИДРОЕНЕРГЕТСКИ СИСТЕМИ A п с т р а к т: Во трудот се презентира методологијата на оперативна работа на хидроцентрали (конвен-ционални и пумпно-акумулациони) во сложен хидроенергетски систем. Оперативноста вклучува управување со водите во генераторски и/или пумпен режим на хидроелектраните, земајќи ги предвид техничките каракте-ристики на производните постројки (турбина/генератор и пумпа/мотор), како и карактекаракте-ристиките на акумула-циите со хидрауличната инфраструктура поврзана со системот, како и хидролошките услови. Целта на опера-тивниот режим за целиот хидроенергетски систем е да се добие максимален профит од производството на елек-трична енергија, земајќи ги предвид пазарните цени на елекелек-трична енергија, потребите од елекелек-трична енергија, почитувајќи ги техничките услови и, секако, да се избегне или минимизира прелевање. Работните режими на хидроцентралите зависат од пазарнта цена на електрична енергија, тарифните модели и времето на траење на секоја тарифа (базна, највисока), техничките карактеристики на единиците и хидролошките прилики. Аплика-цијата на моделот е претставена на хидроенергетскиот комплекс на реката Црн Дрим со постојната изграденост и со нови објекти кои можат во иднина да се доградат. Резултатите се презентирани за долгорочно и кратко-рочно планирање на работата на системот при разни услови и хидролошки прилики. Моделот може да се користи за правење прелиминарни анализи за подобрување на хидросистемите со дополнително инсталирана моќност на постојниот систем. Избраните излезни резултати се презентирани со соодветно споредување и со заклучоци. Клучни зборови:. производство; хидроелектрична централа; пумпа; оперативни режими 1. INTRODUCTION
Тhe paper presents a model for different oper-ation modes of hydraulically connected hydropower
system (HPS) that consists of reservoirs, pipe-con-nected lines and hydropower plants. The operating modes can be distinguished depending on time in-terval planning (year, season or month for long term
(LT) and week, few days or a day for short term (ST)). The model takes into account the technical specifications and the parameters of the whole system such as:
• Volume of the water reservoirs with limitation of minimal and maximum elevation of the reservoirs.
• Turbine units characteristics (flows, power).
• Other technical constraints and specifications of the elements of the hydropower system.
• Connected infrastructure of lines and pipes. The model is applied on an existing hydro-power system built on the Crn Drim river, by taking into account the existing power system as well as the other reservoirs and power generation units in new HPPs, which are considered to be built in next period.
2. MODEL OF OPERATING MODES The model gives the main outputs of hydro-power system depending on hydro-power system operator requirements and demand, and it takes into account the input of water run offs with respect to the system technical conditions. The modeling approaches de-pend on LT or ST operation modes. In the LT oper-ation modes, the whole considering time period (T) can be a year or a few years divided in months’ or weeks’ time intervals (t) (it depends on the availa-bility of hydrological data) and it mainly considers the large reservoirs. In the ST operation modes, the whole observed time period (T) can be a week or several days divided in hourly intervals (t) by mainly taking into account the water management for small reservoirs in a daily regulation. The output results from the model are the turbine discharges, and the electricity production of HPPs as well as the reservoir level for each time interval (t) of the ob-served time period T. In order to simulate the oper-ation regimes of the whole system, it is necessary to know the characteristics of the reservoirs. The mod-eling of the characteristic of the all reservoirs is done according [4], by making use of two functions: the volume dependence of the attitude and vice versa, and the attitude dependence of the volume ex-pressed by (1) and (2), respectively:
𝑉ol(𝐴𝑡𝑡) = 2 ∙ π ∙ (𝐴 + 𝐵 ∙ 𝐴𝑡𝑡 + 𝐶 ∙ 𝐴𝑡𝑡2) (1)
𝐴𝑡𝑡(𝑉𝑜𝑙) = 𝑔 + ℎ ∙ (𝑉ol − 𝑑)e (2)
The simulations of the operating regimes are done by taking into account the characteristics of the
reservoirs, the water inflows and the turbine charac-teristics of the HPPs. The inputs in the model are: average inflows and run offs for the time intervals, the characteristic of the electric power output P = f
(Qtur, Hgross) as a function of the turbine flow (Qtur)
and the gross head and the reservoirs characteristics defined by (1) and (2). In order to perform a finan-cial analysis, it is necessary to have the electricity prices. Therefore, the following conditions and assumptions are taking into accounts in the model:
• The reservoirs level are within the allowed limits and possible spilling is avoided.
• The turbine flow priority is to obtain maximum revenue from the generated electricity accord-ing to the electricity market prices for each peri-od of the day.
Based on aforementioned criteria, the follow-ing output results can be obtained:
• consumed water volume in each time period (year, month, week and day) for each reservoir;
• output power for each time period P(t);
• generated electricity for each time period W(t);
• financial profit from the sold electricity (FIN). The methodology for the operation modes of the hydropower plants can be used for different needs depending on the input data and the require-ments requested by the utility or operator of the power plant.
Some of the possible applications are hydro-power systems from simple to complex technical hydraulically configuration and connectivity for different time period of consideration (T) as: few years, a year, season, week, only a day. The period of consideration can be divided in different time intervals ∆𝑡𝑖, where
𝑇 = ∑ ∆𝑡𝑖
𝑛 𝑖=1
.
3. HYDROPOWER SYSTEM OF CRN DRIM (EXISTING AND ADDITIONAL UNITS)
The existing hydropower system (HPS) of the Crn Drim river (Figure 1), consists of two hydro-power plants (HPP Globočica 2×21 MW and full turbine discharge of 50 m3/s) and HPP Špilje
(3×28 MW and full turbine discharge of 108 m3/s),
three reservoirs (RES 1 – Ohrid Lake, RES 2 – Globočica, and RES 3 – Debar Lake) with main run offs from two rivers (Crn Drim and Radika).
HPP Globočica with two units is the first upper stream power plant in HPS. Crn Drim is a derivative
power plant that uses the water from RES 1 of Ohrid Lake. Each of the two units is 25 m3/s or 50 m3/s in
total, with a total installed capacity of 42 MW, have gross head of 108 – 110 m. The turbine flow from the Globočica HPP and the Radika river are the main runoffs for RES 3 of Debar Lake which is the reservoir of HPP Špilje. Existing HPP Špilje has 3 units with 36 m3/s each or 108 m3/s in total, with a
gross head of 80 – 100 m, and a total installed capac-ity of 84 MW. Figure 1 schematically presents the existing HPS of Crn Drim with planned new hydro-power plants and new RES 4 – Tašmaruništa for new additional reversible HPP.
Fig. 1. Hydraulically connected HPS of Crn Drim (existing and new reservoirs and units)
The new generating units are in HPP Globo-čica 2 with a unit of 20 m3/s turbine flow and 12
MW installed power, located in the new turbine hall with a 70 m gross head. The additional unit in HPP Špilje has 36 m3/s turbine flow and 28 MW installed
power; the same as the existing ones which are lo-cated in the same turbine hall [1]. The new reversi-ble (pump storage) HPP Tašmaruništa is added to the upper reservoir RES 4 оf Tašmaruništa on the Crn Drim system. The others basic technical para-meters (from [2] and [3]) as the reservoirs’ volumes, the attitudes of the turbines, the minimum and maxi-mum reservoir levels, the turbine flows and the in-stalled power are given in Figure 1. Therefore, the whole hydropower system, which is considered in this paper, consists of four reservoirs with basic information shown in Table 1 and HPPs with some technical characteristics given on Table 2.
The large reservoirs, RES 1 of Ohrid Lake and RES 3 of Debar Lake, are important for long-term analyses (seasonal, annual and multi-year). The small reservoirs, RES 2 of Globočica and RES 4 of Tašmaruništa, can be taken in short-term analyses as daily, several days or weekly analyses. The para-meters obtained according to (1) for all reservoirs are given in Table 3a.
The parameters according the formula (2) for all reservoirs are given in Table 3b.
T a b l e 1
Characteristics of the reservoirs of the HPS of Crn Drim
E x i s t i n g New RES 1 RES 2 RES 3 RES 4 Att.max (a.s.l.) 693.75 687.5 580 1022 Att.min (a.s.l.) 693.10 682 560 992 Vol. (Mm3) 228.00 13.20 212.00 6.00
T a b l e 2
HPPs characteristics in the HPS of Crn Drim
No. of units Qinst (m3/s) Hgross (m) Pinst (MW) Exist. HPP Špilje 3 108 75 – 95 84 Exist. HPP Globočica 2 50 102 – 105 42 New HPP Špilje 4 unit 1 36 75 – 95 28 New HPP Globočica 2 1 20 70 12
New Rev HPP Tasm. 2 Qt = 50,
Qp = 40
305 – 335 150
T a b l e 3a
The parameters for all reservoirs according (1)
A B C RES 1 1,64·106 –4863 3.60 RES 2 4135 –13 0.01 RES 3 5790 –23 0.02 RES 4 996 –2 0.001 T a b l e 3b
The parameters for all reservoirs according (2)
g d h e
RES 1 675 –3136 0.3 0.5 RES 2 640 –48 6.1 0.5 RES 3 500 –194 4 0.5 RES 4 971 –1,2 19 0.5
3.1. Long term (LT) operation modes of HPS Crn Drim
The simulations for the HPS of Crn Drim for LT operation modes are made on the monthly basis time interval (t = 1 month) during the whole period of the year (T = 1 year). The main idea of the simulation is to find the operational regimes with a maximum financial benefit under new market conditions with electricity prices present on the open market with different tariffs (Figure 2).
Fig. 2: Daily tariffs and electricity price C (€/MWh) from the HUPEX in 2018
The time periods for each day are divided into 2 groups (tariffs) for long-term operation modes (Base tariff (Cbase) and Peak tariff (Cpeak)). The water
inflow for HPP Globočica (Qin,GL) is predominantly
from the Lake of Ohrid (Qin,OH), and the additional
runoffs (Qin,add):
𝑄in,GL(𝑡) = 𝑄in,OH(𝑡) + 𝑄in,add(𝑡) (3)
The water inflow for HPP Špilje (Qin,SP)
mainly depends on the turbine flow of HPP Globočica (Qtur,GL) and the natural runoff from the
Radika river (Qin,Rad):
𝑄in,SP(𝑡) = 𝑄tur,GL(𝑡) + 𝑄in,Rad(𝑡). (4)
According to the natural flows obtained from the available hydrological data [2], three character-istic hydrological years have been selected in yearly operating modes: 2001 – as a dry year representa-tive, 2006 – as an average year representarepresenta-tive, and 2013 – as a wet year representative. Figures 3 and 4 show the monthly water inflows for the reservoirs in HPP Globočica and HPP Špilje, respectively, in each of the representative year.
The starting value of the reservoirs level at the 1st of January is common for all simulations; for
Ohrid Lake is 693.3 a.s.l. and for Debar Lake is 563 a.s.l. The simulation results are obtained for three years (dry 2001, average 2006 and wet 2013). The
results of the representative of the wet year: the res-ervoir level of Ohrid Lake and the spent volume of water for HPP Globočica are presented in Figures 5a and 5b, respectively..
Fig. 3. Monthly water inflows for the RES 2 of Ohrid Lake
Fig. 4. Monthly water inflows for the RES 3 of Debar Lake from the Radika river
Fig. 5a. Reservoir level of Ohrid Lake in wet 2013
Fig. 5b. Spent volume of water in HPP Globočica for each month in wet 2013
0 10 20 30 40 50 60 70 80 90 1 2 3 4 5 6 7 8 9 10 11 12 Euro/MWh
C base (00-24) C peak (08-20) C Rush Hour (16-20) C off (00-06)
0 10 20 30 40 50 60 70 80 90 1 2 3 4 5 6 7 8 9 10 11 12
Run off in RES 2 Glob (m3/s)
2001 dry 2006 average 2013 wet
0 20 40 60 80 100 120 140 1 2 3 4 5 6 7 8 9 10 11 12
Run off from Radika in RES 3 (m3/s)
2001 dry 2006 average 2013 wet
693.10 693.20 693.30 693.40 693.50 693.60 693.70 693.80 693.90 1 2 3 4 5 6 7 8 9 10 11 12
Level of Ohrid Lake (asl)
-80.00 -60.00 -40.00 -20.00 0.00 20.00 40.00 60.00 80.00 1 2 3 4 5 6 7 8 9 10 11 12 dV_GL (Mil.m3)
Figures 6a and 6b present the results for the reservoir level of Debar Lake and the used volume of water for HPP Špilje (dV_SP), respectively.
Fig. 6a. Reservoir level of Debar Lake in wet 2013
Fig. 6b. Spent volume of water in HPP Špilje for each month in wet 2013
For LT operation modes, the reversible HPP Tašmaruništa is not considered, but only the con-ventional HPP Špilje and HPP Globočica (Figure 7).
Fig. 7. HPS considering for long-term (LT) operation modes
In order to avoid overflowing and spilling, the operation with maximum installed turbine flow for both HPPs is in the first months. The total balance of the both HPPs in the HPS on Crn Drim in gener-ated electricity and financial income from the sold electricity is given in Table 4. The total generated electricity consists of 2 parts, base and peak part, in where the income results from, and the third part is lost electricity (negative one) because spilling. Therefore, for wet 2013, all HPPs in the HPS of Crn Drim give:
• Production of around 658 GWh with total electricity sale of approximately 34.3 million euros.
• Overflow (spillway) of about 36 GWh with a total loss of un-produced electricity of about 1.2 million euros.
T a b l e 4
Generated electricity and financial income for the wet 2013 in case with existing and additional units in the HPS of Crn Drim
Generated electricity
W (MWh)
Financial income
FIN (mil.Euros) Base Peak Spill Base Peak Spill 1 0 39717 0 0.00 2.13 0.00 2 0 35525 0 0.00 2.09 0.00 3 31329 23489 0 1.27 1.52 0,00 4 90595 36202 –36202 2.89 1.67 –1.20 5 63037 15665 0 2.66 1.41 0.00 6 35456 27876 0 1.82 2.42 0.00 7 0 26575 0 0.00 1.43 0.00 8 0 43686 0 0.00 2.84 0.00 9 0 32167 0 0.00 2.26 0.00 10 0 33289 0 0.00 3.07 0.00 11 0 31409 0 0.00 3.06 0.00 12 0 31811 0 0.00 3.00 0,00 S 220417 377410 –36202 8.63 26.91 –1.20 Total 657990 34.35
Figure 8 gives graphical presentation of the generated electricity in each month for the whole HPS of Crn Drim in 2013. The lost electricity because spilling is negative (below the horizontal axis in month of April).
550.00 555.00 560.00 565.00 570.00 575.00 580.00 585.00 1 2 3 4 5 6 7 8 9 10 11 12 Level of Debar Lake (asl)
-100.00 -50.00 0.00 50.00 100.00 150.00 200.00 1 2 3 4 5 6 7 8 9 10 11 12 dV_SP (Mil.m3)
RES 1- Ohrid Lake V=228 Mm3
RES 2 - Globocica Lake V=13,2 Mm3 HPP Globocica 2x21 MW HPP Spilje 3x28 MW Radika River River Crn Drim New HPP Globocica 2 1x20 m3/s, 12MW
RES 3- Debar Lake V=212 Mm3 580 a.s.l. 682 – 687,5 a.s.l 693,10 – 693,75 a.s.l 560 – 580 a.s.l 480 a.s.l. Qin,OH Qin,add River Crn Drim
New Unit in Spilje 1x36 m3/s, 28MW
Fig. 8. Monthly production for the HPS Crn Drim in wet 2013
According to the calculation performed for all cases and for all representative years, results are compared and analyzed in order to provide answer about the benefit of additional units installed in the HPS of Crn Drim, which is useful for further techno-economic analyses. Table 5 and Figure 9 show the generated electricity and lost energy in spilling, for all representative years.
T a b l e 5
Generated electricity and spilled energy in MWh for all cases for the HPS of Crn Drim
Dry 2001 Aver. 2006 Wet 2013
Wbase 0 88440 220417
Wpeak 194431 498460 473774
Wspill 0 0 –36202
Total 194431 586900 657990
Fig. 9. Comparing the output energy for all cases
The results show that the increased production and income can be got in additional units in peak tariffs with high prices. Another benefit resulting from the use of additional units is having reduced
the lost energy of the spilling in wet 2013 down to 36202 MWh, and the difference goes to additional peak electricity of the system. Table 6 and Figure 10 show the income obtained from the generated elec-tricity in euros by taking into account the lost energy resulting from spilling.
T a b l e 6
Financial benefit from the income (in €) for all cases for the HPS of Crn Drim
Dry 2001 Aver. 2006 Wet 2013 FINbase 0 3866861 8634785
FINpeak 10785275 28128836 26909732
FINspill 0 0 –1196258
Total 10785275 31995696 34348258
Fig. 10. Comparing the income (in €) for all cases
The overall benefit are: for the dry 2001 is proximately 10.5 M€, for the average 2006 is ap-proximately 32 M€ and for the wet 2013 is approx-imately 34.2 M€.
3.2. Short-term (ST) operation modes for the HPS of Crn Drim
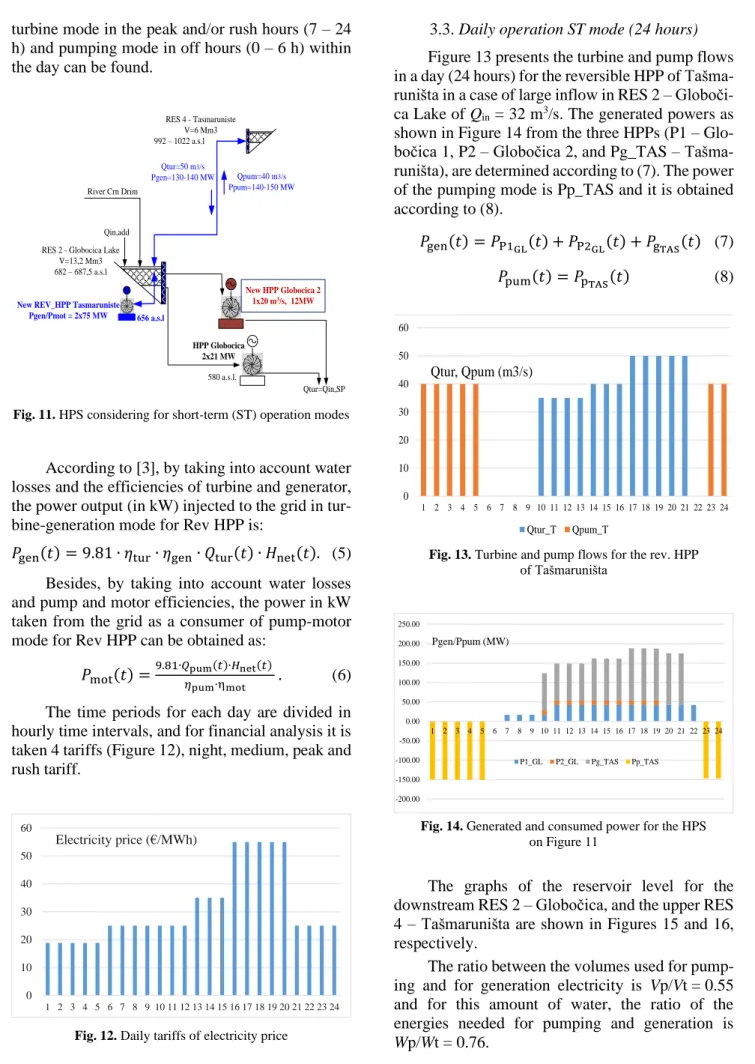
The simulations of ST operating modes for the HPS of Crn Drim are performed for some character-istics days, with the inputs taken from the LT results especially water inflows and turbine discharges. The main point in ST planning is focused on the op-eration of the reversible HPP of Tašmaruništa with the HPP of Globočica (Figure 11), and the water managing between downstream RES 2 of Globočica and upstream RES 4 of Tašmaruništa. The LT ope-ration modes are made on the hourly time interval (t = 1 hour) during the whole period of a year (T = 1 day/week). In this way, the operation of
-60000 -40000 -20000 0 20000 40000 60000 80000 100000 120000 140000 160000 1 2 3 4 5 6 7 8 9 10 11 12 W (MWh)
Wbase Wpeak Wspill
-100000 0 100000 200000 300000 400000 500000 600000 700000 800000
Dry 2001 Aver. 2006 Wet 2013
W (MWh)
Wbase Wpeak Wspill
-5000000 0 5000000 10000000 15000000 20000000 25000000 30000000 35000000 40000000
Dry 2001 Aver. 2006 Wet 2013
FIN (Euro)
turbine mode in the peak and/or rush hours (7 – 24 h) and pumping mode in off hours (0 – 6 h) within the day can be fоund.
Fig. 11. HPS considering for short-term (ST) operation modes
According to [3], by taking into account water losses and the efficiencies of turbine and generator, the power output (in kW) injected to the grid in tur-bine-generation mode for Rev HPP is:
𝑃gen(𝑡) = 9.81 ∙ 𝜂tur∙ 𝜂gen∙ 𝑄tur(𝑡) ∙ 𝐻net(𝑡). (5) Besides, by taking into account water losses and pump and motor efficiencies, the power in kW taken from the grid as a consumer of pump-motor mode for Rev HPP can be obtained as:
𝑃mot(𝑡) =9.81∙𝑄pum(𝑡)∙𝐻net(𝑡)
𝜂pum∙ηmot . (6)
The time periods for each day are divided in hourly time intervals, and for financial analysis it is taken 4 tariffs (Figure 12), night, medium, peak and rush tariff.
Fig. 12. Daily tariffs of electricity price
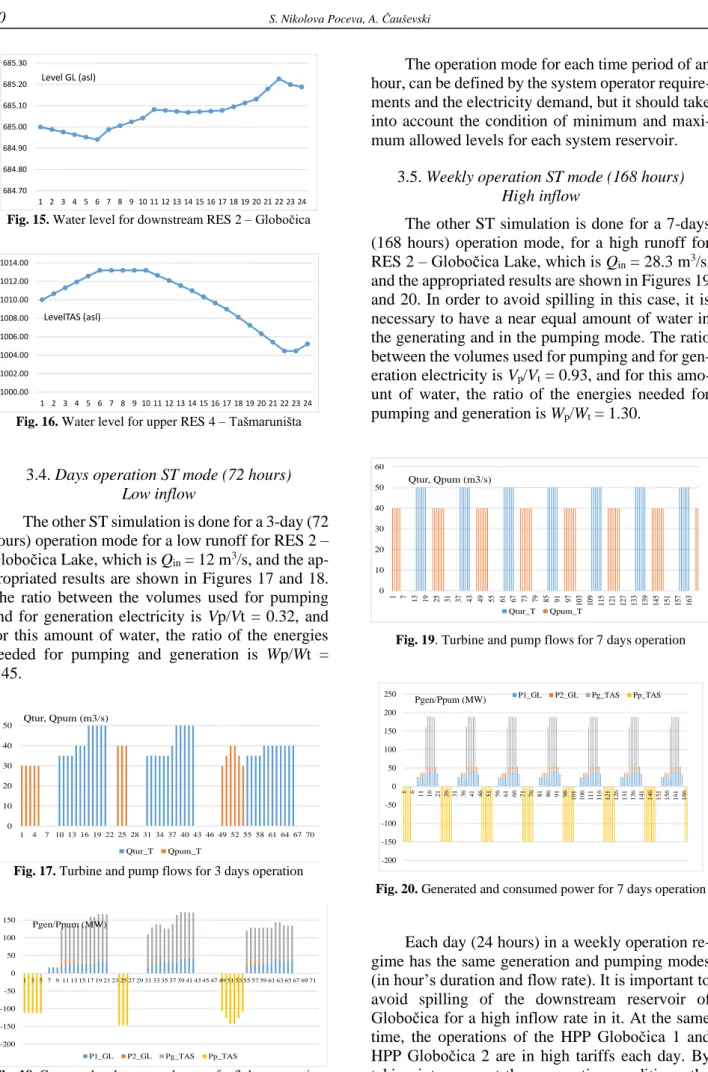
3.3. Daily operation ST mode (24 hours)
Figure 13 presents the turbine and pump flows in a day (24 hours) for the reversible HPP of Tašma-runišta in a case of large inflow in RES 2 – Globoči-ca Lake of Qin = 32 m3/s. The generated powers as
shown in Figure 14 from the three HPPs (P1 – Glo-bočica 1, P2 – GloGlo-bočica 2, and Pg_TAS – Tašma-runišta), are determined according to (7). The power of the pumping mode is Pp_TAS and it is obtained according to (8).
𝑃gen(𝑡) = 𝑃P1GL(𝑡) + 𝑃P2GL(𝑡) + 𝑃gTAS(𝑡) (7)
𝑃pum(𝑡) = 𝑃pTAS(𝑡) (8)
Fig. 13. Turbine and pump flows for the rev. HPP of Tašmaruništa
Fig. 14. Generated and consumed power for the HPS on Figure 11
The graphs of the reservoir level for the downstream RES 2 – Globočica, and the upper RES 4 – Tašmaruništa are shown in Figures 15 and 16, respectively.
The ratio between the volumes used for pump-ing and for generation electricity is Vp/Vt = 0.55 and for this amount of water, the ratio of the energies needed for pumping and generation is
Wp/Wt = 0.76.
RES 2 - Globocica Lake V=13,2 Mm3 HPP Globocica 2x21 MW New HPP Globocica 2 1x20 m3/s, 12MW 580 a.s.l. 682 – 687,5 a.s.l Qin,add River Crn Drim Qtur=Qin,SP
New REV_HPP Tasmaruniste Pgen/Pmot = 2x75 MW RES 4 - Tasmaruniste V=6 Mm3 992 – 1022 a.s.l Qpum=40 m3/s Ppum=140-150 MW Qtur=50 m3/s Pgen=130-140 MW 656 a.s.l 0 10 20 30 40 50 60 1 2 3 4 5 6 7 8 9 10 11 12 13 14 15 16 17 18 19 20 21 22 23 24 Electricity price (€/MWh) 0 10 20 30 40 50 60 1 2 3 4 5 6 7 8 9 10 11 12 13 14 15 16 17 18 19 20 21 22 23 24 Qtur, Qpum (m3/s) Qtur_T Qpum_T -200.00 -150.00 -100.00 -50.00 0.00 50.00 100.00 150.00 200.00 250.00 1 2 3 4 5 6 7 8 9 10 11 12 13 14 15 16 17 18 19 20 21 22 23 24 Pgen/Ppum (MW) P1_GL P2_GL Pg_TAS Pp_TAS
Fig. 15. Water level for downstream RES 2 – Globočica
Fig. 16. Water level for upper RES 4 – Tašmaruništa
3.4. Days operation ST mode (72 hours) Low inflow
The other ST simulation is done for a 3-day (72 hours) operation mode for a low runoff for RES 2 – Globočica Lake, which is Qin = 12 m3/s, and the
ap-propriated results are shown in Figures 17 and 18. The ratio between the volumes used for pumping and for generation electricity is Vp/Vt = 0.32, and for this amount of water, the ratio of the energies needed for pumping and generation is Wp/Wt = 0.45.
Fig. 17. Turbine and pump flows for 3 days operation
Fig. 18. Generated and consumed power for 3 days operation
The operation mode for each time period of an hour, can be defined by the system operator require-ments and the electricity demand, but it should take into account the condition of minimum and maxi-mum allowed levels for each system reservoir.
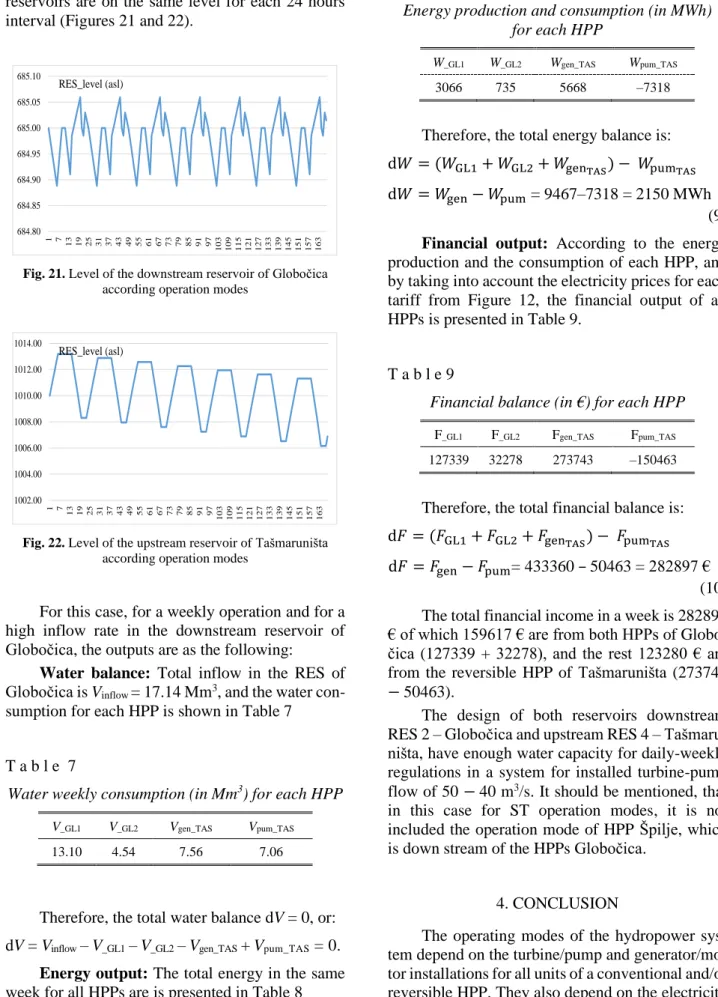
3.5. Weekly operation ST mode (168 hours) High inflow
The other ST simulation is done for a 7-days (168 hours) operation mode, for a high runoff for RES 2 – Globočica Lake, which is Qin = 28.3 m3/s,
and the appropriated results are shown in Figures 19 and 20. In order to avoid spilling in this case, it is necessary to have a near equal amount of water in the generating and in the pumping mode. The ratio between the volumes used for pumping and for gen-eration electricity is Vp/Vt = 0.93, and for this
amo-unt of water, the ratio of the energies needed for pumping and generation is Wp/Wt = 1.30.
Fig. 19. Turbine and pump flows for 7 days operation
Fig. 20. Generated and consumed power for 7 days operation
Each day (24 hours) in a weekly operation re-gime has the same generation and pumping modes (in hour’s duration and flow rate). It is important to avoid spilling of the downstream reservoir of Globočica for a high inflow rate in it. At the same time, the operations of the HPP Globočica 1 and HPP Globočica 2 are in high tariffs each day. By taking into account these operating conditions, the
684.70 684.80 684.90 685.00 685.10 685.20 685.30 1 2 3 4 5 6 7 8 9 10 11 12 13 14 15 16 17 18 19 20 21 22 23 24 Level GL (asl) 1000.00 1002.00 1004.00 1006.00 1008.00 1010.00 1012.00 1014.00 1 2 3 4 5 6 7 8 9 10 11 12 13 14 15 16 17 18 19 20 21 22 23 24 LevelTAS (asl) 0 10 20 30 40 50 60 1 4 7 10 13 16 19 22 25 28 31 34 37 40 43 46 49 52 55 58 61 64 67 70 Qtur, Qpum (m3/s) Qtur_T Qpum_T -200 -150 -100 -50 0 50 100 150 200 1 3 5 7 9 11 13 15 17 19 21 23 25 27 29 31 33 35 37 39 41 43 45 47 49 51 53 55 57 59 61 63 65 67 69 71 Pgen/Ppum (MW) P1_GL P2_GL Pg_TAS Pp_TAS 0 10 20 30 40 50 60 1 7 13 19 25 31 37 43 49 55 61 67 73 79 85 91 97 10 3 10 9 11 5 12 1 12 7 13 3 13 9 14 5 15 1 15 7 16 3 Qtur, Qpum (m3/s) Qtur_T Qpum_T -200 -150 -100 -50 0 50 100 150 200 250 1 6 11 16 21 26 31 36 41 46 51 56 61 66 71 76 81 86 91 96 101 106 111 116 112 126 131 136 141 641 151 156 161 166
reservoir level of the downstream and the upstream reservoirs are on the same level for each 24 hours interval (Figures 21 and 22).
Fig. 21. Level of the downstream reservoir of Globočica according operation modes
Fig. 22. Level of the upstream reservoir of Tašmaruništa according operation modes
For this case, for a weekly operation and for a high inflow rate in the downstream reservoir of Globočica, the outputs are as the following:
Water balance: Total inflow in the RES of
Globočica is Vinflow = 17.14 Mm3, and the water
con-sumption for each HPP is shown in Table 7
T a b l e 7
Water weekly consumption (in Mm3) for each HPP
V_GL1 V_GL2 Vgen_TAS Vpum_TAS
13.10 4.54 7.56 7.06
Therefore, the total water balance dV = 0, or:
dV = Vinflow – V_GL1 – V_GL2 – Vgen_TAS + Vpum_TAS = 0.
Energy output: The total energy in the same
week for all HPPs are is presented in Table 8
T a b l e 8
Energy production and consumption (in MWh) for each HPP
W_GL1 W_GL2 Wgen_TAS Wpum_TAS
3066 735 5668 –7318
Therefore, the total energy balance is:
d𝑊 = (𝑊GL1+ 𝑊GL2+ 𝑊genTAS) − 𝑊pumTAS
d𝑊 = 𝑊gen− 𝑊pum = 9467–7318 = 2150 MWh (9)
Financial output: According to the energy
production and the consumption of each HPP, and by taking into account the electricity prices for each tariff from Figure 12, the financial output of all HPPs is presented in Table 9.
T a b l e 9
Financial balance (in €) for each HPP
F_GL1 F_GL2 Fgen_TAS Fpum_TAS
127339 32278 273743 –150463
Therefore, the total financial balance is:
d𝐹 = (𝐹GL1+ 𝐹GL2+ 𝐹genTAS) − 𝐹pumTAS d𝐹 = 𝐹gen− 𝐹pum= 433360 – 50463 = 282897 €
(10) The total financial income in a week is 282897 € of which 159617 € are from both HPPs of Globo-čica (127339 + 32278), and the rest 123280 € are from the reversible HPP of Tašmaruništa (273743
− 50463).
The design of both reservoirs downstream RES 2 – Globočica and upstream RES 4 – Tašmaru-ništa, have enough water capacity for daily-weekly regulations in a system for installed turbine-pump flow of 50 − 40 m3/s. It should be mentioned, that
in this case for ST operation modes, it is not included the operation mode of HPP Špilje, which is down stream of the HPPs Globočica.
4. CONCLUSION
The operating modes of the hydropower sys-tem depend on the turbine/pump and generator/mo-tor installations for all units of a conventional and/or reversible HPP. They also depend on the electricity
684.80 684.85 684.90 684.95 685.00 685.05 685.10 1 7 13 19 25 31 37 43 49 55 61 67 73 79 85 91 97 103 109 115 121 127 133 139 145 151 157 163 RES_level (asl) 1002.00 1004.00 1006.00 1008.00 1010.00 1012.00 1014.00 1 7 13 19 25 31 37 43 49 55 61 67 73 79 85 91 97 103 109 115 121 127 133 139 145 151 157 163 RES_level (asl)
needs and system operator requirements. Anyway, more units in the HPS means more flexible opera-tion of the whole system.
For LT operation modes, large reservoirs with conventional units can be considered, however, they depend on the available data needed in terms of hy-drology (day, week or month).
For ST operation modes, the hourly operation for each power unit can be considered, by taking into consideration a reversible HPP. In this case, the flexibility of the system can be improved and max-imum financial profit from electricity generation can be obtained. One should note that the ratio be-tween peak tariff and low off tariff is large then the ratio between generated and pumped power for same amount of water (Cpeak/Coff > Pgen/Ppum).
The benefits of complex hydropower system operation should be valorized in generated electric-ity, and in financial benefit. Some of the additional analyses that can be done, are:
• Higher electricity production as a result of utili-zation of the overflow spilling water.
• Engagement of units in the periods of high tar-iffs per day, rather than production as a base plant.
• Opportunity for optimization of the whole hy-dropower system with all units in the HPS.
• Optimization of the HPS and avoiding over-flows, in order to obtain positive financial ef-fects from the operation the entire hydrosystem.
• Possibility for regulating the water flows of run-offs, and regulating the reservoirs.
The main driven conditions for the operation modes of the HPS depend on the complexity of the hydropower system from the technical point of view (number of power units and reservoirs with their connectivity), and the available hydrological data, as well as the operation and/or utility requirements.
REFERENCES
[1] GEING and FICHTNER, Crn Drim River Basin, Study on Optimum Utilization of Hydropower Potential, Final Report, April 2016.
[2] JSC ELEM, Reports on Data for HPS of Crn Drim, HPP Globočica and HPP Špilje, Skopje.
[3] Čakar and Partners, Study for pump storage hydropower plant Tašmaruništa, made for ELEM, Skopje 2010. [4] VALORAGUA-A, Model for the Optimal Operating
Strategy of Mixed Hydrothermal Generating Systems, 1992, IAEA, Vienna, Austria.
[5] Dozier, André: Integrated Water and Power Modeling Framework for Renewable Energy Integration, Colo-rado State University, ColoColo-rado, USA, 2012.