Mapping the Digital Economy
Digital Shoreditch Festival
May 2011 Cities Institute, Ladbroke House, 62-66 Highbury Grove, London N5 2AD 0207 133 5105 citiesinstitute.org
Cities Institute
London Metropolitan Business School Tech City and the University
Digital Shoreditch Festival May 3rd 2011
Why Clusters?
Over the last 20 years the formation and growth of business clusters has been widely recognised. Building on Michael Porter’s
initial worki and that of economists and
geographersii, recent research suggests that
the agglomeration and co-location of
businesses can fuel co-operation, competition and, in particular circumstances, significant
innovation.iii It is widely argued that by
clustering, firms gain shared advantages. Research results have also suggested that locating in a cluster and collaborating with other firms, either directly or through supporting institutions such as Universities or other business agencies, has helped maximise potential for innovation throughout the cluster - not only meeting clients’ and customers’ current needs but also shaping
future markets.iv The overall argument is
therefore that as clusters become established they draw in firms and labour working in similar and related sectors, increasing
agglomeration through co-location and
therefore maximising the benefits of a particular locality. Successful clusters create:
• communities of creative people who
share an interest in novelty and new things (wherever they occur)
• a catalysing place – where ideas and
connections are sparked
• diversity of experience and freedom
of expression
• dense but open networks of personal
relationships that permit identities
and uniqueness to flourishv
A point is sometimes reached when a firm will be disadvantaged if it does not locate within the locality of a cluster. There is disagreement over the impact of large cities on clustering. It
agglomeration economies with complex markets can have the same effect as clustering – drawing in firms and labour. Some sectors do concentrate (and cluster) within core cities. However this tends to be when firms rely heavily on urban centrality,
connectivity and diverse cosmopolitan
cultures (for example in Finance and in the
Creative Industries). vi Every cluster has its
own internal dynamics. These are explored here for the ‘creative digital cluster’ in inner east London.
In the Digital Economyvii the convergence of
technologies and platforms, content and creativity, has opened up seemingly limitless potential for entrepreneurship. This is one of the few sectors predicted to grow in the next
5 years.viii In a fast moving business culture
where bust and boom, micro enterprises and global firms sit side by side, it is suggested here, that spatial clustering within a metropolitan centre takes on a particularly significant role. This role is increasingly evident in inner east London on the fringes of The City where the rapid emergence of ‘creative digital’ and ‘technology’ firms has been noted by industry insiders, the
technology and wider press and by
government.ix Here, (re)location on the fringe
of established business and creative clusters has facilitated new forms of convergence between sectors of the economy (notably Publishing, Printing and Advertising with Software and Data Services) encouraging early adoption of digital formats. Early adopters engage with software developers and the cycle continues.
Where is Digital Shoreditch?
The question of geography was brought into sharp relief when the Technology Strategy Board announced its £1m package of financial
support for ‘Shoreditch’ last month.x For some,
Shoreditch is ‘a state of mind’ but for others who are interested in whether or not they can apply for this matched funding, the question is much more practical. It really is a question of geography.
3
Fig.1 ‘Silicon Roundabout’ 2007 (Data Source: Dopplr)
Fig.2. ‘You’re in Silicon Roundabout’ 2009 (Data Source: Wired January 2010)
4
Cities Institute has reproduced three of the
defining geographies of inner east
London’s new cluster (Fig. 1-3) – each map
has had an iconic role in creating the idea
of a digital cluster. Put together they suggest rapid growth. However, each one probably underestimates the number of active firms present at the time. They are, after all, based on a combination of local knowledge and social networking – both forms of data collection are destined to exclude, albeit unwittingly. Yet what these maps do suggest is that there is a growing sense of belonging to an identifiable cluster. This ‘belonging’ is one of the important pre-requisites for successful business cluster development.
Mapping London’s Digital Economy
Better understanding of the dynamics of this sub-cluster’s growth can be gained
from examining its position within
London’s wider regional Digital Economy. In Britain, the Digital Economy is
over-represented in London. xi The east London
sub-cluster is therefore likely to have more than regional significance.
The strength of London’s Digital Economy is not only its national concentration but
also its hybridity. It combines an
established ICT sector (including
Telecommunications and Wholesaling of
Computers) with concentrations of
‘Content’ industries (including a number of core creative industries – TV and Radio, Film and Video Production, Publishing,
Design and Advertising).xii London’s Digital
Economy is therefore largely shaped by the diversity of its Content industries. This generates rich opportunities for cross-fertilisation of ideas and innovation and, most importantly, assembles a critical mass of potential clients, customers and collaborators across the region.
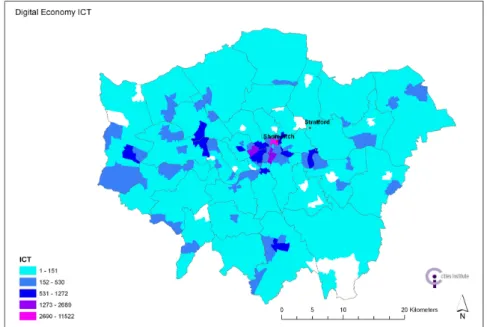
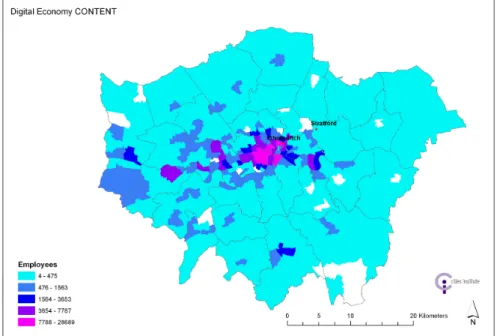
Within London, ICT employment is
centrally concentrated while Content employment is primarily located in a west-central corridor (Fig.4 and Fig.5). However there are pockets of extremely high ICT and Content employment in inner east and south central London.
5
Fig.5 Employment distribution Digital Economy - Content (Data Source BRES2009/SIC2007)
Cluster analysis (using Location Quotients) identifies ward level over representation of the Digital Economy in a continuous central corridor from Osterley in west London to Haggerston in east London, with outlying scattered pockets of significance. For example in St Katherine’s and Wapping, the Isle of Dogs and Bow in east London and between London Bridge and Waterloo stations south of
the Thames (Fig. 6). Over representation indicates that the level of Digital Economy employment is in a higher ratio to all employment locally than it is regionally. This indicates specialisation. Cluster analysis also confirms that four inner London wards in Islington and Hackney (Bunhill, Hoxton, St Peter’s and Haggerston) mark the eastern edge of the London cluster corridor.
6
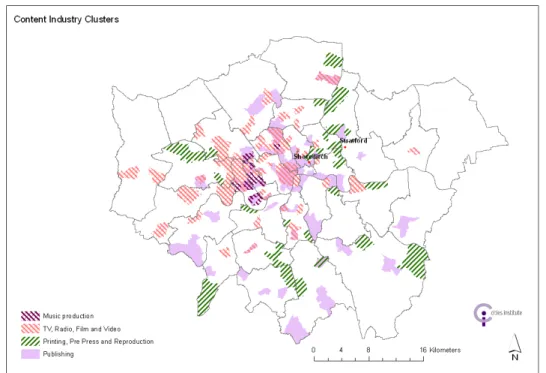
This eastern edge has its own specialisations and forms one of a number of London sub-clusters, each with their own established geographies and industry cultures – for example Music Production in west London; TV, Radio, Film and Video in west and central London; and Publishing in north and central London and the Isle of Dogs (Fig. 7).
Inner east sub-cluster
The inner east sub-cluster is shaped by the
concentration of particular ICT firms
(including wireless and wired
Telecommunications firms) and their co-location with a number of inter-related Content firms (especially in Advertising, Publishing and Printing) and with firms engaged in Software and related data activities (Fig.8). There is also a strong presence of Specialist Design. One estimate suggests that approximately 1550 designers
are at work in an east London swathe from
Clerkenwell to Bow.xiii
This agglomeration of particular Content industries is further reinforced by their over representation compared to the regional norm. This is the case for Printing, Publishing, Design, Software, Advertising and PR & Communications. Although there are firms in the TV, Film and Video Production and Music Production in the area they do not exhibit sub-clustering within the regional economy (Table 1).
The east London sub-cluster is therefore characterised by both specialisation (in creative representation and reproduction) and diversity (with software and data services and design). The inner east London
sub-cluster is both part of and distinct within the
London regional Digital Economy.
7 0 50 100 150 200 250 300 350 W h o le sa le T e le co m m u n ic a ti o n s C o m p u te r M a n u fa ct u re /R e p a ir O th e r C o m p u te r S e rv ic e s N e w s A g e n ci e s D a ta b a se A ct iv it ie s T V a n d R a d io F il m & V id e o P ro d u ct io n P h o to g ra p h ic S e rv ic e s P re p re ss a n d P ri n ti n g A d v e rt is in g P u b li sh in g S o ft w a re N u m b e r o f F ir m s
ICTand CONTENTsectors
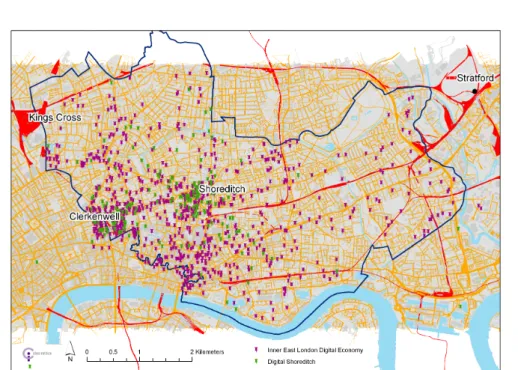
Fig. 8 Inner East London Digital Economy sub–clusters (Data Source: Experian 2011 /E1, E2, E3, EC1, EC2, EC3, N1 /SIC 2003)
Sector Location
Quotient Digital Economy in Inner East
London
1.46
ALL CONTENT INDUSTRIES 1.26
Printing, Pre-Press and Reproduction
1.90
Publishing 1.37
Specialist Design 1.36
Software and Data Services 1.12
Advertising & Market Research 1.24
PR and Communications 1.11
Music Production 0.42
TV, Radio, Film and Video Production
0.38
Data Source: BRES 2009/SIC2007 (A score > 1 indicates over representation compared to the regional ratio of industry to total employment).
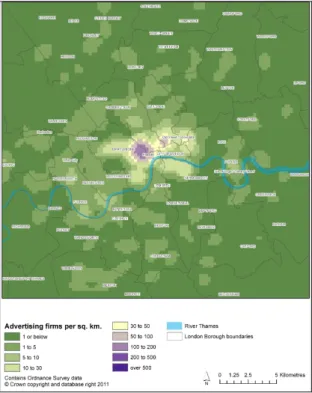
Table 1: Sector concentration in inner east London Fig. 9 Advertising Agglomeration
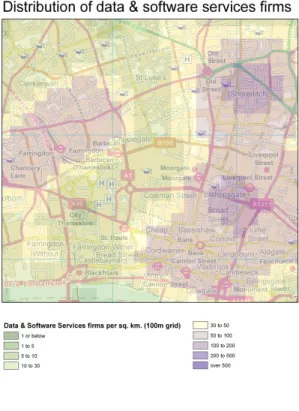
A satellite agglomeration of Advertising firms can be identified in inner east London – distinct from its main concentration in west- central London (Fig. 9). This overlaps with a larger cluster of Data and Software Services firms in inner east London (Fig. 10).This may
go some way to explain the specific emergence of ‘creative digital’ firms in east central London – those combining digital design, animation, video with web design and software development. The co-presence of Data and Software Services including many
8
freelance and small web ‘design and build’ firms (some located in the Clerkenwell and Shoreditch as a legacy from the dot.com
boom of the late 1990sxiv) with Print,
Publishing and Advertising facilitates cross-fertilization through sub-contracting. For example specific demand for software development has emerged from Publishing companies specialising in e-publishing of in- house and specialist magazines for corporate and government clients. Other firms focus on developing educational and training materials suitable for delivery over multiple platforms. Both require development of bespoke software developments and applications. There are high levels of demand for software services from within the Advertising, Market
Research and PR & Communications
industries. Changes in these industries given rise to new forms of advertising, marketing and branding and have created opportunities for application development across platforms. However, as is argued below, the internal blending of digital and creative development
within firms makes it increasing difficult to distinguish software development firms from other Content companies.
This local combination of high levels of
demand, availability of experimental
developers and early adopters differentiates the inner east London cluster from existing established centres of Advertising (in West London) or Publishing (Bloomsbury, Holborn, Wapping) or Film, Media and Music (in Soho). To be located in inner east London is to have a particular reputation as ‘cutting edge’ and
forward looking. xv
Convergence of Advertising, Marketing and
Communications with Design and the
development of digital formats including games and product or service related ‘apps’ is a primary driving force of the current cluster development – and the speed of its growth.
Local software developers working in
different fields - entertainment, education,
Fig. 10 Concentration of Data and Software Services
transport, health, government and the other creative industries - all benefit from this demand and the core of technical and creative expertise it employs. And vice versa - those working for or within these Advertising, Marketing and Communications industries benefit from games developers, digital designers and software start ups. Particular spillovers - skills, knowledge and new markets
- are emerging from this particular
convergence between Content industries. There are other localities in London where there are mixes of co-located ICT and Content industries - most notably south of the Thames between London Bridge and the South Bank Centre. However these do not have the same concentrations of Advertising, Marketing, Communications and Design – the driving forces behind current levels of business-led agglomeration and innovation in inner east London. South central London does have high
concentrations of Market Research,
Publishing and Telecommunications. All have significant potential for developing demand for software applications and innovations – however these are likely to be of a different form and (possibly) pace.
9
Table 2: Inner East London Firms, Employment and Turnover (Data Source Experian 2011/SIC 2003)
The inner east London’s sub-cluster is made up of micro and SME firms - 53% have less than 10 employees. This is the same for both ICT and Content industries. Less than 5% of enterprises employ more than 100 people (Table 2).
Looking at the value generated in this locality, ICT has higher levels of overall turnover
(dominated by Wholesale and
Telecommunications) than Content industries.
These however employ more people.
Publishing dominates Content turnover which is in excess of £18m. However, combined, Advertising and Software have a £16m annual turnover (Table 2).
The pace of change and innovation emerging from this sub-cluster is evidently from a mix
of firms with relatively small turnovers.
Internal cluster geographies
Analysis and mapping of firm level data
supplied by Experianxvi for the east London
sub-cluster shows three distinct places for Data and Software Services – Clerkenwell, Shoreditch and The City (Fig.11). Each locality has a mix of firms across the ICT and Content industries. However there are some local specialisms. For example in the City, there are more firms focused on data management, systems development, web hosting and design of software applications specifically for
the Finance and Business Administration sectors. Clerkenwell also has a significant number of well established web design and internet development services.
The pattern for Advertising is different. There are only two peaks (Fig 12) – one in Clerkenwell where some of the larger more established off centre agencies are located - and one in Shoreditch were there are a significant number of smaller firms defining themselves as ‘creative digital agencies’ (see below).
Defining the boundary of the inner east London digital sub-cluster is an impossible task. It is fluid and constantly changing. However based on this analysis it seems that there is currently a bipolar pattern encircling both Clerkenwell and Shoreditch with agglomeration stretching north into Islington, north east into Hackney and in particular south east into the City and Whitechapel (Fig
13). There is currently an intense
concentration of Print activities in Bow, west of Stratford which may, in time, be included within the cluster. However, following the analysis presented here, a move east would be highly dependent on the location of particular Content industries with a high
demand for software adaptation and
10
Fig. 11 Data and Software Services firms - local agglomeration (Data Source: Experian 2011 SIC2003)
Fig.12 Advertising firms - local agglomeration (Data Source: Experian 2011 SIC2003)
‘Creative Digital’ Firm
The ‘Creative Digital’ firm is a blend. It fuses technology and design in the context of Advertising, Communications and Marketing services. Typically it offers a number of products and services simultaneously to clients - a hybrid of creative strategy development, campaign implementation and technological development.
Fig. 14 Creative digital services
From a sample of 261 firms identified for
Digital Shoreditchxvii, 46% define themselves
as Digital Design Consultancies (or Agencies) offering a ‘creative digital’ service (Table 3). Individual firms in the sample tend to prioritise one particular activity - Marketing, Communications, PR or Branding activities and some focus on particular types of clients - charities, public sector, music, technology companies, fashion houses or financial services - but all offer a combination of creative digital services and products (Fig. 14). Firms identifying themselves as Advertising Agencies operate in a similar way and if these are included, then 60% of the firms in the
sample are blended ‘creative digital’
companies. The amalgamation of services within individual firm portfolios is both responding to the demand for and increasing the convergence of creative campaigns and digital formats and platforms.
Creative Digital Services Digital Branding E-Marketing
Search and Content Management Flash Applications and Games Info graphics
Animation and Video Web-design and Build
Internet development and hosting On line advertising
Mobile Apps
11
Fig. 13 Bipolar cluster core (Data Sources: Experian 2011 SIC 2003/ PlayGen)
Main activity
No. of Firms
Advertising 36
Digital Design Consultancy* 120
IT Consultancy 19
Graphic Design 15
Photography, Film, Video, Post Production 13
Design and Print 9
Software development 5
Animation 4
Recruitment 4
Data and Database Management 3
Digtial Publishing and e-Learning 3
Events and Promotions 3
Games 2
Training 2
Social networking 1
Other 22
Total 261
*Marking, Communications, PR, Branding
Table 3: Companies in Digital Shoreditch sample
Whereas 19 firms offer IT Consultancy
services only 5 firms identified as
independent Software Development houses. Traditional local specialities in Graphic Design and Photography, Film and Video production are evident in the sample.
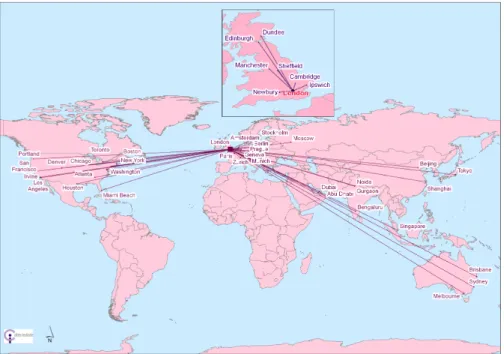
Further evidence from this sample suggests that many of these ‘creative digital’ firms operate in more than one UK centre. Many also manage portfolios of clients on an international stage. Global and international brands are frequently listed in client lists.
Some are also a new breed of ‘micro global’ firm. These firms have offices in more than one city/country (Fig. 15) and clients spanning national boundaries. They use expertise from around the world and some sub-contract specialist skills in cheaper locations, such as Eastern Europe, where coding quality is high but costs of hiring skilled professional staff are lower. This micro global firm structure may produce value but not necessarily local jobs. London has long been recognised as a hub for brokering creative projects for international clients and for putting together financial
packages to support campaigns. xviii However
this role in the international division of labour is changing - clients’ increasingly expect digital innovation as well as strong creative input. The place of London in the overall Advertising division of labour may be increasingly dependent on the success of the inner east London cluster to maintain its reputation for innovation.
Location, location, location...
East London currently provides a fertile ground in which freelancers, micro and SME creative digital firms as well as established off centre agencies flourish. Many benefit from
12
(relatively) cheap premises with employees
celebrating the independent cafes,
restaurants and bars. This ‘no brand’ street culture is highly valued. Digital creative and
technology companies are taking tenancies in
existing managed workspace buildings,
alongside other creative industries.
Fig. 15 Micro-global connections (sample of 10 ‘creative digital’ firms)
Some cluster spillovers are orchestrated by social networking intermediaries offering support services, advice from industry gurus, hacking sessions and contact opportunities
with early adopters (Minibar, Tech Hub). A
few have combined social networking with the provision of tech friendly workspace, developing niches in the property sector
(from relatively cheap and cheerful – Tech
Hub to more comfortable and luxurious – The
Trampery). These join long established workspace providers active within this locality (such as Clerkenwell Green Association, Clerkenwell Workshop, Workspace) and commercial workspace developers (such as Derwent London).
Role of Universities
Some researchers have suggested that Universities play a relatively minor role in the development of clusters which generally
benefit from urban agglomeration
economies. xix However new roles are
emerging from the co-location of University facilities in the inner east London sub cluster (Fig.16).
Here, where the particular location of the sub-cluster is not the result of University spin outs, Universities nevertheless have become
important cluster collaborators. As
traditionally neutral partners in highly
competitive commercial markets, their active engagement reinforces the collaborative ethos of clusters. By being in (and of) the cluster, some Universities have become gateways to (and from) grant funded experimental and applied research projects and labs (for example QMU’s – qMedia) - providing subcontracts for enterprises or collaborative work opportunities with firms. Collaboration with a University often adds a level of credibility and trust valued by particular clients. Some specialised co-located University facilities offer spaces and facilities to develop product or service ideas at
reduced cost and risk (LondonMet’s
13
potential student and graduate entrepreneurs. The inclusive nature of workspace provision within a University environment – offering support, technical backup, events and access to meeting spaces and conference rooms –
with no hidden costs is also refreshingly simple as other property providers begin to add on service charges for ‘extras’. A new role
for Universities is to be both ‘connected’xx and
responsive to changing cluster needs.
Fig 16. Digital Economy firms data with University and College sites..
i Porter, M. (1998) Clusters and the new economics of
competition, Harvard Business Review
November-December; http://www.isc.hbs.edu/index.html
ii Krugman, P. (1998) What’s new about economic Oxford
Review of Economic Policy, Vol 14. 2: 7-17; Fujita, M., P.
Krugman and A.J. Venables. (1999) The Spatial Economy.
Cities Regions and International Trade. Cambridge, MA: The MIT Press; Storper, M and Christopherson, S. (1987) Flexible specialisation and regional industrial
agglomerations Annals of the American Association of
Geographers Vol 77: 104-117; Ashiem, B, Cooke, P. and
Martin, R (eds) (2004) Clusters and Regional Development,
London, Routledge; Storper, M. and Venables, A. (2004)
Buzz: face to face contact and the urban economy Journal
of Economic Geography Vol. 4 351-370; De Propris, L., Chapain, C.,Cooke, P. McNeill, S. Mateos-Garcia, J. (2009) The geography of Creativity, London, NESTA
iii Simmie, J. and Sennett, J. (1999) Innovation clusters:
global or local linkages National Institute Economic Review, Vol 170: 87-107; Cooke, P. and Morgan, K. (1998) The Associational Economy: Firms, regions and Innovation, Oxford, Oxford University Press ; Simmie, J. Carpenter, J,
Chadwick , A. and Martin , R. (2008) History Matters Path
Dependence and Innovation in British City Regions, London NESTA; Chapain, C., Cooke, P., De Propris, L. McNeill, S. and
Mateos-Garcis, J. ( 2010) Creative Clusters and Innovation:
Putting Creativity on the Map, London NESTA
iv
Picard, R.G. (2008) Media Clusters: Local Agglomeration in an Industry Developing Networked Virtual Clusters Jonkoping International Business School, Working Paper 2008-3
v
De Propris,L. and Chapain, C. (2009)Drivers and Processes
of Creative Industries in Cities and Regions, Creative Industries Journal 20 Vol 2.1, 9-18
vi
Beaudry, C. and Shiffauerova, A. (2009) Who is right, Marshall or Jacobs? The localization versus urbanisation debate Research policy Vol 38, 318-337; Musterd, J and Murie, A (2010) Making Cities Competititve, Oxford Wiley-Blackwell
vii
BIS/DCMS/IPO 2010 Impact Assessment for the Digital Economy Bill – List of UK Digital Economy sectors and industries at SIC level p12
viii
BOP Consulting (2010) Tech City: Creating a new digital and media cluster in London’s East End, BOP London.
ix McKinsey & Co (2011) East London: world class centre for
digital enterprise, London, McKinsey & Company
x TSB £1m for Shoreditch announced at the Accelerator
April 2011 – Digital Shoreditch Meet Up
xi
This is evident from its regional Location Quotient (LQ1.76) – a calculated ratio between the regional and national to determine whether or not the local economy has a greater share of the Digital Economy employment. A figure above 1 indicates over-representation and therefore spatial concentration within the national economy.
14
xii
ICT and Content industries – Definitions used by BIS Impact Assessment of Digital Britain
ICT sector
SIC2003Code Description
30.01 Manufacture of office machinery and computers
30.02 manufacture of computers and other information processing equipment 31.30 Insulated wire and cable
32.10 Electronic valves and tubes and other electronic components
32.20 Television, radio transmitters and apparatus for telephony and telegraphy
32.30 Television and radio receivers, sound or video recording or producing apparatus and associated goods
33.20 Instruments and appliances for measuring, checking, testing and navigating and other purposes
51.43 Wholesale of electrical household appliances and radio and television goods
51.84 Wholesale of computers, computer peripheral equipment and software
51.85 wholesale of other office machinery and equipment
51.86 Wholesale of other electronic parts and equipment
51.87 Wholesale of other machinery for use in industry, trade and navigation 64.20 Telecommunications
71.33 Renting of office machinery and equipment including computers
72.10 Computer Hardware consultancy
72.50 Maintenance and repair of office, accounting and computing machinery
72.60 Other computer related activities
Digital content industries SIC2003Code Description 22.11 Publishing of books 22.12 Publishing of newspapers
22.13 Publishing of journals and periodicals
22.14 Publishing of sound recordings
22.15 Other publishing
22.21 Printing of newspapers
22.22 Printing not elsewhere classified
22.24 Pre-press activities
22.25 Ancillary activities relating to printing
22.31 Reproduction of sound recording
22.32 Reproduction of video recording
22.33 Reproduction of computer media
72.21 Publishing of software
72.22 Other software consultancy and supply
72.30 Data processing
72.40 Database activities
74.40 Advertising
74.81 Photographic activities
92.11 Motion picture and video production
92.12 Motion picture and video distribution
92.13 Motion picture projection
92.20 Radio & TV
92.40 News agency activities
xiii
BRES 2009/ SIC Code 74100 for wards covered by postcodes E1,E2, E3,EC1,EC2,EC3,N1
xiv
Hutton, T. (2004) The new economy of the inner city
Cities Vol 21.2, 89-108 Pratt, A.C, (2009) Urban
regeneration: From the arts feel good 'factor to the cultural
economy: A case study of Hoxton, London Urban Studies,
2009 -
xv Group Discussion with start up and SME firms April 2011,
Accelerator
xvi
Acquired from Experian in March 2011, data 2010
xvii
Data collected by Playgen and analysed by Dr Jo Foord, Cities Institute, LondonMet
xviii
Pratt, AC 2006. Advertising and creativity, a governance approach: A case study of creative agencies in London.
Environment and Planning A 38.10, 1883–1899
xix Cooke, P (2006) New media and new economy cluster
dynamics, in Lievrouw, L. and Livingstone, S. (eds) (2006)
The Handbook of New Media, London Sage
xx Kitson, M., Howells, J. Braham, R. and Westlake, S. (2009)