Information Theory based Feature Selection for
Customer Classification
N´estor Ruben Barraza ?1, Sergio Moro2, Marcelo Ferreyra3, and Adolfo de la Pe˜na4
1 Universidad Nacional de Tres de Febrero, Caseros, Argentina
2 Instituto Universit´ario de Lisboa (ISCTE-IUL), ISTAR-IUL, Lisboa, Portugal 3 Dataxplore, Trenque Lauquen, Argentina
4 Boldt Gaming, Buenos Aires, Argentina.
Abstract. The application of Information Theory techniques in cus-tomer feature selection is analyzed. This method, usually called infor-mation gain has been demonstrated to be simple and fast for feature selection. The important concept of mutual information, originally intro-duced to analyze and model a noisy channel is used in order to measure relations between characteristics of given customers. An application to a bank customers data set of telemarketing calls for selling bank long-term deposits is shown. We show that with our method, 80% of the subscribers can be reached by contacting just the better half of the classified clients.
Keywords: Customer segmentation, feature selection, mutual informa-tion
1
Introduction
Customer segmentation in marketing campaigns is an important and classical problem in Business Intelligence. Since the marketing campaign is cost exten-sive, an optimal selection of the customers to whom direct the campaign results in saving a lot of money. Since the larger the number of customer attributes, the slower and complex the algorithm, there is a search for optimal performance with good results. Many algorithms based on several mathematical methods have been developed, being support vector machines (SVM) and neural networks the most popular, see for example a review in [6] and [11]. Since customers are described by a lot of attributes, the first stage in order to classify them is to select not all the attributes but the most relevants in order to avoid redundant or irrelevant information, this stage is also called feature selection, a common data mining (DM) problem. Selecting just the most relevant variables helps to simplify the prediction algorithm, and makes the segmentation result easy to be understood by decision makers and managers. Despite that the knowledge of the problem domain is usually used to manually discard some irrelevant features, getting a
good mathematical method to automatically perform this task is quite impor-tant, see for example [4] for a review. In this work, a variable selection method based on entropy and mutual information is presented. Since they are estimated from probabilities just making sums and multiplications , the estimation of these functions is performed in a simple way. Then, the estimation process is easy and fast, allowing to deal even with a big number of data, albeit requiring efficient sampling methods. Applications of Information Theory in feature selection has been largely analyzed, see for example [2], [7] and [10], though practical appli-cations involve mainly pattern and text classification, with few contributions to CRM. In this work, we show that the application of Information Theory in fea-ture selection can be also applied with good results to customer classification. Once an optimal number of input variables are selected, a simple algorithm can be used for prediction. We apply this method to a bank telemarketing campaign. The Lift table reveals that almost all the affirmative responses can be achieved by contacting just half of the whole dataset, as it will be shown. Entropy and mu-tual information can be used to quantify the information content of the selected attributes from any method on one hand, and how much of this information is transmitted to the output variable on the other.
The aim of this work is to show that concepts of information theory are an important tool in DS related to customer segmentation, either to extract the optimal number of attributes carrying most of the information of the output variable, or to measure the efficiency of any segmentation method.
This paper is organized as follows: Some concepts from Information Theory and their application to classification are presented in section 2, results and evaluation of applying this method to a real dataset are presented in section 3, final conclusions and future work are given in section 4.
2
Information Theory
2.1 Entropy and Mutual Information
Entropy and Mutual Information are well known concepts in Communications and Information Theory. They were originally introduced by Claude Shannon in a seminal paper, [14], in order to find the optimal coding of a source on one hand and a noisy channel on the other. Entropy is related to uncertainty or information content of a random variable and is defined as:
H(X) =−X x∈X
p(x) logp(x) (1)
When more probable is the event, less information gives its occurrence. En-tropy is bounded by the cardinality of the set of outcomes:H(X)≤log|X |and attains its maximum when the events follow a uniform distribution pi = |X |1 . The bigger the entropy, the more random are the events, then, the occurrence of an event gives more information, though they are less predictable.
Mutual information between sets of random variablesXn={X
1, X2,· · ·, Xn} andYn={Y1, Y2,· · ·, Yn} is defined as follows:
I(Xn;Yn) = X xn∈Xn,yn∈Yn p(xn, yn) log p(x n, yn) p(xn)p(yn) =H(Xn)−H(Xn|Yn) =H(Yn)−H(Yn|Xn) =H(Xn) +H(Yn)−H(Xn, Yn) (2) whereXm andYmare the set of outcomes ofxn andym, see [3] for details. 2.2 The noisy communication channel
A communication channel is a device or medium capable of transmitting infor-mation. Because of noise, the input and output information are not the same but related. We can use the mutual information as a measure of that relation. We will consider thereafter thatX is the random variable at the input andY is the output random variable. According to the source coding theorem, we know that the entropy is a measure of the average bits of information necessary to code the outcomes of a given random variable. In this way,H(X) is a measure of the input information to the channel,H(Y) the information content at the output, I(X;Y) the transmitted information, and taking into account the relations (2): H(Y|X) is a measure of the noise introduced by the channel. The conditional entropy H(X|Y) is called equivocation or ambiguity and it must be subtracted to the input information in order to obtain the transmitted information. Accord-ing to the channel codAccord-ing theorem, the Mutual Information gives the channel capacity and determines the maximum rate of information transmitted by the channel, see details in [14] and [3].
2.3 Feature selection using Mutual information
Feature selection is a very important issue not just in DM but in other scientific areas, [4]. This is a quite important task in customer segmentation since an optimal selection of attributes or variables simplifies the prediction algorithm.
Recalling explanations about the entropy remarked before, since the entropy is lower for more predictable random variables, we look for a given set of input variables having the lowest joint entropy on one hand, and also carrying most of the information of the output variable on the other. This method is usually called Information Gain or Max-Relevance Min-redundancy in the literature, see [5] and [10] for details. Mutual Information can be used to choose the set of attributes carrying out most of the information. Then, from the whole set of attributes Xn = {X1, X2,· · ·, Xn}, we choose a subset Xm ⊂ Xn in such a way that being Y the output variable: I(Xm;Y) carries enough information according to a given criterion, see for example [5], [12] and [15]. Mutual In-formation allows eliminating attributes not related to the output variable on
one hand, and attributes with redundant information on the other. A situation where redundant information can be removed arises when variables are con-nected in a Markov chain: X1→X2 →Y. A well known relation for this case is given by the data processing inequality I(X1;X2)≥I(X1;Y), the relations: I(X1, X2;Y) = I(X2;Y), I(X2;Y) ≥I(X1;Y) can be also demonstrated in a similar way. Then, we can point out that these functions from the information theory are quite suitable to eliminate redundant information, not generally taken into account with other methods.
3
Application to a real case
We will apply next the information theory concepts to real data first analyzed in [8] and available at [13] corresponding to a directed bank marketing campaign performed by its own contact-center. This dataset has also been used in [11] and has been recently completed and extensively analyzed in [9].
3.1 The dataset
The dataset collected is related to a bank telemarketing campaign to sell long-term deposits that occurred between May 2008 and November 2013, correspond-ing to a total of 52,944 contacts. For each contact, several number of attributes were stored despite the result (success or not success). For the whole database considered, there were 6557 successes (12.38% success rate). We use the available dataset: a testing set with 41188 records and a training set with 4120 records randomly chosen, having the 21 attributes listed below:
– Bank client data: 1. age (numeric)
2. job : type of job (categorical: ”admin.”,”unknown”,”unemployed”,”management”, ”housemaid”,”entrepreneur”,”student”,”blue-collar”,”self-employed”,”retired”, ”technician”,”services”)
3. marital : marital status (categorical: ”married”,”divorced”,”single”; note: ”di-vorced” means divorced or widowed)
4. education (categorical: ”unknown”,”secondary”,”primary”,”tertiary”) 5. default: has credit in default? (binary: ”yes”,”no”)
6. balance: average yearly balance, in euros (numeric) 7. housing: has housing loan? (binary: ”yes”,”no”) 8. loan: has personal loan? (binary: ”yes”,”no”)
– Related with the last contact of the current campaign:
9. contact: contact communication type (categorical: ”unknown”,”telephone”, ”cellular”)
10. day: last contact day of the month (numeric)
11. month: last contact month of year (categorical: ”jan”, ”feb”, ”mar”, ..., ”nov”, ”dec”)
12. duration: last contact duration, in seconds (numeric)
13. campaign: number of contacts performed during this campaign and for this client (numeric, includes last contact)
14. pdays: number of days that passed by after the client was last contacted from a previous campaign (numeric, -1 means client was not previously contacted) 15. previous: number of contacts performed before this campaign and for this client
(numeric)
16. poutcome: outcome of the previous marketing campaign (categorical: ”un-known”,”other”,”failure”,”success”)
– social and economic context attributes
17. emp.var.rate: employment variation rate - quarterly indicator (numeric) 18. cons.price.idx: consumer price index - monthly indicator (numeric) 19. cons.conf.idx: consumer confidence index - monthly indicator (numeric) 20. euribor3m: euribor 3 month rate - daily indicator (numeric)
21. nr.employed: number of employees - quarterly indicator (numeric)
– Output variable (desired target):
22. y - has the client subscribed a term deposit? (binary: ”yes”,”no”)
3.2 Feature selection
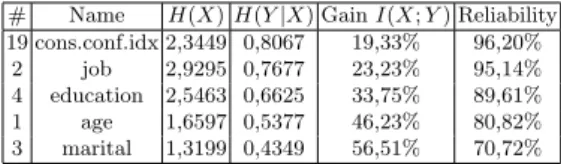
In the variable selection stage, a set of relevant variables are selected from the training set as those who carry sufficient information. Since it is impor-tant to evaluate models having no other knowledge than previous campaigns we remove from the dataset variables corresponding to the current campaign ”contact”, ”month”, ”day”, ”duration” and ”campaign”. Since the software powerhouseTM[1] performs a segmentation process based on information the-ory, we use that product in order to get the metrics. The software calculates the mutual information between a subset of attributes Xm ⊂ Xn and the output variable separately by estimating the joint probability getting a per-centage indicator (information gain) as: IG(Xm) = I(Y;Xm)
H(Y) ×100, clearly 0≤IG(Xm)≤100. A goodness of estimation of the joint probabilityp(Xm, Y) is performed by using a χ2 statistical test that gives a reliability percentage Rel(Xm) = Percentage confidence of theχ2estimation test of p(Xm, Y). The chosen subsetXm is that with maximum productIG(Xm)×Rel(Xm).
# Name H(X)H(Y|X) GainI(X;Y) Reliability 19 cons.conf.idx 2,3449 0,8067 19,33% 96,20%
2 job 2,9295 0,7677 23,23% 95,14% 4 education 2,5463 0,6625 33,75% 89,61% 1 age 1,6597 0,5377 46,23% 80,82% 3 marital 1,3199 0,4349 56,51% 70,72%
Table 1.Selected variables.
Elimination of redundant information occurs in the present data with the variable ”previous”, despite of this variable is mentioned as quite relevant in the original paper [8], it is not taken into account in our model. This is a conse-quence of the relation between ”previous” with ”pdays” and ”poutcome”. This
relation is rapidly seen in the software we used, we can see that ”pdays” gives approximately 80 % of information of previous. Our selected features and their relative importance differ from those obtained in [9], where an adapted forward selection method was used.
3.3 Prediction
Once the more relevant variables are selected based on the information content, we can develop a predictive model using different techniques from naive Bayes to the most recent support vector machines, neural networks and genetic al-gorithms, see for example [11], [9] for a review. Since we focus on the feature selection, we use the simple logistic regression method to predict the output variable in order to measure the efficiency of our selection.
3.4 Evaluation
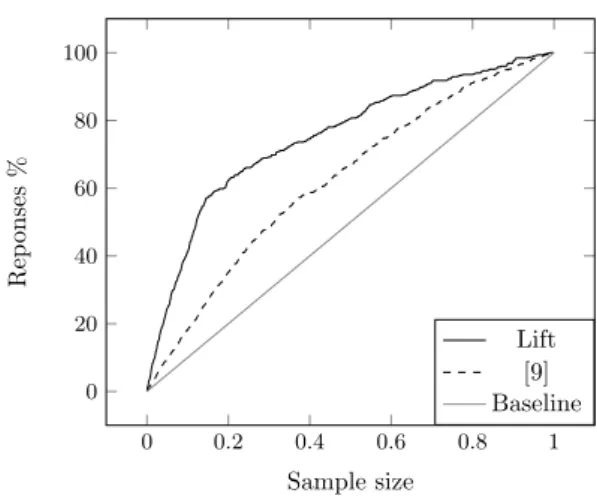
Since Lift is a usually used metrics to evaluate models, the Lift curve is shown in fig. 1. The area under the lift curve is ALIFT = 0.754. The lift reflects that with our model, 80% of the positive responses can be achieved by 50% of the sample scored with this method. The confusion matrix obtained from our model is shown in table (2). Then, the Company can get good results contacting just half of the sample, saving a lot of time and money.
Predicted as Target failure success failure 28583 7964 success 1817 2824
Table 2.Confusion Matrix
As it can be seen from the confusion matrix, by using our model, the cam-paign will miss just 7964 successful phone calls and avoid 28583 that would result in unsuccessful contacts, a useful information for managers. The model has low sensitivity on one hand, and a very good specificity on the other. The good specificity results in a very good Lift curve as a consequence. It is interesting to compare our results with those reported in [9] where the logistic regression algorithm of the rminer package from R using all the attributes (even more than those available online) was used. Since different test and training sets were used in [9], this must be considered as a rough comparison. Both curves are shown in fig. 1. Since no heavy CPU consume is involved, the product we use per-forms either the feature selection or prediction in few seconds in an IntelTM I3 processor.
Regarding the noisy communication channel described in section (2), we show in fig. 2 the estimated information content of the input variables, the output vari-able and the transmitted information for the present dataset. We recall that the output is a dichotomous variable with entropy bounded to 1 bit of information.
0 0.2 0.4 0.6 0.8 1 0 20 40 60 80 100 Sample size Rep onses % Lift [9] Baseline
Fig. 1.The Lift curve obtained by the Logistic regression prediction algorithm.
Transmitted Information 0.28 bits Input Information 9.25 bits Required Information 0.50 bits Noise 0.22 bits Equivocation 8.97 bits
Fig. 2.Estimated information contents
4
Conclusions
A customer segmentation method based on information theory was developed. We have shown the advantages of applying the information theory concepts in order to eliminate redundant or irrelevant attributes. Results of applying the method to a real data set with the analysis of the performance was shown. The Lift table shows that a successful bank marketing campaign can be achieved by contacting just half of the whole dataset, as it was illustrated. As a result, we have shown that Information Theory is an important tool for client selection decisions.
Acknowledgements
One of us (NRB) would like to thank Universidad Nacional de Tres de Febrero for financial support under grant no. 32/15 201.
References
1. http://www.dataxplore.com.ar/tecnologia.php#Powerhouse
2. Bonev, B.: Feature Selection based on Information Theory. Ph.D. thesis, University of Alicante (June 2010)
3. Cover, T.M., Thomas, J.A.: Elements of Information Theory (Wiley Series in Telecommunications and Signal Processing). Wiley-Interscience (2006)
4. Guyon, I., Elisseeff, A.: An introduction to variable and feature selection. J. Mach. Learn. Res. 3, 1157–1182 (Mar 2003),http://dl.acm.org/citation.cfm? id=944919.944968
5. Hall, M.A., Holmes, G.: Benchmarking attribute selection techniques for discrete class data mining. IEEE Trans. on Knowl. and Data Eng. 15(6), 1437–1447 (Nov 2003),http://dx.doi.org/10.1109/TKDE.2003.1245283
6. Han, J., Kamber, M., Pei, J.: Data Mining: Concepts and Techniques. Morgan Kaufmann Publishers Inc., San Francisco, CA, USA, 3rd edn. (2011)
7. Jiang, F., Sui, Y., Zhou, L.: A relative decision entropy-based feature selection approach. Pattern Recogn. 48(7), 2151–2163 (Jul 2015), http://dx.doi.org/10. 1016/j.patcog.2015.01.023
8. Moro, S., Laureano, R.M.S., Cortez, P.: Using data mining for bank direct mar-keting: an application of the crisp-dm methodology. In: P. Novais, J. Machado, C.A.A.A. (ed.) Proceedings of European Simulation and Modeling Conference. pp. 117–122. Eurosis, Eurosis, Guimaraes (2011), http://www.eurosis.org/cms/?q= node/1742
9. Moro, S., Cortez, P., Rita, P.: A data-driven approach to predict the success of bank telemarketing. Decision Support Systems 62, 22–31 (2014),http://dx.doi. org/10.1016/j.dss.2014.03.001
10. Peng, H., Long, F., Ding, C.: Feature selection based on mutual information criteria of max-dependency, max-relevance, and min-redundancy. Pattern Analysis and Machine Intelligence, IEEE Transactions on 27(8), 1226–1238 (Aug 2005) 11. Popelka, O., H˘rebi˘cek, J., ˘Stencl, M., Trenz, O.: Comparison of different
non-statistical classification methods. In: k, J.R., Stav´arek, D. (eds.) Proceedings of 30th International Conference Mathematical Methods in Economics. pp. 727–732. Czech Econometric Society, Silesian University in Opava, School of Business Ad-ministration in Karvin´a, Karvin´a (2012)
12. Pyle, D.: Data Preparation for Data Mining. Morgan Kaufmann Publishers Inc., San Francisco, CA, USA (1999)
13. S. Moro, P.C., Rita, P.: Center for machine learning and intelligent systems.http: //archive.ics.uci.edu/ml/machine-learning-databases/00222/(2014) 14. Shannon, C.: A mathematical theory of communication. Bell System Technical
Journal 27, 379–423, 623–656 (1948)
15. Sheth-Voss, P., Carreras, I.E.: How informative is your segmentation? Marketing Research 22, 9–13 (Jan 2010)