streaming
Author(s)
Wu, C; Li, B; Zhao, S
Citation
IEEE/ACM Transactions on Networking, 2011, v. 19 n. 5, p. 1317-
1330
Issued Date
2011
URL
http://hdl.handle.net/10722/152472
Rights
©2011 IEEE. Personal use of this material is permitted. However,
permission to reprint/republish this material for advertising or
promotional purposes or for creating new collective works for
resale or redistribution to servers or lists, or to reuse any
copyrighted component of this work in other works must be
obtained from the IEEE.
On Dynamic Server Provisioning in Multichannel
P2P Live Streaming
Chuan Wu
, Member, IEEE, ACM
, Baochun Li
, Senior Member, IEEE, Member, ACM
, and Shuqiao Zhao
Abstract—To guarantee the streaming quality in live peer-to-peer (P2P) streaming channels, it is preferable to provision ade-quate levels of upload capacities at dedicated streaming servers, compensating for peer instability and time-varying peer upload bandwidth availability. Most commercial P2P streaming systems have resorted to the practice of overprovisioning a fixed amount of upload capacity on streaming servers. In this paper, we have per-formed a detailed analysis on 10 months of run-time traces from UUSee, a commercial P2P streaming system, and observed that available server capacities are not able to keep up with the in-creasing demand by hundreds of channels. We propose a novel online server capacity provisioning algorithm that proactively ad-justs server capacities available to each of the concurrent chan-nels, such that the supply of server bandwidth in each channel dy-namically adapts to the forecasted demand, taking into account the number of peers, the streaming quality, and the channel pri-ority. The algorithm is able to learn over time, has full Internet ser-vice provider (ISP) awareness to maximally constrain P2P traffic within ISP boundaries, and can provide differentiated streaming qualities to different channels by manipulating their priorities. To evaluate its effectiveness, our experiments are based on an imple-mentation of the algorithm, which replays real-world traces.
Index Terms—Distributed applications, multiple channels, peer-to-peer (P2P) streaming, server bandwidth provisioning.
I. INTRODUCTION
L
ARGE-SCALE peer-to-peer (P2P) live streaming has recently been successfully and commercially de-ployed [1]–[4], in which hundreds of media channels are routinely broadcast to hundreds of thousands of users at any given time. The essence of P2P streaming is the use of peer upload bandwidth to alleviate the load on dedicated streaming servers [5]. Most existing research has thus far focused on peer strategies: Should a mesh or tree topology be constructed? What incentives can be provisioned to encourage peer bandwidth contribution? How do we cope with peer churn and maintain the quality of live streams? We recognize the importance of these open research challenges, as their solutions seek to maximally utilize peer upload bandwidth, leading to minimized server costs.Manuscript received May 21, 2009; revised December 21, 2009; accepted January 11, 2011; approved by IEEE/ACM TRANSACTIONS ONNETWORKING
Editor P. Rodriguez. Date of publication February 14, 2011; date of current version October 14, 2011.
C. Wu is with the Department of Computer Science, The University of Hong Kong, Hong Kong, China (e-mail: [email protected]).
B. Li is with the Department of Electrical and Computer Engineering, Univer-sity of Toronto, Toronto, ON M5S 3G4, Canada (e-mail: [email protected]). S. Zhao is with the Multimedia Development Group, UUSee, Inc., Beijing 100007, China (e-mail: [email protected]).
Color versions of one or more of the figures in this paper are available online at http://ieeexplore.ieee.org.
Digital Object Identifier 10.1109/TNET.2011.2107563
In this paper, however, we shift our focus to the streaming servers. Such refocusing on servers is motivated by our detailed analysis of 10 months and 800 GB worth of real-world traces from hundreds of streaming channels in UUSee [3], a large-scale commercial P2P live streaming system in China. As with all other commercial live streaming systems (e.g., PPLive [2] and PPStream [4]), in order to maintain a satisfactory and sus-tained streaming quality, UUSee has so far resorted to the prac-tice of overprovisioning a fixed amount of server capacity to sat-isfy the streaming demand from peers in all its channels, coun-teracting the impact of volatile peer dynamics and time-varying peer upload bandwidth availability. Nevertheless, contrary to common belief, we have observed that the deployed capacities on streaming servers are not able to keep up with the increasing demand from hundreds of channels in practice, leading to de-graded streaming quality in all channels. In response, we ad-vocate to allocate limited server capacities to each of the chan-nels based on their popularity and priority in order to maximally utilize dedicated servers and also to dynamically determine the minimum overall amount of server capacity to be deployed in the system.
While it is certainly a challenge to determine the minimum amount of server bandwidth to provision to accommodate the streaming demand of all concurrent channels, the challenge is more daunting when we further consider the conflict of interest between P2P solution providers and Internet service providers (ISPs). P2P applications have significantly increased the volume of inter-ISP traffic, which in some cases leads to ISP filtering. We seek to design effective provisioning algorithms on servers with the awareness of ISP boundaries to minimize inter-ISP traffic.
Toward these objectives, this paper presentsRation, an on-line server capacity provisioning algorithm to be carried out on a per-ISP basis.Rationdynamically computes the minimal amount of server capacity to be provisioned to each channel in-side the ISP in order to guarantee a desired level of streaming quality for each channel, depending on its popularity and pri-ority. With the analysis of our real-world traces, we have ob-served that the number of peers and their contributed bandwidth in each channel vary dynamically over time and significantly af-fect the required bandwidth from servers.Rationis designed to activelypredictthe server bandwidth demand in each channel in an ISP with time series forecasting and dynamic regression techniques, utilizing the number of active peers, the streaming quality, and the server bandwidth usage within a limited window of recent history. It then proactively allocates server bandwidth to each channel, respecting the predicted demand and priority of channels. To show the effectiveness ofRation, it has been implemented in streaming servers serving a mesh-based P2P streaming system. In a cluster of dual-CPU servers, the system 1063-6692/$26.00 © 2011 IEEE
emulates real-world P2P streaming by replaying the scenarios captured by UUSee traces.
The remainder of this paper is organized as follows. In Section II, we motivate our focus on servers by showing our analysis of 10 months worth of traces from UUSee. In Section III, we present the design ofRation. In Section IV, we discuss how Rationmay be deployed with ISP awareness to serve real-world P2P streaming systems. Section V presents our experimental results evaluatingRationby replaying traces in a P2P streaming system running in a server cluster. We discuss related work and conclude the paper in Sections VI and VII, respectively.
II. MOTIVATIONFROMREAL-WORLDTRACES Why shall we refocus our attention to dedicated streaming servers in P2P live streaming systems? Starting September 2006, we have continuously monitored the performance statis-tics of a real-world commercial P2P streaming platform, offered by UUSee, Inc., a leading P2P streaming solution provider with legal contractual rights with mainstream content providers in China. As with other systems such as PPLive, UUSee maintains a sizable array of about 150 dedicated streaming servers to support its P2P streaming topologies with hundreds of channels to millions of users, mostly in 400-kb/s media streams. With 80% of users in China, the UUSee network spans over 20 ISPs in China and around 35 countries in the world. UUSee streaming protocol utilizes the “pull-based” design on mesh P2P topologies that allows peers to serve other peers (“partners”) by exchanging media blocks in their playback buffers, which represent a sliding window of the stream. When a new peer joins a channel in UUSee, the initial set of a number of partners (up to 50) is supplied by one of the tracker servers by randomly selecting from all the existing peers in the channel with available upload bandwidth. The peer establishes TCP connections with these partners, and buffer availability bitmaps (also called “buffer maps”) are periodically exchanged. The buffer size at each peer in UUSee is 500 media blocks, and each block represents 1/3 s of media playback (about 10 MB in total).
To maximally utilize peer upload bandwidth and alleviate server load, UUSee incorporates a number of algorithms in peer selection. Each peer applies an algorithm to estimate its max-imum upload capacity and continuously estimates its aggregate instantaneous sending throughput to its partners. If its estimated sending throughput is lower than its upload capacity for 30 s, it will inform one of the tracker servers that it is able to re-ceive new connections. The tracker servers keep a list of such peers and assign them upon requests of partners from other peers. In addition, the number of consecutive blocks received and cached in the current playback buffer, starting from the cur-rent playback time, is used in UUSee protocol to represent the current streaming quality of each peer, which is referred to as thebuffering level. During the streaming process, neighboring peers may also recommend partners to each other based on their current streaming quality. A peer may contact a tracker server again to obtain additional peers with better qualities once it has experienced a low buffering level for a sustained period of time. Moreover, UUSee has implemented a number of NAT/firewall traversal techniques based on classification of different types of
user connections in its network,in order to maximize peer band-width contribution.
To inspect the run-time behavior of UUSee P2P streaming, we have implemented extensive measurement and reporting capabilities within its P2P client application. Each peer collects a set of its vital statistics and reports to dedicated trace servers every 5 min via UDP. The statistics include its IP address, the channel it is watching, its buffer map, its buffering level, as well as a list of all its partners with their corresponding IP addresses, TCP/UDP ports, and current sending/receiving throughput to/from each of them. Each dedicated streaming server in UUSee utilizes a similar protocol as deployed on regular peers, is routinely selected to serve the peers, and reports its related statistics periodically as well. A detailed description on UUSee protocol and the measurement methodologies for the above metrics can be found in our previous works [6] and [7].
During a 10-month period from September 2006 to July 2007, we have collected more than 800 GB worth of traces with more than 600 million unique IP addresses, representing time-contin-uous snapshots of the live channels sustained in UUSee every 5 min in this long period of time. Each snapshot captures the in-formation on more than 100 000 concurrent peers in the entire UUSee network.
A. Insufficient “Supply” of Server Bandwidth
What have we discovered from the traces? The first obser-vation we made is related to the insufficient “supply” of server bandwidth, as more channels are added over time. Such insuffi-ciency has gradually affected the streaming quality in both pop-ular and less poppop-ular channels.
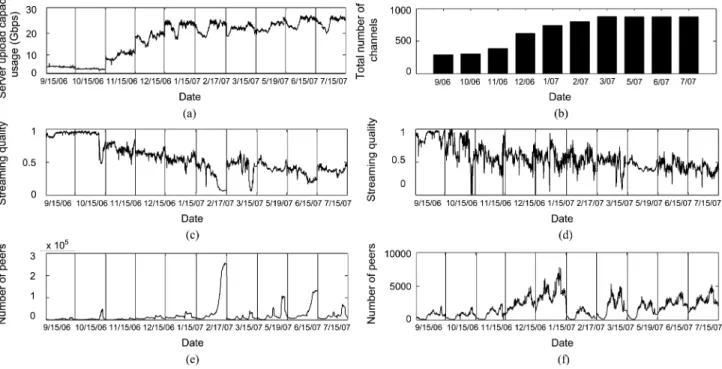
In order to show bandwidth usage over 10 months and at different times of a day within one figure, we choose to show all our 5-min measurements on representative dates in each month. One such date—February 17, 2007—is intentionally chosen to coincide with the Chinese New Year event, with typical flash crowds due to the broadcast of a celebration show on a number of the channels. April 2007 is skipped due to lack of traces in the month caused by an upgrade of the trace servers. Fig. 1(a) shows the total server bandwidth usage on 150 streaming servers. We may observe that an increasing amount of server bandwidth has been consumed over time, but stabilizes starting January 2007. This rising trend can be explained by the rapidly increasing number of channels deployed during this period, as shown in Fig. 1(b). The interesting phenomenon that such bandwidth usage has stabilized, even during the Chinese New Year flash crowd, has led to the conjecture that the total uplink capacity of all servers has been reached. The daily variation of server bandwidth usage coincides with the daily pattern of peer population.
Our conjecture that server capacities have saturated is confirmed when we investigate the streaming quality in each channel. The streaming quality in a channel at each time is evaluated as the percentage of high-quality peers in the channel, where a high-quality peer has a buffering level of more than 80% of the total size of its playback buffer. The criterion of buffering level (i.e., the number of consecutive blocks received and cached in the current playback buffer of a peer) has been extensively used in UUSee system to evaluate the current streaming quality of a peer, and the 80% bench-mark has empirically been shown to be effective in reflecting
Fig. 1. Evolution of server bandwidth, channels, and streaming quality from September 2006 to July 2007. (a) Server capacity usage over time. (b) Number of channels deployed over time. (c) Streaming quality of a popular channel (CCTV1). (d) Streaming quality of a less popular channel (CCTV12). (e) Population of a popular channel (CCTV1). (f) Population of a less popular channel (CCTV12).
the playback continuity of a peer in the following few min-utes, based on an internal performance monitoring system in UUSee. Accordingly, we also use the peer buffering level as our streaming quality criterion.1 Representative results with a popular channelCCTV1and a less popular channelCCTV12are shown in Fig. 1(c) and (d), respectively, with their population measurements plotted in Fig. 1(e) and (f), respectively. The streaming quality of both channels has been decreasing over time as server capacities are saturated. During the Chinese New Year flash crowd, the streaming quality of CCTV1 degraded significantly due to the lack of bandwidth to serve a flash crowd of users in the channel, as illustrated in Fig. 1(e).
Would it be possible that the lack of peer bandwidth con-tribution has led to the overwhelming demand of the servers? As we noted, the protocol in UUSee uses optimizing algo-rithms to maximize peer upload bandwidth utilization, which represents one of the state-of-the-art peer strategies in P2P streaming. The following back-of-the-envelope calculation with data from the traces may be convincing: At one time on October 15, 2006, about 100 000 peers in the entire net-work each achieved a streaming rate around 400 kb/s by consuming a bandwidth level of 2 Gb/s from the servers. The upload bandwidth contributed by peers can be computed as kb/s, which is 380 kb/s per peer on average. This represents quite an achievement, con-sidering that most of the UUSee clientele are ADSL users in China with a maximum of 512 kb/s upload capacity and that many random factors influence the available upload bandwidth at the peers.
1Nevertheless, we have evaluated a number of other possible streaming quality metrics, such as the instantaneous streaming download rate of a peer, and still identified the one we use as the most effective in reflecting the streaming quality of peers/channels.
In addition, one may doubt if the downgrade of streaming quality during flash crowd scenarios could have been caused by bandwidth bottlenecks within the Internet backbone at those times. Our previous measurement studies in [7] have revealed that there does not exist significant difference between band-width availabilities on P2P links that are decided by Internet backbone bandwidths at regular times and during flash crowd scenarios and have confirmed the common belief that bandwidth constraints in P2P streaming mainly lie at the last-mile upload links at the peers and servers in most cases.
All the above observations have led to the conclusion that server capacities have increasingly become a bottleneck in real-world P2P live streaming solutions. When the server ca-pacity usage by different channels is not regulated and is largely random (as in the current UUSee protocol), the results are less than satisfactory: Taking a typical streaming quality result of 0.5 for both CCTV1 and CCTV12, there are many more peers experiencing a low buffering level in the popular channel than in the less popular channel, considering the large difference of their populations. In practice, we may wish to provide a good streaming experience to as many peers as possible in the entire system, and therefore advocate to allocate the limited server capacities to each of the channels based on their popularity and priority in order to maximally utilize dedicated servers.
B. Increasing Volume of Inter-ISP Traffic
The current UUSee protocol is not aware of ISPs. We now investigate the volume of inter-ISP traffic during the 10-month period, computed as the throughput sum of all links across ISP boundaries at each time. For each IP address in the traces, we de-rive the autonomous system (AS) it belongs to using the Whois service provided by Cymru [8] and then map each China AS
Fig. 2. Volume of inter-ISP traffic increases over time.
number to its affiliated ISP by making use of the official map-ping data provided by CERNET, China [9].2Fig. 2 reveals that both the inter-ISP peer-to-peer and server-to-peer traffic have been increasing, quadrupled over the 10-month period, due to the increased number of channels and peers.
In China, the two nationwide ISPs, Netcom and Telecom, charge each other based on the difference of inter-ISP traffic volume in both directions, and regional ISPs are charged based on traffic to and from the nationwide ISPs. Both charging mechanisms have made it important for ISPs to limit inter-ISP traffic. Considering the large and persistent bandwidth con-sumption for live streaming, we believe that P2P streaming systems should be designed to minimize inter-ISP traffic (to avoid the fate of traffic filtering by ISPs), which remains one of our objectives in this paper.
C. What is the Required Server Bandwidth for Each Channel?
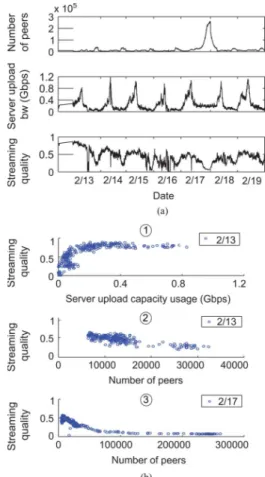
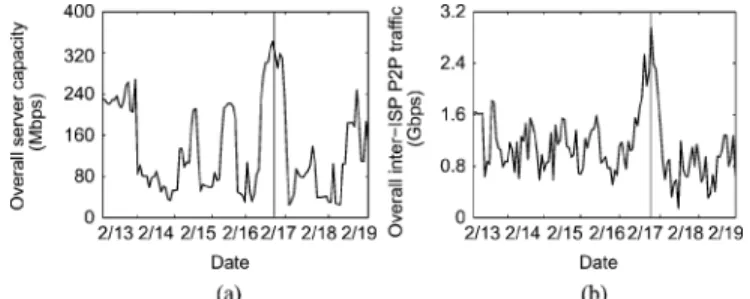
To determine the amount of server bandwidth needed to achieve a specific level of streaming quality in each channel, we wish to explore the relation among server upload bandwidth, the number of peers, and the achieved streaming quality in each channel. Fig. 3(a) illustrates the evolution of the three quantities for channel CCTV1 over a period of one week, from February 13–19, 2007. We can observe a weak positive corre-lation between the server bandwidth and the streaming quality and a weak negative correlation between the peer population and the streaming quality.
To further explore any evident correlation on a shorter timescale, we plot in Fig. 3(b)-1 the correlation between server upload bandwidth usage and the streaming quality on February 13, and that between the number of peers and the streaming quality in Fig. 3(b)-2. We can observe an evident positive relation between the two quantities in the former figure and a negative correlation in the latter. We have extensively explored such correlation in many channels over different dates and have observed that the correlation varies from one time to another even in the same channel, which can be attributed to the time-varying aggregate peer upload bandwidth in the channel over time. For example, Fig. 3(b)-3 plots the relation between the number of peers and the streaming quality on February 17, which approximates a reciprocal curve.
Another interesting observation we have made here is that, contrary to common belief, we have observed a decreasing trend of streaming quality in a streaming channel when the number of peers increases, based on our extensive study of many streaming channels over many time intervals. We believe the reason lies in that many peers cannot contribute up to the level of their re-quired streaming rate (about 400 kb/s) in such a practical P2P 2The majority of UUSee users are in China, and we focus on trace data of such users in producing Fig. 2.
Fig. 3. Relationship among server upload bandwidth, number of peers, and streaming quality in channel CCTV1. (a) Evolution of the three quantities over time. (b) Correlation among the three quantities.
system over today’s Internet, which further justifies the neces-sity of deploying server capacity in the system.
All of our observations thus far point to the challenging nature of our problem at hand: How much server bandwidth should we allocate in each channel in each ISP to assist the peers?
III. Ration: ONLINESERVERCAPACITYPROVISIONING Our proposal isRation, an online server capacity provisioning algorithm to be carried out on a per-ISP basis that dynamically assigns a minimal amount of server capacity to each channel to achieve a desired level of streaming quality.
A. Problem Formulation
We consider a P2P live streaming system with multiple chan-nels (such as UUSee). We assume that the tracker server in the system is aware of ISPs: When it supplies any requesting peer with information of new partners, it first assigns peers (or ded-icated servers) with available upload bandwidth from the same ISP. Only when no such peers or servers exist will the tracker server assign peers from other ISPs.
The focus of Rationis the dynamic provisioning of server capacity in each ISP,3carried out by a designated server in the ISP. In the ISP that we consider, there are a total of con-current channels to be deployed, represented as a set . There 3We note thatRationcan be extended to cases in which it is not feasible to deploy servers in each ISP by having servers in one ISP responsible to serve peers from a number of nearby ISPs.
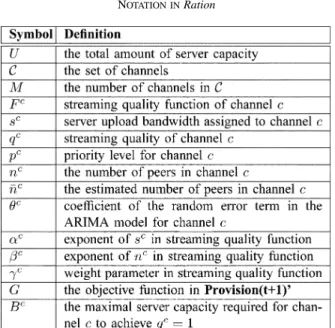
TABLE I NOTATION INRation
are peers in channel . Let denote the server upload bandwidth to be assigned to channel and denote the streaming quality of channel , i.e., the percentage of high-quality peers in the channel that have a buffering level of more than 80% of the size of its playback buffer. Let be the total amount of server capacity to be deployed in the ISP. We assume a priority level for each channel , which can be assigned different values by the P2P streaming solution provider to achieve service differentiation across the channels. We list important notations in this paper in Table I for ease of reference.
At each time ,Ration proactivelycomputes the amount of server capacity to be allocated to each channel for time that achieves optimal utilization of the limited overall server capacity across all the channels based on their priority and popularity (as defined by the number of peers in the channel) at time . Such an objective can be formally represented by
the optimization problem as follows
, in which astreaming quality function is included to represent the relationship among , and at time :
:
(1) subject to
(2) Weighting the streaming quality of each channel with its priority , the objective function in (1) reflects our wish to differentiate channel qualities based on their priorities. With channel popularity in the weights, we aim to provide better streaming qualities for channels with more peers. Noting that represents the number of high-quality peers in channel , in this way we guarantee that, overall, more peers in the network can achieve satisfying streaming qualities.
The challenges in solving at time to de-rive the optimal values of are the following: 1) the uncertainty of the channel popularity , i.e., the number of peers in each channel in the future; and 2) the dynamic relation-ship among , , and of each channel at time . In what follows, we present our solutions to both challenges.
B. Active Prediction of Channel Popularity
We first estimate the number of active peers in each channel at the future time , i.e., . Existing work has been modeling the evolution of the number of peers in P2P streaming systems based on Poisson arrivals and Pareto lifetime distributions (e.g., [10]). We argue that these models represent simplifications of real-world P2P live streaming systems, where peer dynamics are actually affected by many random factors. To dynamically and accurately predict the number of peers in a channel, we employ time-series forecasting techniques. We treat the number of peers in each channel , i.e., , as an unknown random process evolving over time and use the re-cent historical values to forecast the most likely values of the process in the future.
As the time series of channel popularity is generally nonsta-tionary (i.e., its values do not vary around a fixed mean), we utilize the autoregressive integrated moving average model, , which is a standard linear predictor to tackle nonstationary time series with high accuracy [11]. With , a time series , is differenced times to derive a stationary series , and each value of can be expressed as the linear weighted sum of previous values in the series, and previous random errors, . The employment
of an model involves two steps: 1) model
identification, i.e., the decision of model parameters , , ; and 2) model estimation, i.e., the estimation of coefficients in the linear weighted summation.
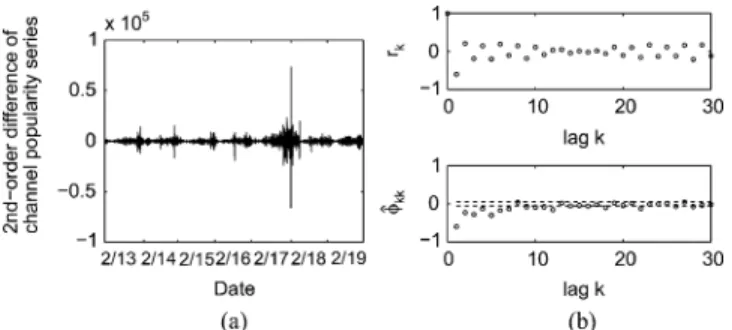
In model identification, to determine the degree of differ-encing, , a standard technique is to difference the time series as many times as is needed to produce stationary time series. We have therefore derived for our time series
, based on the observations that the second-order differ-ence of the original time series for all the channels is largely stationary. For example, Fig. 4(a) shows the second-order dif-ference of the channel popularity time series of CCTV1, as given in Fig. 3(a)-1, which is stationary with the mean of zero. To identify the values of and , the standard technique is to study the general appearance of the estimated autocorrelation and partial autocorrelation functions of the differenced time se-ries [11, p. 187]. For example, Fig. 4(b) plots the autocorrela-tion and partial autocorrelation function values of the dif-ferenced channel popularity series in Fig. 4(a) up to lag . We observe that only is nonzero and tails off, which iden-tifies and [11, p. 186]. As we have generally made similar observations regarding channel popularity series for other channels, we derive an model to use in our prediction in each streaming channel.
Having identified an model, the channel popularity prediction in channel at time , , can be expressed as follows:
Fig. 4. ARIMA model identification for channel popularity series of CCTV1 in Fig. 3(a)-1. (a) Second-order difference series. (b) Autocorrelation and partial autocorrelation.
where is the coefficient for the random error term and can be estimated with a least-squares algorithm. When we use (3) for prediction in practice, the random error at the future time , i.e., , can be treated as zero, and the random error at time can be approximated by [11]. Therefore, the pre-diction function is simplified to the following. We note that the derived model is desirably simple, with only one coefficient to be estimated
(4) To dynamically refine the model for an accurate prediction of the popularity of channel over time, we propose to carry out the forecasting in a dynamic fashion. To start, the
model for channel is trained with its channel popularity sta-tistics in the most recent time steps, and the value of the coefficient is derived. Then, at each subsequent time , is predicted using (4), and the confidence interval of the pre-dicted value (at a certain confidence level, e.g., 95%) is com-puted. When time comes, the actual number of peers, , is collected and tested against the confidence bounds. If the real value lies out of the confidence interval and such pre-diction errors have occurred out of consecutive times, the forecasting model is retrained and the above process repeats. We note that the values of and represent a tradeoff between the accuracy of the model and the computational overhead in-curred. The empirical values of and work well in our experiments to be presented in Section V.
C. Dynamic Learning of the Streaming Quality Function
Next, we dynamically derive the relationship among streaming quality, server bandwidth usage, and the number of peers in each channel , denoted as the streaming quality function in (2), with a statistical regression approach.
From the trace study in Section II-C, we have observed in each specific channel , where is the exponent of , e.g., in Fig. 3(b)-1.4We also observed
, where is the exponent of , e.g., in Fig. 3(b)-3. As we have made similar relationship observations from a broad trace analysis of different channels over different times, we model the streaming quality function as
(5) 4A more accurate model for the relation in Fig. 3(b)-1 (derived using our algorithm that follows in the section) isq = 1:15(s ) . The goodness-of-fit tests applied over the converted linear regression model,log q = log 1:15 +
0:37 log s , validated the significance of the coefficients 1.15 and 0.37.
where is a weight parameter. Such a function model is
advantageousin that it can be transformed into a multiple linear regression problem by taking logarithm at both sides
Let , , , and
. We derive the following multiple linear regres-sion problem:
(6) where and are regressors, is the response variable, and is the error term. , , and are regression parameters, which can be estimated with least-squares algorithms.
In order to accurately capture the relationship among the quantities over time, we dynamically relearn the regression model in (6) for each channel in the following manner. To start, the designated server trains the regression model for channel with collected channel popularity statistics, server bandwidth usage, and channel streaming quality during the most recent time steps and derives the values of regres-sion parameters. At each following time , it uses the model to estimate the streaming quality based on the used server bandwidth and the collected number of peers in the channel at and examines the fitness of the current regression model by comparing the estimated value with the collected actual streaming quality. If the actual value exceeds the confidence interval of the predicted value for out of consecutive times, the regression model is retrained with the most recent historical data.
In summary, we emphasize that the goal for the modeling of the streaming quality function is to accurately capture the re-lationship among the streaming quality, server capacity usage, and the number of peers in a channel at each time. While one may consider using peer upload bandwidths as variables, we choose to employ the number of peers instead whose values can be more easily collected in practical systems and to represent the influence of the supply/demand of peer bandwidths on the streaming quality using both the number of peers and the dy-namically learned parameters and in (5). We further note that the signs of exponents and in (5) reflect positive or negative correlations between the streaming quality and its two deciding variables, respectively. Intuitively, we should always have , as the streaming quality should not be worse when more server capacity is provisioned and its improvement slows down with more and more server capacity provided until it finally reaches the upper bound of 1. However, the sign of could vary over time, depending on the relationship between the demand for streaming bandwidth at peers and the supply of peer upload bandwidth at different times. On one hand, the streaming quality can be improved with more high-contribution peers (e.g., Ethernet peers) in the channel (the case of ). On the other hand, if more peers join the channel with an av-erage upload bandwidth lower than the required streaming rate, a downgrade of the streaming quality would occur (the case of ). The different cases of and are to be further in-vestigated in our experiments using the traces in Section V-A2.
D. Optimal Allocation of Server Capacity
Based on the predicted channel popularity and the most re-cently derived streaming quality function for each channel, we are now ready to proactively assign the optimal amount of server capacity to each channel for time by solving problem in (1). Replacing with its function model in (5), we transform the problem in (1) into:
: (7) subject to (8) (9) (10) where the objective function
and
, denoting the maximal server ca-pacity requirement for channel at time that achieves
.
The optimal server bandwidth provisioning for each channel, , can be obtained with a water-filling approach. The implication of the approach is to maximally allocate the server capacity, at the total amount of , to the channels with the current largest marginal utility, as computed with , as long as the upper bound of indicated in (9) has not been reached. The marginal utility, , represents how much the streaming quality in a channel can be enhanced by allocating one unit more server capacity to this channel, which is decided by the priority, the number of peers, and the server capacity already allocated into the channel.
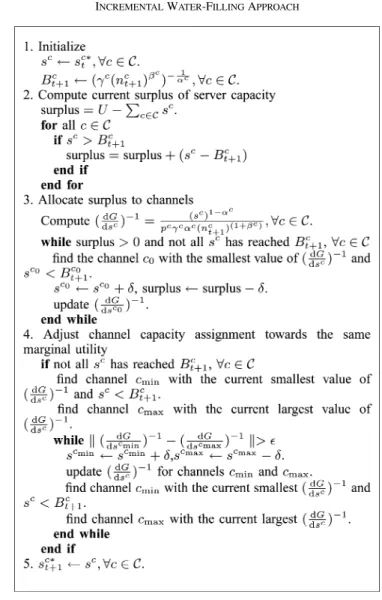
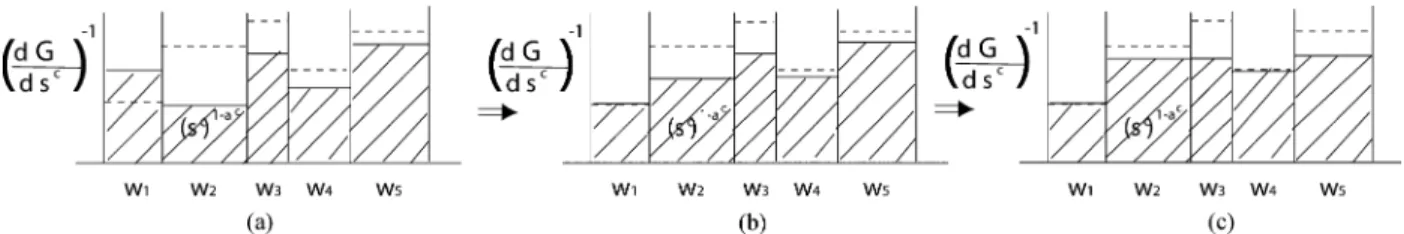
InRation, the server capacity assignment is periodically car-ried out to adapt to the changing demand in each of the chan-nels over time. To minimize the computation overhead, we pro-pose anincremental water-filling approachthat adjusts server capacity shares among the channels from their previous values instead of a complete recomputation from the very beginning.
The incremental water-filling approach is given in Table II. To better illustrate the idea ofwater filling, we utilize the reciprocal of marginal utility , i.e., , in our algorithm de-scription and maximally assign server capacity to the channels with the current smallest value of , equivalently.
We explain the incremental water-filling approach with a five-channel example in Fig. 5. In this figure, each five-channel is repre-sented by one bin. The volume of water in bin is , the
width of bin is , and thus the water
level of the bin represents for channel .
As , each bin has a maximal height ,
which is represented by the dashed line in each bin. The incre-mental water-filling approach starts with the optimal server ca-pacity allocation at the current time , i.e.,
(Step 1 in Table II). It first computes whether there exists any surplus of the overall provisioned server capacity that occurs when not all the server capacity has been used with respect to the current allocation, i.e., , or the allocated
TABLE II
INCREMENTALWATER-FILLINGAPPROACH
capacity of some channel exceeds its maximal server capacity requirement for time , i.e., [e.g., the case that the water level goes above the maximal bin height for bin 1 in Fig. 5(a)]. If so, the overall surplus is computed (Step 2 in Table II) and allocated to the channels whose maximal server capacity requirement has not been reached, starting from the channel with the current maximum marginal utility , i.e., lowest water level (Step 3 in Table II). For the example in Fig. 5, the surplus portion of the water in bin 1 in (a) is reallocated to bins 2 and 4, with the results shown in (b). After all the sur-plus has been allocated, the server capacity assignment is fur-ther adjusted among the channels toward a same marginal utility (water level) by repeatedly identifying the channel with the cur-rent smallest marginal utility and the channel with the curcur-rent largest marginal utility and moving bandwidth from the former to the latter, i.e., the water in the bin with the highest water level (largest value of ) is flooded into the bin that has the lowest water level (smallest value of ) and has not reached its maximal bin height yet (Step 4 in Table II). This process repeats until all channels have reached the same mar-ginal utility or have reached their respective maximum server bandwidth requirement. For the example in Fig. 5(b), the water from bins 3 and 5 is filled into bins 2 and 4 until bin 4 reaches
Fig. 5. Illustration of the incremental water-filling approach with five channels. (a) Step 1. (b) Steps 2 and 3. (c) Step 4.
its maximal height and bins 2, 3, and 5 achieve the same water level, as shown in Fig. 5(c).
Such an incremental water-filling approach derives the op-timal server capacity provisioning for all channels at time , as established by the following theorem.
Theorem 1: Given the channel popularity prediction , and the most recent streaming quality
func-tion , the incremental
water-filling approach obtains an optimal server capacity provi-sioning across all the channels for time , i.e., , which solves the optimization problem
in (1).
We postpone the proof of the theorem to Appendix A.
E. Ration: The Complete Algorithm
Our complete algorithm is summarized in Table III, which is periodically carried out on a designated server in each ISP. The only peer participation required is to have each peer in the ISP send periodic heartbeat messages to the server, each of which includes its current buffering level.
We note that in practice, the allocation interval is deter-mined by the P2P streaming solution provider based on need, e.g., every 30 min, and peer heartbeat intervals can be shorter, e.g., every 5 min.
We further remark on the computational complexity of the al-gorithm in Table III. The main computation for steps 2 and 3 lies in the training of ARIMA or the regression model, with least-squares algorithms at , where is the size of the training sample set. As both steps are carried out for each of the chan-nels, their complexities are at most and , respectively. We generally need no more than 30–50 samples
to train an model, i.e., , and even
fewer to derive the regression model [11], [12] (thus only a small amount of historical data needs to be maintained at the server for the execution ofRation). Further considering that the training is only carried out when necessary (i.e., when the accu-racy of the models has fallen), we conclude that the two steps incur low computational overhead in reality. At step 4, we have designed the incremental water-filling approach, which only in-volves local adjustments for channels that are affected. In sum-mary, the algorithm involves low computational overhead and can be carried out in a completely online fashion to adapt to the dynamics of P2P systems.
IV. PRACTICALIMPLICATIONS OFRation
We now discuss the practical application of Rationin real-world P2P live streaming systems. In practical systems with un-known demand for server capacity in each ISP,Rationis able to fully utilize the currently provisioned server capacity and
TABLE III
Ration: THEONLINESERVERCAPACITYPROVISIONINGALGORITHM
meanwhile provide excellent guidelines for the adjustment of based on different relationships between the supply and demand for server capacity.
A. Service Differentiation Across Channels in Tight Supply–Demand Relations
In most typical scenarios, the system is operating in a mode with tight supply–demand relations, i.e., the total server ca-pacity can barely meet the demand from all channels to achieve the best streaming qualities. In this case, Ration guarantees the limited server capacity is most efficiently utilized across the channels, respecting their demand and priority. With its water-filling approach, the preference in capacity assignment is based on the marginal utility of each channel, , as determined by the priority and popularity of the channel and the marginal improvement of its streaming quality upon a unit increase of server capacity. Given the limited server capacity
deployed in the ISP, the streaming solution provider can differ-entiate the streaming quality of the channels by manipulating the priority levels assigned to the channels. The following theorem states the proportional service differentiation across channels provided byRation.
Theorem 2: The optimal server capacity provisioning in
Rationin (1) provides the following streaming quality differen-tiation between any two channels and , which do not achieve the best streaming quality of 1 in the allocation:
where and (11)
We postpone the proof to Appendix B. Priority levels of different channels can be set according to (11) to achieve desired relative streaming quality levels across the channels. More specifically, if (we have observed similar values for many different channels in our trace studies), we have the following approximation:
In this case, if the streaming solution provider wishes to achieve a better streaming quality in channel than that in channel , i.e., , they may set the priorities for the channels, and , to satisfy the following conditions: . A similar priority assignment method can be applied to determine the priority levels of multiple channels in the system.
B. Total Server Capacity Adjustment in all Supply–Demand Relations
Rationis not only useful in optimal utilization of deployed server capacity; the channel popularity prediction and streaming function learning modules inRationcan further be used to de-termine the minimum overall amount of server capacity to be deployed in each ISP, guaranteeing desired levels of streaming qualities in all the channels.
If the P2P streaming system is operating at the tight supply–demand mode in an ISP and if the streaming solu-tion provider wishes to boost the streaming quality of all the channels to a best value around 1, they may compute how much more server capacity to add by comparing the current provisioning to the overall required server capacity to achieve . The latter amount is , where is the maximum server capacity needed for channel as in (9) in , derived using the streaming quality function in (5) by setting .
Similarly, if the system is operating with extremely tight supply–demand relations, e.g., the flash crowd scenario, most server capacity is assigned to one or few channels that are involved in the flash crowd, and most of the other channels are starving with no or very little server bandwidth. The channel popularity prediction in Ration can be used to detect such a flash crowd and to trigger the deployment of backup server resources. The extra amount to add can be computed with the
current streaming quality function derived for the respective channels according to the targeted streaming quality.
If the system is operating at the overprovisioning mode in an ISP, i.e., the total deployed server capacity exceeds the overall demand from all channels to achieve their best streaming quality, Ration allocates the necessary amount of server capacity needed for each channel to achieve its best streaming quality . This is guaranteed by (9) in , as the server capacity provisioned to each channel may not exceed the amount , which achieves . When the P2P streaming solution provider discovers that the system is always operating at the overprovisioning mode, they may reduce their server capacity deployment in the ISP to the necessary overall amount.
C. Channel Deployment in Each ISP
WithRation, the P2P streaming solution provider can dynam-ically make decisions on channel deployment in each ISP when it is not possible or necessary to deploy every one of the hun-dreds or thousands of channels in each ISP. When a channel is not allocated any server capacity due to very low popularity or priority during a period of time, the channel is not to be deployed in the ISP during this time.
D. Server Capacity Implementation
Finally, we note that the server capacity provisioning in each ISP can be implemented in practice with a number of streaming servers deployed, with the number decided by the total capacity to be provisioned and the upload capacity of each server. Inside each ISP, the servers can be further deployed in different ge-ographical areas, and the derived server capacity provisioning for each channel can be distributed among several servers as well in order to achieve load balancing and streaming delay minimization.
V. EXPERIMENTALEVALUATIONSWITHTRACEREPLAY Our evaluation ofRationis based on its implementation in a multi-ISP mesh-based P2P streaming system, which replays real-world streaming scenarios captured by the traces.
The P2P streaming system is implemented in C++ over a P2P emulation platform on a high-performance cluster of 50 Dell 1425SC and Sun v20z dual-CPU servers deployed in the networking research laboratory at the University of Toronto, Toronto, ON, Canada [13]. On this platform, we are able to emulate hundreds of concurrent peers on each server and emulate all network parameters, such as node capacities, link bandwidth bottlenecks, messaging delays, etc. Actual media streams are delivered over TCP connections among the peers, and control messages are sent by UDP. The platform supports multiple event-driven asynchronous timeout mechanisms with different timeout periods, and peer joins and departures are emulated with events scheduled at their respective times.
The P2P streaming protocol we implemented includes both the standard pull protocol and the unique algorithms employed by UUSee, as introduced in Section II. Without loss of gener-ality, we deploy one server for each ISP, implementing both the tracker server and streaming server functions.Rationis also im-plemented on each of the servers, with 800 lines of C++ code. The server capacity allocation for each channel is implemented
by limiting the total number of bytes sent over the outgoing con-nections from the server for the channel in each unit time.
Our experiments are carried out on realistic replays of the traces. We emulate peer dynamics based on the evolution of the number of peers in each channel from the traces: When the number of peers rises between two consecutive time intervals, we schedule a corresponding number of peer join events during the interval; when the number of peers decreases, peer departure events are scheduled for a corresponding number of randomly selected peers. Upon arrival, each peer acquires 30 initial up-stream peers, and the P2P topology evolves based on the same peer selection protocol as UUSee employs. The node upload ca-pacities are emulated using values from the traces, which follow a heavy-tail distribution in the major range of 50 kb/s to 10 Mb/s. The streaming rate of each channel is 400 kb/s, with the streams divided into 1-s blocks for distribution. The size of the playback buffer on the peers is set to 30 s. Each peer reports its buffering level to the server in its ISP every 20 s with heartbeat messages, and the server processes them and adjusts the capacity alloca-tion every 60 s. We note that this represents much expedited set-tings, as these intervals can be much longer in real-world sys-tems. With this setting, we are not only able to accelerate our experiments that emulate real-world streaming over a long pe-riod of time, but also to demonstrate the speed and efficiency of our algorithm even when it is executed in very short timescales.
A. Performance of Ration Components
We first examine the effectiveness of each composing algo-rithm in Ration. In this set of experiments, we focus on the streaming inside one ISP, with one server of 80 Mb/s upload capacity and five channels. We use the peer number statistics of five channels from the traces,CCTV1,CCTV4,CCTV2,CCTV7, andCCTV12, in one ISP (ChinaTelecom) during the week of February 13–19, 2007.5 The five channels have a regular in-stantaneous number of peers at the scale of 2000, 500, 400, 150, and 100, respectively. The statistics of CCTV1 and CCTV4 also captured the flash crowd scenario on February 17, when the Chinese New Year celebration show was broadcast on the two channels.
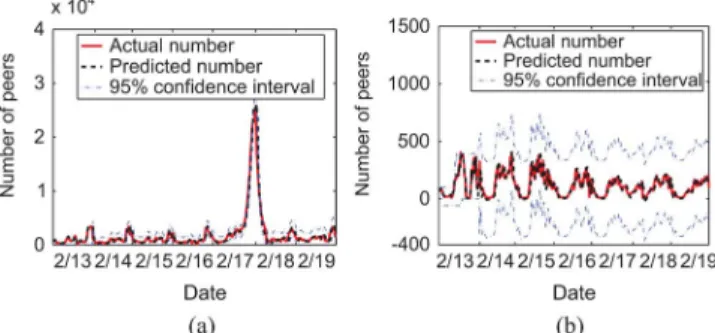
1) Prediction of the Number of Peers: Fig. 6 presents the re-sults of prediction with for the popular channel CCTV1 and the less popular channel CCTV12, respectively. In the dynamic prediction, the training set size is and the error count parameters are and . The pre-dicted numbers for both channels largely coincide with the actu-ally collected number of peers, both at regular times and during the flash crowd, no matter whether the prediction confidence in-terval is large or small at different times. This validates the cor-rectness of our model identification, as well as the accuracy of our dynamic prediction.
2) Dynamic Streaming Quality Function: Fig. 7(a) plots the derived parameter values for the dynamic streaming quality function of CCTV1. In the dynamic regression, the training set size is , and the error count parameters are and . We see that is all positive, the values of are 5To expedite our experiments, each peer number time series from the traces is sampled such that the evolution of the P2P system in each day is emulated within half an hour.
Fig. 6. Prediction of the number of peers withARIMA(0; 2; 1). (a) CCTV1. (b) CCTV12.
Fig. 7. Dynamic learning of the streaming quality function for CCTV1. (a) Evolution of parameter values. (b) Measured streaming quality versus prediction.
always within the range of 0-1, and may be positive or neg-ative at different times. We have observed similar results with the derived streaming quality functions of other channels. This validates our analysis in the last paragraph of Section III-C. During the flash crowd scenario, which hereinafter is marked with a vertical line in the figures, is significantly below zero, revealing a negative impact on the streaming quality with a rapidly increasing number of peers in the channel.
Fig. 7(b) plots the actually measured streaming quality in the channel against its estimated value, calculated with the derived streaming quality function at each time. The actual streaming quality closely follows the predicted trajectory at most times, including the flash crowd scenario, which exhibits the effective-ness of our dynamic regression.
3) Optimal Provisioning Among all Channels: We now in-vestigate the optimal server capacity provisioned to different channels over time. In this experiment, we focus on examining the effects of channel popularity on capacity allocation and set the priorities for all five channels to the same value of 1.
Fig. 8(a) and (b) shows the server capacity allocated to each of the five channels and their actually achieved streaming quality at different times. We observe that, generally speaking, the higher the channel’s popularity is, the more server capacity it is as-signed. This can be explained by the marginal utility of the channels used in the water-filling allocation ofRation,
. As is observed in our previous experiment, the marginal utility is positively correlated with the number of peers, and thus the more popular channel is assigned more server capacity.
On the other hand, in Fig. 8(b), we do not observe evident correlation between the channel popularity and its achieved streaming quality, as the latter is decided by both allocated
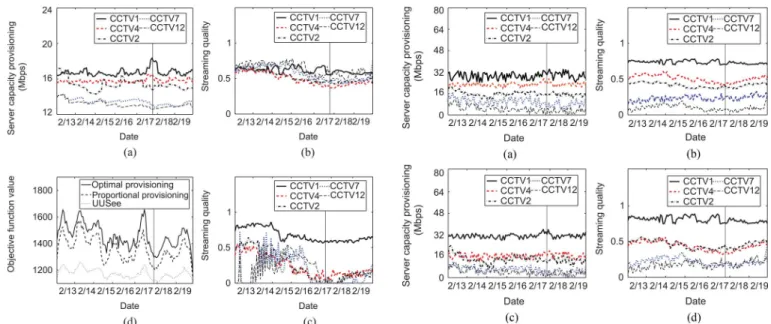
Fig. 8. Server capacity provisioning for five nonprioritized channels. (a) Server capacity provisioning withRation. (b) Streaming quality achieved withRation. (c) Streaming quality achieved with proportional allocation. (d) Comparison of objective function values.
server capacity (positively) and the number of peers (positively or negatively at different times). Nevertheless, we show that our water-filling assignment achieves the best utilization of the limited overall server capacity at all times, with a comparison study to a proportional allocation approach.
The proportional allocation approach implements the same protocol as employed in UUSee, except for its server capacity allocation, which goes as follows: At each time , the server ca-pacity is proportionally allocated to the channels, based only on their predicted number of peers for time . Fig. 8(c) shows that the most popular channel, CCTV1, achieves better streaming quality with this proportional allocation as compared to that in Fig. 8(b) at the price of downgraded quality for the other channels, especially during the flash crowd. This is be-cause CCTV1 now obtains more than half of the total server capacity at regular times and almost all during the flash crowd scenario.
With the streaming quality results in Fig. 8(b) and (c), we compute the values of the objective function of
in (1) and plot them in Fig. 8(d). Given the same priority for all the channels, the value of the objective function at each time represents the total number of peers in all the channels that achieve satisfying buffering level at the time. The values from the proportional allocation are consistently lower than those achieved with our water-filling approach, exhibiting the opti-mality of the server capacity utilization withRation.
In our experiments, we have also compared Ration with the original UUSee protocol, in which no allocation across channels is done at all. We have observed more unstable and lower streaming qualities in all the channels than those shown in Figs. 8(b) and 8(c) and lower objective function values than those achieved by the proportional provisioning approach, as shown in Fig. 8(d).
4) Effectiveness of Channel Prioritization: In the next ex-periment, we study the effect of channel prioritization on server
Fig. 9. Server capacity provisioning for five prioritized channels withRation. (a), (b) Five streaming quality levels. (c), (d) Three streaming quality levels.
capacity provisioning with Ration. We investigate two cases. 1) We wish to achieve differentiated streaming qualities across all five channels, with
. 2) We wish to achieve three streaming quality levels,
with . We set the
following channel priority levels in the two cases, respectively:
1) , , , ,
; and 2) , ,
, , . These priority values are
derived based on (11) in Section VI to guarantee the targeted streaming quality differentiation, using the popularity, , , and derived for respective channels. The experimental re-sults are plotted in Fig. 9.
Comparing Fig. 9(a) and (c) to Fig. 8(a), we observe fur-ther differentiated server capacities among the channels, where the channels with higher priority and popularity are allocated more capacity. In Fig. 9(b) and (d), we observe differentiated streaming quality levels across the channels, which meet our expectations: We can observe five different streaming quality levels in Fig. 9(b) and 3 in Fig. 9(d). These demonstrate the ef-fectiveness of channel prioritization inRation, which facilitates the streaming solution provider to differentiate services across channels, when the supply–demand relation of server capacity is tight in the system.
B. Effectiveness of ISP-Aware Server Capacity Provisioning
Next, we evaluateRationin multi-ISP streaming scenarios. Four ISPs are emulated by tagging servers and peers with their ISP IDs. Again, five channels (CCTV1,CCTV4,CCTV2,
CCTV7, and CCTV12) are deployed in the ISPs, with peer number statistics in each ISP extracted from those in four China ISPs (Telecom, Netcom, Unicom, and Tietong) from the traces. While a fixed overall server capacity is used in the previous experiments, in the following experiments, we do not cap the server capacity, but derive with Ration the minimal amount of overall server capacity needed to achieve the best streaming qualities for all the channels in the system (i.e.,
Fig. 10. P2P live streaming for five channels in four ISPs: without ISP aware-ness. (a) Evolution of overall server capacity. (b) Evolution of total inter-ISP P2P traffic.
Fig. 11. P2P live streaming for 5 channels in 4 ISPs: with full ISP awareness.
), which is referred to as hereinafter. At each time during the dynamic provisioning, is derived by summing up the upper bound of server capacity required for each of the channels, , as given in (9), at the time. Our focus is to compare the total server capacity required when ISP awareness is in place and not and the inter-ISP traffic that is caused. The channels are not prioritized in this set of experiments.
1) Without ISP Awareness: In the first experiment, we deploy one server in the system and stream with a peer selection pro-tocol that is not ISP-aware, i.e., each peer is assigned partners that can be any other peers in the entire network. The overall server capacity used on the server over time is shown in Fig. 10(a) and the total inter-ISP P2P traffic in the system is plotted in Fig. 10(b).
2) With Full ISP Awareness: In the second experiment, we deploy one server in each ISP and constrain all streaming traffic inside each ISP by fully ISP-aware peer selection, i.e., peers are only assigned partners inside the ISP. There is no inter-ISP traffic in this case. The server capacity used on the server in each ISP is illustrated with the area plot in Fig. 11. Comparing Fig. 11 to Fig. 10(a), we can see that more overall server capacity is needed in the system when the traffic is completely restricted in-side each ISP with per-ISP server capacity deployment, as peers now have fewer choices of supplying neighbors and may have to resort more to the server in their respective ISPs. However, the increase in the total server capacity usage is nonsignificant. The difference is only larger during the flash crowd, when it be-comes very difficult for peers to identify enough supplying peers with available bandwidth inside the ISP.
3) Tradeoff Between Server Capacity and Inter-ISP Traffic:
In the final experiment, we provision a total server capacity in the system that is between the amount used in Section V-B1 and that used in Section V-B2and examine the resulting inter-ISP
Fig. 12. Server capacity provisioning versus inter-ISP traffic: a tradeoff. traffic. Specifically, let the overall server capacity usage shown in Fig. 10(a) be , and that shown in Fig. 11 be . We reduce the server capacity provisioned on each server in each ISP, such that the overall server capacity at each time is at the
value of at the time. In this case,
peers are allowed to connect to servers/peers across ISPs if they fail to acquire sufficient streaming bandwidth within the ISP.
The experiment is repeated by setting to , , , or 0, which represent different levels of the total server capacity. The re-sults in Fig. 12 show an increase of inter-ISP traffic with the de-crease of server capacity provisioning. Further comparing the case in Fig. 12 to Fig. 10(b), we observe that while the total server capacity is the same in both cases, a smaller amount of inter-ISP P2P traffic is involved with the ISP-aware peer selection than without any ISP awareness.
VI. RELATEDWORK
With the successful Internet deployment of mesh-based P2P live streaming systems [2]–[4], [14], significant research efforts have been devoted to their measurements and improvements. With respect to measurements, existing studies [15]–[20] mostly focus on the behavior of peers, with little attention devoted to the streaming servers, which nevertheless contribute significantly to the stability of P2P live streaming.
Since the seminal work of Coolstreaming [14], various improvements of peer strategies in such mesh-based P2P live streaming have been proposed, e.g., the enhancement of the block pulling mechanism [21], the optimization of peer con-nectivity for content swarming [22], and the exploration of interoverlay cooperation [23]. To the best of our knowledge, this paper presents the first detailed measurements of server capacity utilization in a live P2P streaming system and the first online server capacity provisioning mechanism to address the dynamic demand in multiple concurrent channels. A prelimi-nary report of this work appeared in [24]. This paper represents a substantial revision and extension, with solid studies of the UUSee server capacity utilization over a longer trace period and complete discussions on the design, analysis, and application of the online server capacity provisioning algorithm.
With respect to analytical work related to the subject of server capacity, Daset al.[25] have shown, with a fluid model, the ef-fects of server upload capacities on the average peer download time in BitTorrent-like P2P file sharing applications. Also based on fluid theory, Kumaret al.[10] modeled streaming quality in a mesh-based P2P streaming system in terms of both server and peer upload capacities. Compared to these studies, our work fo-cuses entirely on thepracticalityof a dynamic server capacity
provisioning mechanism. Other than using simplified modeling assumptions such as Poisson arrivals, we employ time series forecasting techniques to derive the evolution of the number of peers and use dynamic regression approaches to learn the relation among the streaming quality, server capacity, and the number of peers at different times.
There have recently emerged a number of discussions on the large amount of inter-ISP traffic brought by P2P applications, with respect to BitTorrent file sharing [26], [27], P2P Video on Demand [5], and P2P software update distribution [28]. Ap-proaches for the localization of P2P traffic inside ISP boundaries have been proposed, which mostly focus on ISP-aware peer se-lection strategies [27], [29] and [30]. In contrast, our study is the first to investigate the impact and evolution of inter-ISP P2P live streaming traffic, and our proposal emphasizes the dynamic provisioning at the server side on a per-ISP basis to maximally guarantee the success of ISP-aware P2P streaming.
VII. CONCLUDINGREMARKS
This paper focuses on dynamic server capacity provisioning in multi-ISP multichannel P2P live streaming systems. In prac-tice, we believe that it is important to refocus our attention on dedicated streaming servers. Based on our detailed analysis of 10 months worth of traces from a large-scale P2P streaming system, available server capacities are not able to keep up with the increasing demand in such real-world commercial systems, leading to a downgrade of peer streaming quality. Emphasizing practicality, our proposed algorithm,Ration, is able to dynami-cally predict the demand in each channel using an array of dy-namic learning techniques and to proactively provision optimal server capacities across different channels. With full ISP aware-ness,Rationis carried out on a per-ISP basis and is able to guide the deployment of server capacities and channels in each ISP to maximally constrain P2P traffic inside ISP boundaries. Our per-formance evaluation ofRationis highlighted with the replay of real-world streaming traffic from our traces. We show that Ra-tionlives up to our expectations to effectively provision server capacities according to the demand and channel priority over time.
APPENDIXA PROOF OFTHEOREM1
Proof: Let , be an optimal solution to the op-timization problem in (7). Introducing Lagrangian multiplier for the constraint in (8), for the constraints in (9), and for the constraints in (10), we obtain the KKT conditions for the problem as follows[31, p. 244]:
(12) (13) (14) (15) (16) (17) (18)
For , we have from (16) and then
from (18). Therefore, if we further have ,
we derive from (17) and then . As
, and , we can derive,
if if
(19) Notice that for all the channels with , we have , which is the final water level for those bins whose maximal heights are not achieved, as illustrated in Fig. 5(c).6We also notice that is the max-imal height for bin . Therefore, the key to derive is to derive the optimal water level . If a bin’s maximal height is below the optimal water level, the optimal server capacity share for the corresponding channel is its maximal server capacity re-quirement, i.e., . Otherwise, its allocated server
capacity is what achieves .
To derive the optimal water level, from the starting water levels in the bins decided by the server capacity assignment at time , we first make sure the overall server capacity at the amount of is maximally filled into the bins, while no bin’s maximal height is exceeded. Then, we decrease the high water levels by decreasing the server capacity assigned to the corre-sponding bins (as , decreases with the de-crease of ) and increase the low water levels by increasing the server capacity assigned to the corresponding bins, while guaranteeing the maximal height of each bin is never exceeded. When all bins reach the same water level, except those whose maximal heights have been reached, we have derived the op-timal server capacity allocation for all channels for time , as given in (19).
APPENDIXB PROOF OFTHEOREM2
Proof: Both the incremental water-filling algorithm in Table II and the proof of Theorem 1 in Appendix A show that at optimality, the marginal utility for any channels that are not allocated their maximum server capacity requirement
(i.e., ) is the same, i.e., ,
where and .
Since and
, we have
(20) 6Note thats = 0only occurs at very special cases, such asn 0! 0or
0! 0. In this case, the width of the bin corresponding to channelcis zero, and thus no water (bandwidth) will be assigned to the bin. We omit this special case in our discussions.
From , we derive
. Substituting with this formula in (20), we can obtain
(21)
A transformation of (21) will give (11). REFERENCES
[1] J. Liu, S. G. Rao, B. Li, and H. Zhang, “Opportunities and challenges of peer-to-peer Internet video broadcast,”Proc. IEEE, vol. 96, no. 1, pp. 11–24, Jan. 2007.
[2] “PPLive,” Huazhong Univ. Sci. Technol., Wuhan, China [Online]. Available: http://www.pplive.com/
[3] “UUSee,” UUSee, Inc., Beijing, China [Online]. Available: http://www.uusee.com/
[4] “PPStream,” [Online]. Available: http://www.ppstream.com/ [5] C. Huang, J. Li, and K. W. Ross, “Can Internet video-on-demand be
profitable?,” inProc. ACM SIGCOMM, Aug. 2007, pp. 133–144. [6] C. Wu, B. Li, and S. Zhao, “Exploring large-scale peer-to-peer live
streaming topologies,”Trans. Multimedia Comput., Commun. Appl., vol. 4, no. 3, Aug. 2008, Article no. 19.
[7] C. Wu, B. Li, and S. Zhao, “Characterizing peer-to-peer streaming flows,”IEEE J. Sel. Areas Commun., vol. 25, no. 9, pp. 1612–1626, Dec. 2007.
[8] “Cymru Whois service,” Team Cymru, Burr Ridge, IL [Online]. Avail-able: http://www.cymru.com/BGP/asnlookup.html
[9] “Cernet BGP view,” 2009 [Online]. Available: http://bgpview.6test. edu.cn/bgpview/curana/ipv4cn/chinaasnlist.shtml
[10] R. Kumar, Y. Liu, and K. W. Ross, “Stochastic fluid theory for P2P streaming systems,” inProc. IEEE INFOCOM, May 2007, pp. 919–927.
[11] G. E. P. Box, G. M. Jenkins, and G. C. Reinsel, Time Series Analysis: Forecasting and Control, 3rd ed. Upper Saddle River, NJ: Prentice-Hall, 1994.
[12] D. C. Montgomery, E. A. Peck, and G. G. Vining, Introduction to Linear Regression Analysis, 3rd ed. New York: Wiley, 2001. [13] M. Wang, H. Shojania, and B. Li, “Crystal: An emulation framework
for practical peer-to-peer multimedia streaming systems,” inProc. 28th ICDCS, Jun. 2008, pp. 833–840.
[14] X. Zhang, J. Liu, B. Li, and T. P. Yum, “Coolstreaming/DONet: A data-driven overlay network for live media streaming,” inProc. IEEE INFOCOM, Mar. 2005, vol. 3, pp. 2102–2111.
[15] X. Hei, C. Liang, J. Liang, Y. Liu, and K. W. Ross, “A measurement study of a large-scale P2P IPTV system,”IEEE Trans. Multimedia, vol. 9, no. 8, pp. 1672–1687, Dec. 2007.
[16] X. Hei, Y. Liu, and K. W. Ross, “Inferring network-wide quality in P2P live streaming systems,”IEEE J. Sel. Areas Commun., vol. 25, no. 9, pp. 1640–1654, Dec. 2007.
[17] A. Ali, A. Mathur, and H. Zhang, “Measurement of commercial peer-to-peer live video streaming,” inProc. Workshop Recent Adv. Peer-to-Peer Streaming, Aug. 2006.
[18] T. Silverston and O. Fourmaux, “Measuring P2P IPTV systems,” in Proc. 17th NOSSDAV, Jun. 2007.
[19] B. Li, S. Xie, G. Y. Keung, J. Liu, I. Stoica, H. Zhang, and X. Zhang, “An empirical study of the Coolstreaming + system,”IEEE J. Sel. Areas Commun., vol. 25, no. 9, pp. 1627–1639, Dec. 2007.
[20] B. Li, Y. Qu, Y. Keung, S. Xie, C. Lin, J. Liu, and X. Zhang, “Inside the new Coolstreaming: Principles, measurements and performance impli-cations,” inProc. IEEE INFOCOM, Apr. 2008, pp. 1031–1039. [21] M. Zhang, J. Luo, L. Zhao, and S. Yang, “A peer-to-peer network for
live media streaming—Using a push–pull approach,” inProc. ACM Multimedia, Nov. 2005, pp. 287–290.
[22] N. Magharei and R. Rejaie, “PRIME: Peer-to-peer Receiver-drIven MEsh-based streaming,” inProc. IEEE INFOCOM, May 2007, pp. 1415–1423.
[23] X. Liao, H. Jin, Y. Liu, L. M. Ni, and D. Deng, “AnySee: Peer-to-Peer live streaming,” inProc. IEEE INFOCOM, Mar. 2006, pp. 1–10.
[24] C. Wu, B. Li, and S. Zhao, “Multi-channel live P2P streaming: Refocusing on servers,” inProc. IEEE INFOCOM, Apr. 2008, pp. 1355–1363.
[25] S. Das, S. Tewari, and L. Kleinrock, “The case for servers in a peer-to-peer world,” inProc. IEEE ICC, Jun. 2006, vol. 1, pp. 331–336. [26] T. Karagiannis, P. Rodriguez, and K. Papagiannaki, “Should Internet
service providers fear peer-assisted content distribution?,” inProc. ACM IMC, Oct. 2005, p. 6.
[27] R. Bindal, P. Cao, W. Chan, J. Medval, G. Suwala, T. Bates, and A. Zhang, “Improving traffic locality in BitTorrent via biased neighbor selection,” inProc. 26th IEEE ICDCS, Jul. 2006, p. 66.
[28] C. Gkantsidis, T. Karagiannis, P. Rodriguez, and M. Vojnovic, “Planet scale software updates,” inProc. ACM SIGCOMM, Sep. 2006, pp. 423–434.
[29] V. Aggarwal, A. Feldmann, and C. Scheideler, “Can ISPs and P2P sys-tems cooperate for improved performance?,”Comput. Commun. Rev., vol. 37, no. 3, pp. 29–40, Jul. 2007.
[30] H. Xie, Y. R. Yang, A. Krishnamurthy, Y. Liu, and A. Silberschatz, “P4P: Provider portal for applications,” inProc. ACM SIGCOMM, Aug. 2008, pp. 351–362.
[31] S. Boyd and L. Vandenberghe, Convex Optimization. Cambridge, U.K.: Cambridge Univ. Press, 2004.
Chuan Wu(M’08) received the B.Engr. and M.Engr. degrees in computer science from Tsinghua Univer-sity, Beijing, China, in 2000 and 2002, respectively, and the Ph.D. degree in electrical and computer engi-neering from the Department of Electrical and Com-puter Engineering, University of Toronto, Canada, in 2008.
She is currently an Assistant Professor with the Department of Computer Science, The University of Hong Kong, Hong Kong, China. Her research inter-ests include measurement, modeling, and optimiza-tion of large-scale peer-to-peer systems and online/mobile social networks.
Dr. Wu is a member of the Association for Computing Machinery (ACM).
Baochun Li(M’00–SM’05) received the B.Engr. de-gree in computer science and technology from Ts-inghua University, Beijing, China, in 1995, and the M.S. and Ph.D. degrees in computer science from the University of Illinois at Urbana–Champaign in 1997 and 2000, respectively.
Since 2000, he has been with the Department of Electrical and Computer Engineering, University of Toronto, Toronto, ON, Canada, where he is currently a Professor. He has held the Nortel Networks Junior Chair in Network Architecture and Services from Oc-tober 2003 to June 2005 and the Bell University Laboratories Endowed Chair in Computer Engineering since August 2005. His research interests include large-scale multimedia systems, cloud computing, peer-to-peer networks, ap-plications of network coding, and wireless networks.
Dr. Li is a member of the Association for Computing Machinery (ACM). He was the recipient of the IEEE Communications Society Leonard G. Abraham Award in the Field of Communications Systems in 2000. In 2009, he was a recipient of the Multimedia Communications Best Paper Award from the IEEE Communications Society and a recipient of the University of Toronto McLean Award.
Shuqiao Zhao received the B.Engr. degree in computer science from Shandong University, Jinan, China, in 2001.
He is currently the Managing Director of the Mul-timedia Development Group, UUSee, Inc., Beijing, China, where he is in charge of the development of the core techniques of UUSee’s peer-to-peer live streaming solution.