Procedia - Social and Behavioral Sciences 190 ( 2015 ) 211 – 219
ScienceDirect
1877-0428 © 2015 The Authors. Published by Elsevier Ltd. This is an open access article under the CC BY-NC-ND license (http://creativecommons.org/licenses/by-nc-nd/4.0/).
Peer-review under responsibility of Academic World Research and Education Center. doi: 10.1016/j.sbspro.2015.04.937
2nd GLOBAL CONFERENCE on PSYCHOLOGY RESEARCHES, 28-29, November 2014
Gender Stereotypes, Performance and Identification with Math
Irena Smetackova
a*aDepartment of Psychology, Faculty of Education, Charles University, Prague, Czech Republic
Abstract
Previous research has showed that school achievements depend on students´ motivation and identification (Zimmerman, 2000).
There are some differences between girls and boys beliefs about mathematics (Gallagher & Kaufman, 2005). We still do not have enough information about relations between identification and gender beliefs and about the impact of those two areas on real knowledge. The paper presents new research on academic achievements and attitudes of girls and boys in mathematics. The basic aim is to test whether there is a correlation between mathematical knowledge/performance, identification with mathematics and gender schemas. The study involved 436 boys and girls who were divided into two age groups – 10 or 11 years old and 14 or 15 years old. Data were collected using a questionnaire focusing both on identification with math, and on gender schemas. The second source of data was a didactic test with 10 or 12 math items from TIMSS. In all three areas (identification with math, gender schemas, didactic test), average scores were calculated. Correlations between scores were identified. Differences concerning gender and age were examined. Results show that boys and girls reach similar test scores and have similar identification with math. Gender beliefs about mathematics were pretty strong and got stronger for boys and the older group. As children get older, differences between boys and girls increase as does heterogeneity within each group. However, the relationship between performance, beliefs and identification is low, except for the group of older boys. The paper discusses some more results and recommendations for math schooling from psychological perspective.
© 2015 The Authors. Published by Elsevier Ltd.
Peer-review under responsibility of Academic World Education and Research Center.
Keywords: gender, math, self-efficacy, identifiacion, gender stereotype, gender schema
1.Introduction
Here introduce the paper, and put a nomenclature if necessary, in a box with the same font size as the rest of the paper. The paragraphs continue from here and are only separated by headings, subheadings, images and formulae. The section headings are arranged by numbers, bold and 10 pt. Here follows further instructions for authors.
* Irena Smetackova. Tel.: +420-221900519, E-mail address: [email protected]
This paper was supported in part by the Czech Science Foundation, grant number P407/11/1740 and P407/11/1556. © 2015 The Authors. Published by Elsevier Ltd. This is an open access article under the CC BY-NC-ND license (http://creativecommons.org/licenses/by-nc-nd/4.0/).
Representation of women and men in different fields of labor market and educational system differs. In most countries, there are significantly lower numbers of women in technical fields than men. In the Czech Republic, women make up about 35 % of all students in natural sciences, mathematics and information technology field. They make up only about 25 % of students in engineering, industry and construction fields. People who lack gender knowledge usually think that this is because women are less talented when it comes to mathematics or engineering which in turn translated to their lower interest in these fields. While psychology provides strong evidence for the later hypothesis, it does not support the former one.
Psychology research shows that mathematical abilities of women and men are practically the same in total amount (Hyde, 2005). However at the same time, there is a gender gap in abilities for specific fields of mathematics. We can divide mathematical skills roughly in two groups – quantitative/calculation and visual-spatial (Halpern et al., 2005). Girls and boys do not differ with respect to the calculation abilities and latest metanalyses of existing studies do not show differences in their average results, which would stem from a different structure of cognitive predispositions of girls and boys (Lindberg et al., 2010). However, there are gender differences in visual-spatial skills, even though they are gradually disappearing1. From the developmental point of view, differences in spatial imagination appear in the pre-school age and they deepen with age. Nevertheless, there is also evidence that they can be lowered by training, especially for girls (Halpern et al., 2005). In other words, it seems that visual-spatial skills also cannot be attributed to different inborn predispositions of boys and girls.
Even though average mathematical skills of boys and girls seem to converge2, variance of skills within the two groups is still different and remains the same (Wai, Putallaz & Makel, 2012). In the US population, 7.80 % of Caucasian boys score above 95.performance percentile, but only 5.38 % of Caucasian girls. We find 1.85 % boys above 99.percentile, but only 0.90 % women, i.e. twice as few (Hyde et al., 2005).
Since it is problematic to attribute these results to nature (inborn predispositions) literature, which tries to explain differences in variance and in real choices of learning and job trajectories, turns our attention from cognitive predispositions to identification with mathematics and to the structure of motivations to learn mathematics (e.g.. Keller, 2007, Gallagher & Kaufman, 2005). It turns out that boys tend to be more motivated to learn mathematics and they are more self-confident in this area than girls (Else-Quest et al., 2010). Research focused on ideas about mathematics and their association with gender shows that children consider mathematics to be a masculine domain already at the start of their school carriers (Cvencek et al., 2011). According to this and other studies, girls are oriented to mathematics less than boys both on the explicit, and the implicit levels.
Another related phenomenon is self-efficacy (Bandura, 1997). Self-efficacy is made up of skills that the individual thinks s/he has and by confidence that s/he can employ them effectively to solve concrete tasks. The level of self-efficacy is more or less independent of real capabilities that the individual has. Rather, it is based on four sources: personal experience with handling the task at hand, mediated experience with the given area, social convincing and somatic and emotional states Bandura, 1994)3. According to Bandura and others, the trust in one’s
own abilities is a precondition for handling difficult tasks. Students with higher self-efficacy approach difficult and taxing tasks with more resolve, they exert more effort, they are more persistent and they experience more positive emotions (Zimmerman, 2000). On the other hand, an absence of self-efficacy results in quitting the task or
insufficient regulation of one’s cognitive, social, emotional and behavioral sub-skills that are necessary for successful finishing of the task. Based on the model of Schmader et al. (2008), we can assume that low self-efficacy
1
Men perform better – regardless of whether they are in 3D or 2D (Collins & Kimura, 1997). Research further shows that men use different sections of brain than women (e.g. Nowak, Resnick, Elkins & Moffat, 2011) and, therefore, also different strategies for solving the tasks. While men activated more the parietal section, women used more the frontal-parietal section. This also supports the hypothesis that men depend more on the gestalt strategy, while women use more the analytical strategy (Nowak et al., 2011).
2
Current data from the Czech Republic confirm the decrease of the gender gap in math-test performance. For example, TIMSS 1999 testing of population of fifteen-year-old pupils placed the Czech Republic within the countries with the highest gender gap in mathematics. However, during the following eight years, boys’ performance plummeted dramatically so that in 2007 gender gap was almost nonexistent. Gender differences remain in the ten-year-old population and they are about the same as they used to be.
3
Pajares (2005) points out that self-efficacy does not follow directly from these sources, but via their interpretations. Individual experiences and information can have specific weight for the individual who attributes a specific meaning to them.
leads to exhaustion of working memory on handling negative feelings connected with the task so that the individual does not have enough working memory for solving the task proper.
The attitude toward mathematics and importance of mathematics for identity of the child form under the influence of parents, peer groups as well as the overall culture. Many studies suggest that parents and teachers expect that boys will be more intelligent when it comes to mathematical-logical and spatial skills (Furnham, Reeves & Budhani, 2000; Beilock, 2010). Other studies show that children from families with gender stereotypical expectations with respect to skills perform differently. Girls whose mothers believed that mathematics is a masculine domain performed worse in mathematics, especially in situations when gender stereotypes were activated (Tomasetto, Alparone & Cadinu, 2011).
Based on the existing research, the following explanatory model would seem probable: A child develops certain idea about mathematics that is influenced by attitudes of its parents, teachers, peers, and that it can be gendered. Subsequently, the child develops different level of identification with mathematics and different level of self-efficacy. They, in turn, influence its performance in mathematics and the level of its math knowledge and skills in the long run. Validity of this explanatory model has not yet been proven unambiguously because the majority of studies focuses only on relationships between two of the three elements (mathematical knowledge/performance, identification with mathematics and gender schemas).
2.Methodology
Many studies examined gender differences in mathematical ability since the 80´s. As was briefly depicted above,
previous research shows that math is associated with many gender stereotypes, which can deter girls from math and lead boys to prefer it. Girls show lower self-confidence, lower interest and lower aspiration in mathematics compare to boys. However, the other studies do not show systematic lower achievements of girls in math, at least not on the level that would corresponds to the low identification with math.
There is some research about different aspects of mathematical achievement, but we do not still understand well how they are connected. When studying math achievements of boys and girls, the following question can be posed: What is the relationship between mathematical performance, identification with mathematics and gender schemas related to mathematics? Considering existing studies, we can also assume that those three aspects will change with age, thus we compare two different age groups.
2.1.Sample
The study included 436 children, who attended grammar schools and lower secondary schools in different regions of the Czech Republic. The sample consists of two age groups – 232 children attended fourth grade of elementary school and 204 children attended eight grade of grammar school or third grade of lower “gymnasium”4. Fourth grade covers children of 10-11 years of age with the average age 10.22 (sd=0.51). Eight grade covers children of 13-16 years of age (wider range is mainly due to higher rate of school failing at adolescence) with the average age 14.12 (sd=0.59)5. The ratio of girls to boys was almost even (see Table 1).
Table 1: Sample
4 The educational system in Czech Republic requires 10 years mandatory schooling. Children start at 6 years at general elementary schools which last five years (ISCED 1). Then they go for the lower secondary education (ISCED 2) which is provided by two types of schools. Children can stay on the same grammar school for next four years or they can move to gymnasium which is general preparatory for higher academic education. The gymnasium consists of lower and higher secondary level.
5 In older group the majority of children were 14 years old (n=145), just 20 children were 13 years old, 34 children were 15 years old and 5 children were 16 years old.
Girls Boys Together
10-11 age 123 109 232
14-15 age 115 89 204
Together 238 198 436
All the children in each age group attended the same grade which means they learnt the same level of math
(despite of slight differences in each school’s curriculum). Grammar schools and lower secondary schools follow the
same curriculum guidelines ensuring that all schools fulfill the same educational objectives. This means that the children were exposed to the same educational framework and approach. Math belongs to the three main subjects, which are highlighted in the general curriculum. This is particularly true in the last few years because both national and international research has showed a huge decline of mathematical skills of the Czech pupils. Grammar schools
and lower “gymnasiums” in the Czech Republic are intended for children between six and fifteen years of age.
2.2. Data collection and analysis
Data were collected using a questionnaire and a didactic test. The questionnaire consisted of four independent parts which covered following topics: a) Mathematics Identification Questionnaire 6 (MIQ), which shows the importance of mathematics for identity, b) gender stereotypes about mathematics, c) school achievements and competences, d) academic self-efficacy7. There were 78 items in the whole questionnaire. We used only multiple-choice answer formats or Lickert´s scales. The time limit for filling up the questionnaire varied between 12 and 22
minutes. The same questionnaire was administered to younger and older pupils. The questionnaire was developed under controlled conditions and a pilot study was run for both age groups. The reliability of the questionnaire is high enough –Cronbach´s Alpha = 0,916.
The didactic test was based on the items from TIMSS – Trends in International Mathematics and Science Study (2007). The test contains 10 items for younger pupils and 12 items for older pupils. For selection of items from TIMSS, two parameters were used: a) general difficulty of the item, which means the ratio of students who
answered it correctly, b) gender gap in item´s difficulty, which means the difference between ratio of girls and ratio of boys who successfully answered the item. With regard to the first parameter, the easy, medium as well as hard items were included in the test. With regard to the second parameter, we mainly used items with the small gender gap. Because national results of TIMSS are publicly available, we could compare our sample to the whole Czech pupil population. The results show that children in our research represent well the whole population.
The data were collected by trained research assistants8. Twelve schools were approached and ten of them agreed. The children filled the questionnaire and the test during one lesson, usually the math lesson. In the beginning, the goal of research was explained and pupils were asked to participate. Of course, the survey was anonymous, so
children did not sign their names. This can be problematic, though, because children’s motivation and achievements
in high-stakes test slightly differ from low-challenging situations. The data provided by the children, who showed an apparent lack of motivation, were excluded right after the testing or later during the data processing. The data were analyzed with help of standard statistical methods, including chi-square test, factor analysis and t-test. In all the analyses, age and gender were key variables.
6
E.g. Josephs et al., 2003 7
For construction of the self-efficacy scale, we used instructions of A. Bandura (2006). We do not discuss this part of questionnaire in this paper. 8 I would like to thank mainly Anna Vozkova and Barbora Ptackova for a great contribution to the research design, instruments and data collection.
3.Results
This chapter presents key results of the study. As was described above, the research focused on three areas –
identification with math, actual performance in math and gender schemas related to math – and relationships among them. Each area will be discussed separately.
3.1. Gender schemas
The questionnaire contained nine statements concerning female and male achievements, abilities and interest in mathematics. Children were asked to indicate the level of their own consent with each statement on a five-point scale (1 = I agree totally, 5 = I disagree totally). The statements were: A) Boys are usually better in math than girls. B) Girls are more diligent and conscientious at school than boys. C) Girls do not have the “right brain cells” for
math, they are not so talented in math. D) Men have better logical thinking than women. E) Women and men differ in their abilities. F) Women are able to take care of young children better than men. G) Technical occupations are more suitable for men than for women. H) Men do better in high positions than women. I) Women and men have similar abilities and can handle the same jobs.
First two points on the scale mean that a child agrees with the statement, third point on the scale presents rather neutral attitude. Counting just first three answers, we can obtain the ratio of pupils whose opinions are in accordance with the statement. The highest rate of approval (about 90 %) was recorded for the statements G, F, E and B. All of them claim that women and men differ with respect to school performance, ability to handle the household and the job, especially in adulthood. Moreover, one of the statements implies that this is due to inherent differences in abilities. We could surmise that the children see the differences though the biological-essentialist lens.
Children expressed the lowest, but still pretty high approval (about 60 %) with statements A, C and D. The common thread in all three statements is that girls/women are not so gifted for math as boys/men. Not as many pupils agree with this opinion compare to the agreement on the general gender differences in performance. It means that the pupils are more critical with respect to the existence of gender gap in dispositions (except of statement E) than with respect to performance. Only the statement I contradicts all the others – it says that men and women do not differ in their abilities and thus, they can succeed in the same areas. More than 80 % of students agreed with the statement.
There seems to be, therefore, a paradox – many students claim that gender differences exist, but at the same time, many students claim that there is no gender gap. How can we explain this? First, correlations between this and other statements were pretty low. The highest correlations were +0.16 (statement B) and -0.14 (statement E), which were statistically significant (p< 0.01), but had no strong ecological validity. It means that the group which agreed that there were gender differences and the group which did not agree with the statement did not overlap completely. We cannot say that majority of children believed in the two contradictory statements at the same time.
Second, children who answered positively on both statements probably worked with specific understanding of gender dynamics. They assumed that gender differences in performance existed, but they did not approve of this. Therefore, they were not convinced that gender gap stems from unalterable dispositions.
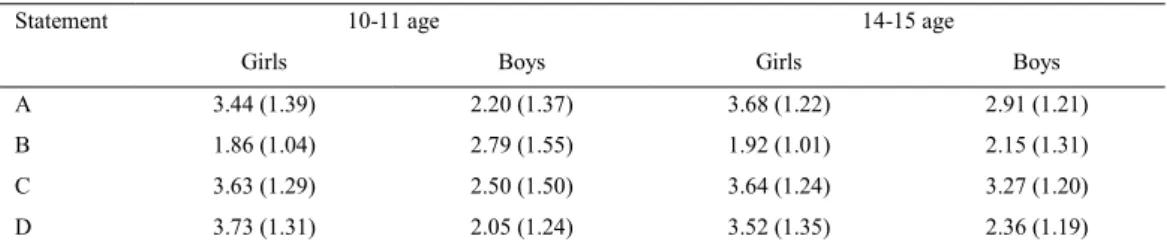
Besides analysis of the total level of agreement or disagreement, we compared answers of girls and boys and the two age groups (see Table 2).
Table 2: Gender schemas of math: the average answer and standard deviation on the five-points scale
Statement 10-11 age 14-15 age
Girls Boys Girls Boys
A 3.44 (1.39) 2.20 (1.37) 3.68 (1.22) 2.91 (1.21)
B 1.86 (1.04) 2.79 (1.55) 1.92 (1.01) 2.15 (1.31)
C 3.63 (1.29) 2.50 (1.50) 3.64 (1.24) 3.27 (1.20)
E 1.91 (1.18) 1.61 (1.08) 2.20 (1.26) 1.81 (1.14)
F 1.37 (0.83) 1.82 (1.22) 1.75 (1.04) 1.83 (1.08)
G 1.57 (0.97) 1.34 (0.82) 1.80 (1.11) 1.35 (0.64)
H 2.91 (1.44) 1.84 (1.15) 2.89 (1.27) 2.14 (1.11)
I 1.97 (1.15) 2.80 (1.51) 2.18 (1.18) 2.41 (1.14)
With respect to age, significant differences were found in statements A, B, C, E and F (p<0.01 or 0.05). In three cases, higher approval in the younger group was established. Older children agreed more often only with the statement B, which refers to the performance, while all the others refer to a gender gap in dispositions and inherent abilities. We can conclude that the younger children stressed the polarization between women and men more than the older children.
If we consider gender and age, significant differences were found in seven of the nine statements. In the younger group, a gender gap was identified in all the statements, except E and G. In the older group, a gender gap was significant only for statements B and F. It seems that as children grow up they become more critical of gender stereotypical beliefs, except beliefs about femininity.
In all the statements with the significant difference between girls´ and boys´ answers, we can see the same pattern concerning the evaluative dimension. Both gender categories always expressed higher approval for the statement that rates their own gender higher than that of the other category. For example, the average answer to the statement
“Boys are usually better in math than girls” rated 2.2 for younger boys, but 3.4 for younger girls, and 2.9 for older boys, but 3.7 for older girls (the higher number, the higher disagreement). Girls’ disapproval with the statement was
stronger than that of the boys. The pattern can be explained by the identity protection. Children need to see their own gender category as good enough to build a positive gender identity as a type of social identity (Tajfel, 2010).
Based on the first eight statements, which show different types of gender stereotypes, we could calculate stereotypical beliefs. The sum of individual answers shows the general measure. The higher the number, the weaker the tendency to gender stereotype. The mean of sums reached 18.35 (sd=5.7) for the younger group and 19.85 (sd=5.23) for the older group. The difference was statistical significant, t(415) = -2,79, p=0.006. We can summarize that younger children agree slightly more with gender stereotypical statements than the older ones.
If age and gender were combined, the means of sums was 20.36 for younger girls, but only 16.06 for younger boys. Similarly, it was 21.35 for older girls, but only 17.88 for older boys. In both age groups the gender difference was statistical significant, t(219) = 6,02, p<0.001 and t(194) = 4,86, p<0.001. We can conclude that boys tended to stereotype more than girls. However, it does not mean necessarily that girls were more open-minded. It may be that an identity threat entered the equation because the majority of statements favored masculinity.
3.2.Mathematical performance
For each age group, a specific didactic test was constructed that respected the curriculum for the given school grade. Both tests were created on the basis of TIMSS, so the results could be compared with the tests performed on the whole Czech TIMSS pupil populations. The test for younger group consisted of 10 items, the test for older group consisted of 12 items. A child could gain 1 point for each item, thus the maximum score was 10, resp. 12.
The average score for the younger group was 5.7 (sd=2.01), which meant success of 57 %. In the older group, the average score was 6.7 (sd=2.94), which meant success of 56 %. No gender gap was found in average scores. For the
younger group, the boys´ mean was 5.7 and the girls´ mean was 5.6. In the older group, boys scored 6.6 and girls scored 6.8. However, it is interesting that we recorded higher standard deviation for the older group – 2.9 compare to 2.0 for younger children. We can conclude that variability in actual mathematical performance of boys and girls is pretty similar regardless of age9.
If we assume that performance represents the real knowledge, the result demonstrates that girls and boys do not differ in their mathematical knowledge. It corresponds to previous research such as Hyde (2005) or Lindberg et al. (2010). However, there was no gender gap in total test scores, but the inner variability within each gender group was pretty high. The standard deviation was bigger in adolescence which means that performance of boys and girls starts to differ as they grow up. The variability among girls was greater than among boys. This result also corresponds to some of the previous studies, e.g. Wai et al. (2012).
Not only the total scores, but also detailed results show no significant gender difference on any item except one. In the younger group, girls solved better the item concerning mathematical expression of real problems in the field of natural numbers. In the older group, girls solved better the item concerning probability. We paid special attention to items concering visuo-spatial abilities which is the only area of mathematics with a proven gender gap (Halpern et al., 2005; Lindberg et al., 2010). There were two such items in the test for the younger group and four such items in test for the older group. Girls and boys had similar levels of success when solving those items and children were pretty successful on all of them, except one in the test for the older group10.
Some previous studies showed that items challenging visuo-spatial skills correlate strongly with the general performance in standardized mathematical tests (e.g. Gallagher & Kaufman 2005;Nutall et al. 2005). Our results do not confirm those findings. The relationship between the global test score and particular items concerning mental rotation and visual-spatial abilities was always highly significant, but it was not higher than the relationship between the score and other items. However, it was evident that the correlation increased for the older group11.
3.3.Identification with mathematics
We used the The Mathematics Identification Questionnaire (MIQ) to find the level of students’ identification
with math. The scale consists of the following five statements: A) My math abilities are very important to me, B) Math abilities are not important to my success in school, C) If I took an IQ test of my math abilities (a test of my natural math abilities, on which studying really would not help) and I did poorly on this test, I would be very
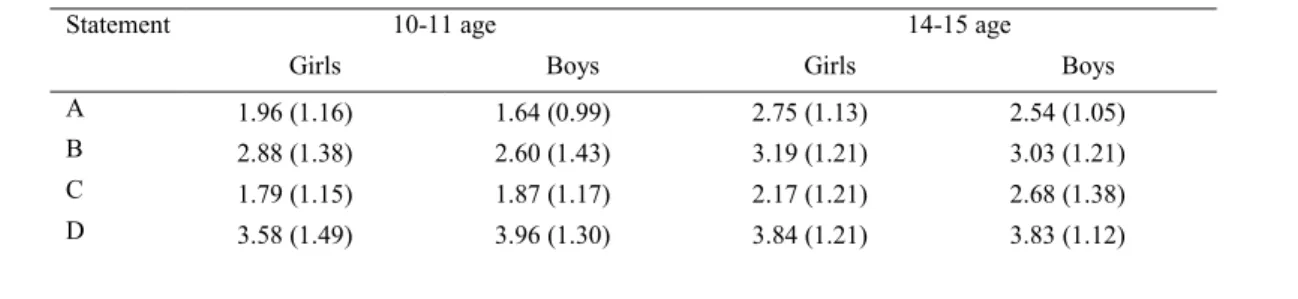
bothered, D) I don’t care at all if other people believe that I am good at math, E) Math abilities will probably be very important to me in my future career. In the original MIQ, students expressed their approval with each statement on nine-point scale from strongly disagree to strongly agree. We used the five-point scale from strongly agree to strongly disagree because in other parts of the questionnaire, the five-point scale was also applied and a different scale would bother students and decrease the data validity. The general level of MIQ was calculated from the sum of each particular statement12. The means of answers are shown in Table 3.
Table 3: Mathematics Identification Questionnaire: The average answer and the standard deviation on the five-points scale
Statement 10-11 age 14-15 age
Girls Boys Girls Boys
A 1.96 (1.16) 1.64 (0.99) 2.75 (1.13) 2.54 (1.05) B 2.88 (1.38) 2.60 (1.43) 3.19 (1.21) 3.03 (1.21) C 1.79 (1.15) 1.87 (1.17) 2.17 (1.21) 2.68 (1.38) D 3.58 (1.49) 3.96 (1.30) 3.84 (1.21) 3.83 (1.12)
test is more likely to favor girls, while negative values indicate the opposite. The value d for test score for the younger group was -0.03 and for the older group it was +0.07.
10
This item required to imagine a 3D object and to know the formula for calculating its volume. Moreover, the item asked for the written answer, not just for picking the correct answer from the list.
11 r=0.51-0.63 in the older group, while r=0.36 till r=0.39 in the younger group. 12
E 2.29 (1.41) 2.03 (1.27) 3.09 (1.19) 2.73 (1.28) Whole 12.44 (3.39) 12.13 (3.42) 15.00 (2.75) 14.72 (2.83)
Based on Table 3, we can conclude that older children disagree more often with all the statements, except D. It means that adolescent identification with mathematics is lower than identification of 10-11 years old children. With regard to gender, there is no significant difference in the general level of identification with math. Gender gap was identified only for two statements in each age group. A significant difference between girls and boys exists only for the statements A and D in the younger group13 and for the statement C and E in the older group14. Those statements claim that girls do not care about their mathematical success so much and as consistently as boys. However, this tendency is not strong enough to result in a difference in the overall level of identification.
4.Discussion
Our research resonates with many findings from other psychological studies on gender (Lindberg et al., 2010;Else-Quest et al., 2010; Gallagher & Kaufmann, 2005; Zimmerman, 2000, etc.). To briefly recap, there are no significant differences between girls and boys when it comes to their performance on mathematical test. Thus, we can assume that their mathematical knowledge is the same. However, variability within both gender categories is relatively high and increases with age, especially among girls. It means that educational success is not determined only by dispositions and abilities, but also other characteristics such as motivation, will and external support, which become more important by age. The belief that mathematics has high importance for individual children decreases
by age. Identification with math and the importance of math for one’s identity decreases between 10th and 15th year
of age. Overall identification of girls and boys with math in total is the same. However, on the closer look, girls do not highlight the importance of mathematical success so much as boys. Girls see mathematics as a relevant field, but success in this field is not as important for their positive identity, especially in adolescence.
Girls and boys also differ in beliefs about mathematics. They see mathematics as an area associated with masculinity. For boys, it can be the source of their positive identity and motivation. Because of identity-defense mechanisms, girls do not agree with such opinions as strongly as boys. However, for many girls and even more boys, stereotypical beliefs about math as masculine field can be a source of different individual approach to mathematics. For boys, it is not necessary to overcome so many barriers, while girls must work harder to build their self-confidence and motivation. We can use the theory of social identity (Tajfel, 2010) and the integrated model of stereotypes impact on performance (Schmader et al., 2008) which help us to understand outlined hypothesis in wider context.
Nevertheless, we identified only weak relationships between test scores, stereotypical beliefs and identification with math. There were no significant correlations among these three areas in any subgroup, except for the older boys. Within the older boy group, we found significant correlation between test scores and stereotypes (r=-0.244) and between test scores and MIQ (r=-0.273). It is not very strong relationship, but still significant (p<0.05). We can interpret the correlation in the following ways: a) the higher the test score, the higher the identification with math, and b) the higher the test score, the higher the stereotypes. It means that for adolescent boys, strong identification with mathematics supports them in test performance and the high performance deepens the identification, personal importance and motivation for mathematics on the other hand. This relationship is understandable and seems to be positive for learning. The other finding means that for adolescent boys, gender stereotypical beliefs about mathematics help them to perform better in math and vice versa. This relationship is not so positive, mainly because it pushes boys to pit girls and boys against each other. Resulting gender dichotomy may discourage girls from
13
t(226) = 2.18, p=0.03, t(226) = -2.03, p=0.04 14
mathematics. Gender stereotypical beliefs and a lack of relationships between test scores and identification with mathematics should be addressed more systematically in psychological research and pedagogical practice.
References
Bandura, A. (1997). Self-efficacy: the exercise of control. New York: W.H. Freeman and Company.
Bandura, A. (2006). Guide for constructing self-efficacy scales. In F. Pajares, & T. C. Urban (eds.), Self-efficacy beliefs of adolescents. (pp. 307-337). Greenwich: IAP - Information Age Publishing.
Beilock, S. L., Gunderson, E. A., Ramirez, G., & Levine, S. C. (2010). Female teachers’ math anxiety affects girls’ math achievement. Proceedings of the National Academy of Sciences, 107(5), 1860-1863.
Collins, D. W., & Kimura, D. (1997). A large sex difference on a two-dimensional mental rotation task. Behavioral neuroscience, 111(4), 845-859.
Cvencek, D., Meltzoff, A. N., & Greenwald, A. G. (2011). Math–gender stereotypes in elementary school children. Child development, 82(3), 766-779.
Else-Quest, N. M., Hyde, J. S., & Linn, M. C. (2010). Cross-national patterns of gender differences in mathematics: a meta-analysis. Psychological bulletin, 136(1), 103.
Furnham, A., Reeves, E., & Budhani, S. (2002). Parents think their sons are brighter than their daughters: Sex differences in parental self-estimations and self-estimations of their children's multiple intelligences. The Journal of genetic psychology, 163(1), 24-39.
Gallagher, A. M., & Kaufman, J. C. (2005). Gender differences in mathematics: An integrative psychological approach. Cambridge University Press.
Halpern, D. F., Benbow, C. P., Geary, D. C., Gur, R. C., Hyde, J. S., & Gernsbacher, M. A. (2007). The science of sex differences in science and mathematics. Psychological science in the public interest, 8(1), 1-51.
Hyde, J. S. (2005). The gender similarities hypothesis. American psychologist, 60 (6), 581-589.
Keller, J. (2007). Stereotype threat in classroom settings: The interactive effect of domain identification, task difficulty and stereotype threat on female students’ maths performance. British Journal of Educational Psychology, 77(2), 323–338.
Lindberg, S. M.,
Lindberg, S. M., Hyde, J. S., Petersen, J. L., & Linn, M. C. (2010). New trends in gender and mathematics performance: a meta-analysis. Psychological bulletin, 136(6), 1123.
Nowak, N. T., & Moffat, S. D. (2011). The relationship between second to fourth digit ratio, spatial cognition, and virtual navigation. Archives of sexual behavior, 40(3), 575-585.
Schmader, T., Johns, M., & Forbes, C. (2008). An integrated process model of stereotype threat effects on performance. Psychological review, 115(2), 336.
Tajfel, H. (ed.) (2010). Social identity and intergroup relations. Cambridge University Press.
Tomasetto, C., Alparone, F. R., & Cadinu, M. (2011). Girls' math performance under stereotype threat: the moderating role of mothers' gender stereotypes. Developmental psychology, 47(4), 943.
Wai, J., Putallaz, M., & Makel, M. C. (2012). Studying Intellectual Outliers Are There Sex Differences, and Are the Smart Getting Smarter?. Current Directions in Psychological Science, 21(6), 382-390.