Evaluating the Effect of Open Student Models
on Self-Assessment
ANTONIJA MITROVIC
Intelligent Computer Tutoring Group
Department of Computer Science and Software Engineering University of Canterbury
Private Bag 4800, Christchurch, New Zealand [email protected]
http://www.cosc.canterbury.ac.nz/tanja.mitrovic/ Phone (64) 3 3642987 ext. 7771
Fax (64) 3 3642569
Abstract. This paper discusses the simple open student models used in two of our constraint-based tutors, SQL-Tutor and KERMIT, and their effects on self-assessment. The systems present a high-level abstraction of the detailed information contained in the student model, in terms of skill meters representing the student’s progress on domain concepts. SQL-Tutor presents the open student model when the student requires it, or when selecting new problems. KERMIT, on the other hand, continuously displays a high-level summary of the student’s progress, while more detailed information is available on request. Our results show that even simple open student models can have important positive effects on learning and students’ meta-cognitive skills. Students appreciated having access to their models, and that they felt this feature contributed to their understanding of the domain. Performance of less able students becomes significantly better than that of their peers of similar abilities without access to their models. We have also seen that open student models can help students learn to select better problems.
Keywords. Open student models, constraint-based tutors, meta-cognitive skills
INTRODUCTION
Constraint-based tutors have been shown to work effectively in a number of domains. We have developed domain models using Constraint-Based Modeling (CBM) for several design tasks, such as SQL (Mitrovic, 1998, 2003; Mitrovic & Ohlsson, 1999), database design (Suraweera & Mitrovic, 2002, 2004) and software analysis and design using UML (Baghaei & Mitrovic, 2005; Baghaei, Mitrovic & Irwin, 2006). We have also built domain models for declarative tasks, such as English/vocabulary skills (Mayo & Mitrovic, 2001; Martin & Mitrovic, 2003), and procedural skills, such as data normalization within relational database design (Mitrovic, 2005; Mitrovic et al, 2004).
These domain models have been used to diagnose students’ submissions, generate long-term student models, and adapt instructional sessions accordingly. The evaluation studies show that our tutors help students acquire domain knowledge and improve problem-solving skills.
However, the goal of intelligent tutoring systems should not be only supporting learning about a particular domain, but also teaching students how to learn effectively and efficiently. To achieve this, educational systems need to monitor students’ meta-cognitive skills, represent them in student models and provide support for further development. In this paper, we describe how constraint-based tutors support students in increasing their self-assessment ability.
Metacognition has been studied in several disciplines, such as Education, Psychology and Artificial Intelligence. It is generally accepted that metacognition includes the processes and activities involved with awareness of, reasoning and reflecting about, and controlling one’s cognitive skills and processes. Metacognition therefore involves thinking about, inspecting and adjusting one’s thinking, problem-solving approaches and learning habits, among others. Self (1995) lists the following metacognitive activities: explaining something to oneself or others, being able to evaluate one’s knowledge, planning, recognizing problems and their characteristics, allocating resources, applying appropriate strategies, monitoring and evaluating one’s problem-solving approach, checking consistency of data etc. Studies show that improved meta-cognitive skills can be taught (Bielaczyc et al., 1993) and result in improved problem solving and better learning (Swanson, 1990). In the last decade, researchers have explored various ways of supporting the development of meta-cognitive skills such as self-explanation (Aleven et al., 1999; Conati & VanLehn, 2000; Bunt, Conati & Muldner, 2004; Mitrovic, 2005), help-seeking skills (Aleven & Koedinger, 2000; Aleven et al., 2004) and reflection (Bull, 1997).
This paper focuses on supporting self-assessment, which is the ability to reflect on one’s knowledge and make an assessment of its scope and quality. We present several studies performed with constraint-based tutors, investigating the effect of open student models on self-assessment. Previous research shows that open student models result in increased opportunities for reflection and therefore better learning (Morales, Pain & Conlon, 2001). We first give an overview of related work involving open student models. We then describe how student models have been opened in SQL-Tutor, and present results of three related studies. Then we present a two-level open student model of KERMIT, and the results of an evaluation study. In both systems, the open student models used were quite simple – they only allowed the student to inspect the abstract representation of their knowledge. However, the results of the evaluation studies performed show that even such simple open models can have important consequences on students learning and meta-cognitive abilities.
RELATED WORK
In recent years many researchers in the area of Artificial Intelligence in Education (AIED) have argued that knowledge-based teaching systems need to provide more information to their users about student modelling and pedagogical decisions based on the generated models. Student models provide the basis for adaptive instruction, but students are very often not aware of the fact that an AIED system collects information about their behaviour. In most cases, students are also not aware of the adaptations the system performs during interaction.
Making information about student models and the related pedagogical decision available to students has several advantages. First, in this manner AIED systems become more open and potentially more user-friendly. Czarowski, Kay and Potts (2005) show that students are capable of scrutinising their models in order to explore the adaptive nature of AIED systems, and are able to understand and control the adaptation. Bull et al. (2005) report the results of a survey and also
observational findings showing that students are interested in knowing about their models, including known concepts and misconceptions.
Second, students can also be actively involved in the modelling process: an AIED system may allow the student to modify the content of his/her student model. It is widely accepted that student modelling is a complex process, and often the generated student models are inaccurate and/or incomplete. By allowing students to modify the content of the student model, the bandwidth is increased and inaccuracy may be reduced.
Third, information about the student model engages the student in thinking about his/her own knowledge, thus involving the student at the meta-cognitive level. The student model is not just a source of knowledge about the student of value to the system, but becomes an important learning resource on its own. Students who engage on the meta-cognitive level achieve significantly better results than students who do not (White, Shimoda & Frederiksen, 1999).
Several AIED systems support opening the student model, but the actual representations used and the manner of interaction differ widely. Some systems only allow the student to inspect the content of the student model, often presented in a very abstract way. Skill meters are one such representation, visualizing students’ knowledge as a set of progress bars, one for each important task or a set of domain concepts. ELM-ART (Brusilovsky, Schwarz & Weber, 1996) and model-tracing tutors (Aleven & Koedinger, 2000) provide access to student models using this approach. Another simple way to represent student knowledge is by using targets with arrows (Brusilovsky & Sosnovsky, 2005), where the colour of the target visualizes the importance of the concept, and the number of arrows estimates student knowledge of the concept. A recent project provides textual representations of student models and additionally haptic student models for students who prefer physical interaction (Bull et al., 2005). The haptic model can be inspected with a force-feedback device, so that the student experiences known concepts as hard, partially known concepts as softer, and misconceptions as soft and sticky. The students found haptic models intuitive and useful for learning and reflection.
In addition to just showing a high-level view of the student model, there are also systems that allow the student to change the model, such as ELM-ART (Brusilovsky, Schwarz & Weber, 1996) and the UM toolkit (Kay, 1995). Even more sophisticated approaches involve the student into negotiations about their models. This process is referred to as open interactive (Dimitrova, Self & Brna, 2001), collaborative (Bull & Brna, 1997), cooperative (Kay, 1995) or participative (Morales, Pain & Conlon, 2001) student modelling. Such approaches use more complex representations based on conceptual graphs (Dimitrova, Self & Brna, 2001), Bayesian networks (Zapata-Rivera & Greer, 2004), tree structures (Kay, 1995), tables (Bull, 1997; Bull & Pain, 1995) and Prolog clauses (Paiva & Self, 1995).
The student model in Mr. Collins (Bull & Pain, 1995; Bull, Brna & Pain, 1995) consists of system’s beliefs induced from the observed behaviour, and the student’s beliefs, which are explicitly specified by the student. For each rule, the system maintains statistics of how the student has used it, and the student also specifies his/her confidence that he/she knows the rule. If the student’s belief is the same or within one level of the system’s belief, the student model is treated as correct. However, if the two beliefs vary significantly, the system asks the student to revisit his/her confidence, and presents recent attempts at the rule with justification of its own belief. The student may disagree with the system, and may need to answer additional questions in order to justify his/her confidence.
TAGUS (Paiva & Self, 1995) is a learner modelling system that allows external agents (the student or an educational system) to inspect and modify the student model. The model is represented as a set of Prolog clauses, which makes communication with the student quite complex. The student can insert new information into the student model, and also can update, delete or revise it. Belief revision techniques are used to maintain the model.
The UM toolkit (Kay, 1995) is a shell for building and inspecting student models. The student and the system maintain their private models, but can also share some information. The student model
contains learner’s preferences, attributes and beliefs. The student may inspect the model, ask for justifications of system’s beliefs and modify them. The toolkit has been used to demonstrate a system that teaches students to use a text editor.
Going even further, Dimitrova (2003) and Zapata-Rivera (2004) replace the traditional problem-solving scenario with a model-building one, where the main task of the student becomes developing the domain model the way they see it. StyLE-OLM (Dimitrova, 2003) is an open learner modelling component of a system for teaching technical terminology in a foreign language. The student model is represented as a conceptual graph. Both the student and the system can question the student model, introduce or withdraw prepositions and justify claims. The system uses the belief modal logic and complex inference mechanism to produce a representation on which both sides agree. A limited study (with seven participants) revealed that more able students are better in reflecting on their knowledge. ViSMod (Zapata-Rivera, 2001; Zapata-Rivera & Greer, 2004) is a similar system that allows the student to create his/her model in terms of a Bayesian network.
Several research projects focus on peer diagnosis as a way to involve students in reflection. PeerSM (Bull & Brna, 1997), PairSM (Bull & Smith, 1997), PhelpS (Greer et al., 1998) and ConceptLab (Zapata-Rivera, 2001) provide collaborative environments where groups of students discuss the content of SM. PeerISM (Bull & Brna, 1999) is an extension of this idea, where an artificial peer monitors the modelling process and advises on conflicting points. I-Help (McCalla et al., 2000) is another system based on peer help, but learner models are distributed over various resources. Every learner in I-Help has his/her own agent, the goal of which is to contact suitable peers and negotiate with their agents about help that is needed. Thus, every agent needs to model his/her own students, but also other students in the system. Finally, a recent project provides mobile open student models as the basis for collaborative learning, allowing students to compare their knowledge, and form collaborative groups (Bull et al., 2005).
The above projects differ in the content of the student model, representation chosen for visualization, the type of interactions (inspection or negotiation) and the mechanism for dealing with conflicts. The area is still just emerging, and only a few evaluation studies have been reported.
OPENING THE STUDENT MODEL IN SQL-TUTOR
SQL-Tutor is our oldest constraint-based tutor (Mitrovic, 1998), which helps university-level students learn SQL, the dominant database query language. For a detailed discussion of the system, see (Mitrovic, 2003); here we present only some of its features. SQL-Tutor consists of an interface, a pedagogical module, which determines the timing and content of pedagogical actions, and a student modeller, which analyzes student answers. The system contains definitions of several databases, and a set of problems and the ideal solutions to them. SQL-Tutor contains no domain module. In order to check the correctness of the student’s solution, SQL-Tutor compares it to the correct solution, using domain knowledge represented in the form of more than 700 constraints. It uses Constraint-Based Modeling (Ohlsson, 1994) to model the domain knowledge and the knowledge of its students. Students have several ways of selecting problems in SQL-Tutor. They may work their way through a series of problems for each database. The other option is a system-selected problem, when the system selects an appropriate problem for the student on the basis of his/her student model.
SQL-Tutor has been evaluated in eleven evaluation studies since 1998, which proved the effectiveness of the system. In this paper, we focus only on studies relevant to this paper, listed in Table 1. For details of other studies, please see (Mitrovic & Ohlsson, 1999; Mitrovic, Martin & Mayo, 2002; Mitrovic, 2003; Mitrovic et al., 2004; Martin & Mitrovic, 2005, 2006). All studies were carried out at the University of Canterbury, with Computer Science students enrolled in database courses. The usage of the system was voluntary. In each study, the students had 4-6 lectures and laboratories before
using the system. SQL-Tutor was demonstrated in a lecture, and the course involved a test on SQL several weeks after the system was introduced. The experiments were set up this way so that the students might use the system over a longer time period. The student’s performance was measured by a pre- and a post-test. Every action performed by a student was logged, and the logs were later analysed.
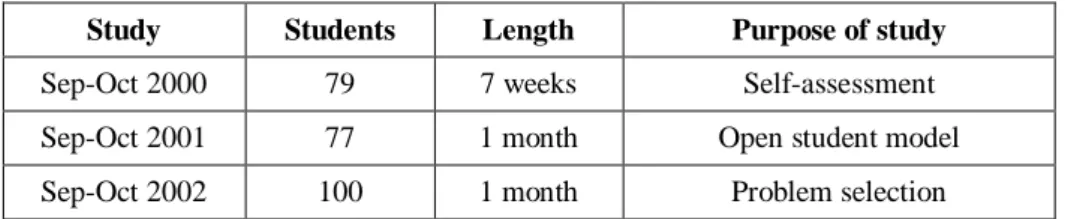
Table 1. Evaluation studies related to opening the student model in SQL-Tutor
Study Students Length Purpose of study
Sep-Oct 2000 79 7 weeks Self-assessment Sep-Oct 2001 77 1 month Open student model Sep-Oct 2002 100 1 month Problem selection
Preliminary Study of Self-Assessment
Assessing one’s own knowledge is a difficult task. A student’s ability to critically assess his/her knowledge is crucial for effective learning. Students should be aware of the extent and quality of their knowledge if they are to improve it. Reasoning about one’s knowledge is also necessary to be able to identify the gaps in the knowledge, and to select appropriate areas that require attention.
In the 2000 study, we focused on students’ self-assessment skills (Mitrovic, 2001). Our hypothesis was that students were not generally good at it, and that students’ knowledge was one of the main factors for self-assessment. In order to evaluate our hypothesis, we performed an experiment with SQL-Tutor, which was modified slightly to allow for data collection. We focused on situations when students abandon the current problem, and ask for a new problem. In such situations, we asked the student to specify the reason for abandoning the problem. Three possible replies were offered: the current problem is too easy, too difficult, or the student wants to work on a problem of a different nature. The student was then asked to specify the type of the next problem. For this purpose, there were seven groups of problems, one for each clause of the SELECT statement (select, from where,
group by, having and order by), plus the any clause option.
Out of 142 students enrolled in the course, 79 logged on to SQL-Tutor and completed the pre-test. We excluded the logs of nine students who attempted no problems (the sample size was therefore n=70). The students had two sessions on average, with a total time on task of 95.6 minutes. The average number of problems attempted per session was 6.65. The students managed to solve 1.5 problems per session, or a total of 10.3 problems. The mean on the pre-test was 4.02 (SD = 1.52) out of the maximum of 7 marks, while the post-test results were better (mean = 5.01, SD = 1.24). The difference between the pre- and post-test results is statistically significant (t = -4.49, p < .001).
There were 25 students who completed all the problems they attempted. The remaining 45 students abandoned at least one, and at most 15 problems, with an average of 3.87 abandoned problems. The total number of abandoned problems for all students was 165. The number of attempts before abandoning the problem ranged from 0 (in 98 cases) to 25, with an average of 2.49 attempts per problem. Therefore, most often (in 59.4% of the cases) the students abandoned the current problem without making any attempts at it.
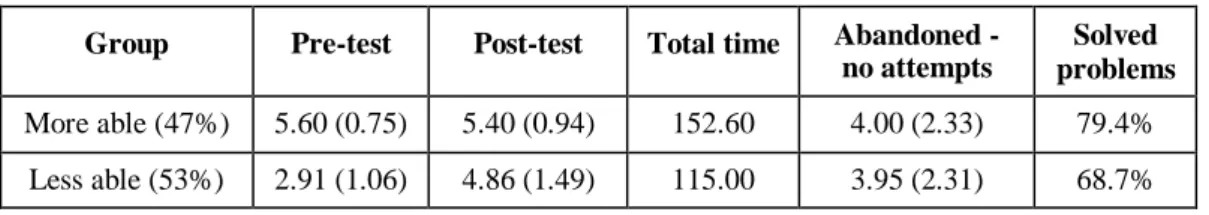
In order to evaluate our hypothesis, we divided 45 students into two subgroups, based on the results of the pre-test. Students who scored above average (i.e., 5, 6 or 7 marks) on the pre-test were put into the more able group, while the students who scored 0 to 4 marks were put into the less able group. The groups were of similar sizes: 47% of students were classified as more able, as shown in
Table 21. The mean of the post-test was lower than the pre-test mean for the more able students, although not significantly. However, there was a drastic improvement in the means for the less able group. Therefore, such students benefited much more from working with the system than their more able peers. More able students tended to work longer with the system. The average numbers of problems abandoned after zero attempts were almost identical (reported in the Abandoned – no
attempts column), but the more able students solved more problems. Out of the total of 165 abandoned
problems, 57 (34.5%) were the problems from the more able group, and 108 (65.5%) were from the less able group. Therefore, less able students were much more likely to abandon a problem.
Table 2. Statistics for the two groups from the 2000 study with different prior knowledge
Group Pre-test Post-test Total time Abandoned -
no attempts
Solved problems More able (47%) 5.60 (0.75) 5.40 (0.94) 152.60 4.00 (2.33) 79.4%
Less able (53%) 2.91 (1.06) 4.86 (1.49) 115.00 3.95 (2.31) 68.7%
Table 3 illustrates the outcomes on the problem after the current problem is abandoned with no attempts on it. The more able students were more successful at solving the next problem (the Success column), and less likely to ask for yet another problem (the Abandoned column). The rate of failure at the next problem was higher for the more able group, but close inspection of the logs revealed that more able students tended to work on more complex problems than the students in the other group.
Table 3. The outcomes on the next problem
Group Success Failure Abandoned
More able 38.9% 11.1% 50% Less able 35.5% 6.4% 58%
We also analysed the answers to the first question asked (What is the reason for abandoning the
current problem?). The distribution of answers to this question is given in Figure 1 (please note that
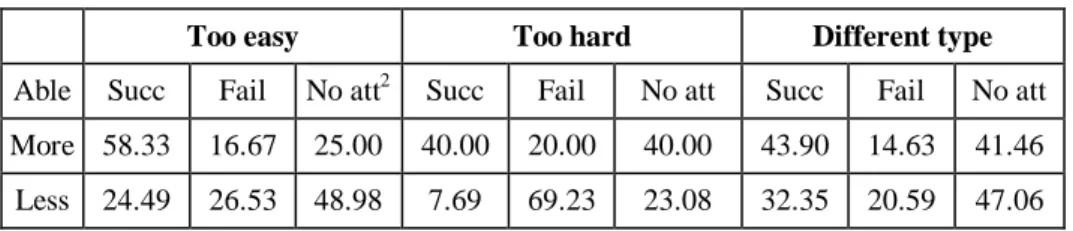
the y axis represents the percentage of students who provided a specific answer). Less able students thought that the problem was too easy more often than more able students, although the inspection of the sessions very often contradicts the reason they specified. More able students asked for a different type of problems more frequently. Table 4 gives percentages of outcomes on the next problem following a specific answer to question 1. For each possible answer, the more able group was more likely to solve the next problem and less likely to fail at it than the less able group.
1
Standard deviations are given in parentheses following the means.
0 10 20 30 40 50 60
Easy Hard Different
More able Less able
Table 4. Outcomes following a particular answer to question 1
Too easy Too hard Different type
Able Succ Fail No att2 Succ Fail No att Succ Fail No att More 58.33 16.67 25.00 40.00 20.00 40.00 43.90 14.63 41.46 Less 24.49 26.53 48.98 7.69 69.23 23.08 32.35 20.59 47.06
An analysis of the second question (What kind of problem would the student like to work on next?) showed that more able students were better at identifying the types of problems they needed to work on. Figure 2 shows the distribution of answers for the two groups. As we hypothesized, less able students were not good at identifying the kind of problem to work next, and therefore they specified
any clause most often (in 69.4% of the cases). More able students asked for hard problems (group by
and having) much more often than the other group (35.1% and 14% compared to 15.7% and 6.5%). We concluded that more able students were better at assessing their own knowledge and selecting appropriate problems. These students are much better at specifying the reason for abandoning a problem, and also better at selecting the type of problem to work on next and completing that problem. This finding is consistent with other published research (Person et al., 1994; VanLehn et al., 2005).
The Effect of Opening the Student Model in SQL-Tutor
As discussed in the previous section, students need to be able to critically assess their knowledge in order to decide what they need to study. The same skill is also important for students to assess the difficulty of the problem they are working on, and to decide whether to abandon the problem or keep working on it.
In the 2001 study (Mitrovic & Martin, 2002), we were interested in using open student models as a way to support self-assessment skills. Similar to the 2000 study, we focused on situations when students abandon the current problem and ask for a new one. In such cases, the students were asked the same two questions from the 2000 study: to specify the reason for abandoning the current problem (too easy, too difficult, or I want a different type of a problem), and to specify the type of the problem they would like to work on next (select, from where, group by, having, order by or any clause). The students were randomly assigned to control and experimental groups. The only difference between the two different versions of SQL-Tutor was in problem selection. The control group got a problem focusing on the clause they selected. For the experimental group, if the student’s selection of the problem type was different from the one suggested by the system, the student was shown the open model, and asked whether they wanted to continue with the type of problem they specified or switch to the type of problem suggested by SQL-Tutor.
2
No att means that the student has not tried to solve the problem at all. 0 10 20 30 40 50 60 70
select from where group having order any More able Less able Fig. 2. Percentages of answers to question 2
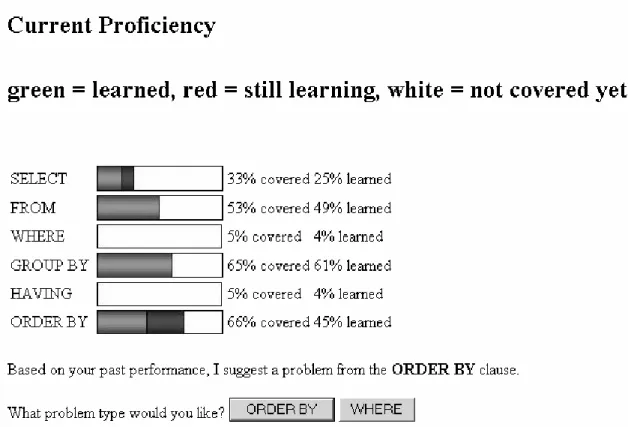
Let us describe the way we visualize the student model. The student model in SQL-Tutor is implemented as an overlay on top of the constraint base. There are currently more than 700 constraints in the system, and therefore it is not possible to visualize information about each constraint separately. Instead, we compress the student model into a simple structure that resembles the structure of the SELECT statement. The student is shown six skill meters, which show the student model in terms of the six clauses of the SELECT statement. For each clause, we find all the relevant constraints, and compute the coverage (the percentage of constraints that the student has used) and correctness (i.e. the percentage of all relevant constraints that the student has used correctly). These two percentages are visualized as shown in Figure 3. The screenshot shown in this figure illustrates a situation when the student asked for a problem based on the where clause, while the system’s preference was the order by clause3.
Table 5 presents some statistics about the study. There was no difference between the pre-test performances of the two groups. However, some students have only briefly logged on to SQL-Tutor. The Valid logs column of Table 5 reports the number of students who have attempted at least one problem, while the Final column reports the number of students from both groups who completed the post-test. The improvement of both groups of students from the pre- to the post-test is significant, but there was no significant difference between the groups (please note that the Pre-test and Post-test columns in Table 5 report the results only for students who completed both tests).
3
SQL-Tutor selects the order by clause because as the student’s error rate is highest on this clause. Fig. 3. A screenshot from the 2001 study, showing the open student model
Table 5. Statistics from the 2001 study
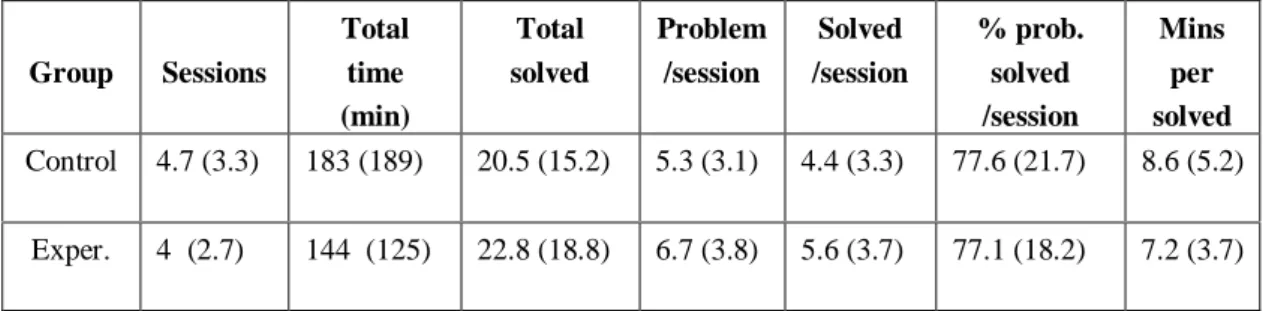
Table 6 gives some simple statistics gathered from the valid logs. The number of sessions ranged from 1 to 13, and the lengths of individual sessions ranged from one minute to almost four hours. The total interaction time ranged from 5 minutes to more than ten hours. The Total solved column gives the mean number of problems the students have solved during all sessions, which ranged from 1 to 70.
Problem/session gives the average number of problems students have seen in a session (ranges from 1
to 40). The Solved/session column gives the averages for the number of solved problems per session (ranges from 0 to 35), while the percentage of completed problems is given in the next column. On the average, the control group needed slightly more time per solved problem than the experimental group. None of the reported numbers are significantly different.
Table 6. Statistics about the sessions in the 2001 study
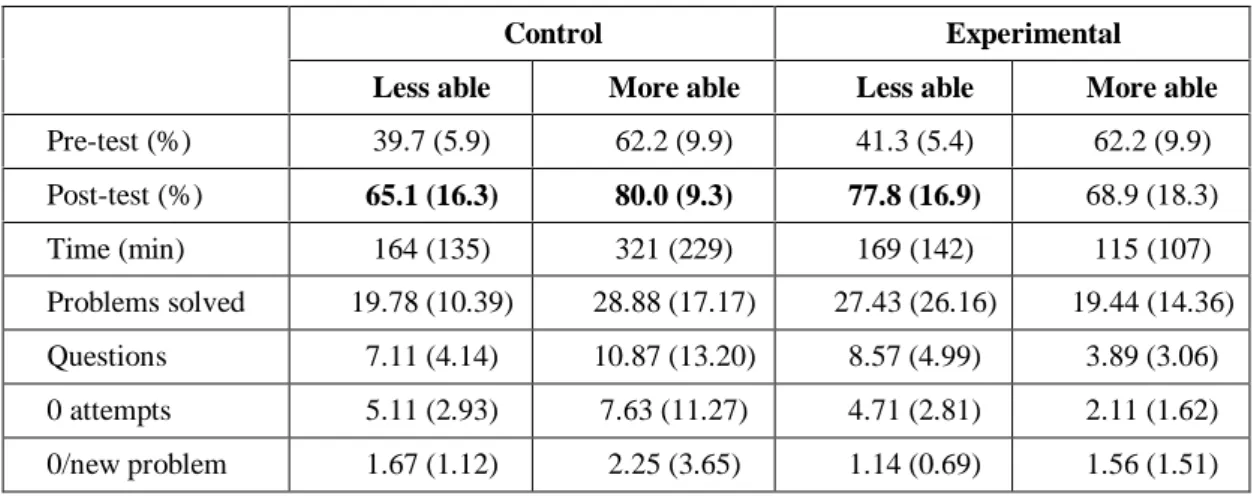
We also analysed the effects of the open student models with respect to students’ abilities. Each group was split post-hoc into two subgroups, with less and more able students, depending on their scores on the pre-test. Students who scored above the average on the pre-test were put into the more
able group, while the remaining students were put into the less able group. Table 7 contains statistics
about the subgroups, which are of similar sizes. There is no significant difference on the pre-test scores between the corresponding subgroups of students. All groups except more able students of the experimental group have significantly improved their performance on the post-test. The improvements on the post-test between the two more able groups are not significantly different. However, the scores on the post-test for the less able students in the experimental group are much higher than the results of the less able part of the control group, and this result is marginally significant (t = 1.43, p < 0.09). This result suggests that the less able students benefit more from open student models.
The logs also contain the data relevant to our hypothesis. Whenever a student asked for a new problem before completing the current one, the system asked the two questions. Each student was asked these questions at least once, and at most 40 times, and the means for the four subgroups are given in Table 7 in the Questions row. Out of the total of 2424 abandoned problems, 93 (38.4%) were from the more able students, and 149 were from the less able students. As in the 2000 study, less able
4
Although we use the word “problem” here, we refer to situations when the student abandons the current problem, and receive the two questions. It may be the case that the student abandons the same problem several times, so the total number reported here does not equal to the number of distinct problems abandoned.
Group Students Valid logs Final Pre-test % Post-test %
Control 34 24 12 49.1 (13.8) 71.3 (15.3) Experimental 33 21 12 50 (12.9) 74.1 (17.3) Group Sessions Total time (min) Total solved Problem /session Solved /session % prob. solved /session Mins per solved Control 4.7 (3.3) 183 (189) 20.5 (15.2) 5.3 (3.1) 4.4 (3.3) 77.6 (21.7) 8.6 (5.2) Exper. 4 (2.7) 144 (125) 22.8 (18.8) 6.7 (3.8) 5.6 (3.7) 77.1 (18.2) 7.2 (3.7)
students were much more likely to abandon a problem. The more able students from the experimental group abandoned significantly fewer problems than the more able students from the control group. However, there is no significant difference between the two groups of less able students. This might suggest that the more able students were encouraged to complete the problems by being exposed to their student models.
Table 7. Statistics for the groups of students in the 2001 study with different prior knowledge
The number of attempts before abandoning the problem ranged from 0 (the total of 165 cases) to 13, with an average of 1.43. The 0 attempts row in Table 7 gives the mean number of cases when students abandon the current problem without attempting it. The numbers reported here are a bit misleading, as they include all problems, not just the new problems. In other words, the student might attempt a problem, and then abandon it, only to receive the same problem again, and then abandon it for the second time. Such problems are counted twice. The following row (0/new problem) counts each problem only once in such situations. It can be seen that the more able students in the experimental group attempt to solve problems more often than the more able students from the control group; however, the differences are not significant.
The analysis of answers to the questions (illustrated in Figures 4 and 5) is consistent with our findings from the 2000 study. The control group students thought that the problem was too easy more
Control Experimental
Less able More able Less able More able
Pre-test (%) 39.7 (5.9) 62.2 (9.9) 41.3 (5.4) 62.2 (9.9) Post-test (%) 65.1 (16.3) 80.0 (9.3) 77.8 (16.9) 68.9 (18.3) Time (min) 164 (135) 321 (229) 169 (142) 115 (107) Problems solved 19.78 (10.39) 28.88 (17.17) 27.43 (26.16) 19.44 (14.36) Questions 7.11 (4.14) 10.87 (13.20) 8.57 (4.99) 3.89 (3.06) 0 attempts 5.11 (2.93) 7.63 (11.27) 4.71 (2.81) 2.11 (1.62) 0/new problem 1.67 (1.12) 2.25 (3.65) 1.14 (0.69) 1.56 (1.51) 0 5 10 15 20 25 30 35 40
Too easy Too hard Diff type No answer Control - less Control - more Exper - less Exper - more
often than experimental group students, especially the more able ones, although the inspection of the logs very often contradicts the reason they specified. Once more we saw that less able students were not good at identifying the kind of problem to work next, and therefore they specified any clause most often (in 55% of the cases in the control group, and 41% in the experimental group).
After answering the second question, the experimental group students were shown their student models if their selection of a clause to work on next differed from the system’s selection. The numbers of such cases for the two subgroups are given in the No of cases column in Table 8. In those situations, the students were asked to specify whether they wanted to go on with their selection, or adopt the system’s suggestion. The following column (% of questions) gives the percentages of the total number of questions when the student’s selection differed from the system’s one. Although the more able students have opinions about what they should be doing that more often varies from the system’s suggestion, compared to the less able students, the difference is insignificant. The percentages of cases when the student accepts the system’s suggestion (last column in Table 8) is almost identical for the more and less able students (please note that the Student agrees column reports the absolute number of cases only). When comparing the experimental group with the control group, there is no significant difference in the percentages of cases when more able students’ selections differ from system’s selections.
Table 8. The statistics for the two subgroups of the experimental group from the 2001 study
Overall, these results suggest that the open student model may have improved the performance of the less able students, and that it may have encouraged the more able students to complete problems
Group No of cases % of questions Student agrees % agree
Exper. - more able 2.00 (2.69) 57.2 (42.6) 0.75 (0.70) 51.6 (51.9) Exper. - less able 3.70(3.40) 35.8 (31.7) 1.80 (1.64) 57.5 (42.9) 0 5 10 15 20 25 30 35 40
SELECT FROM WHERE GROUP BY HAVING ORDER BY ANY No answer
Control - less Control - more Exper - less Exper - more
Fig. 6. Problem selection page
and judge their own abilities more readily. Alternatively, more able students in the experimental group may have specified a clause more often in order to view the model, which would suggest that they judged it to be beneficial. Such results are encouraging given the simplicity of the open student model developed for this study.
Do Open Student Models Help in Teaching Problem-Selection Strategies?
In the 2002 study we analysed whether students can learn to select problems by being given more insight into how the system selects problems based on their student models (Mitrovic & Martin, 2003). Our hypothesis was that more able students are capable of selecting appropriate problems on their own, while less able students need support. We hypothesized that the most beneficial condition for less able students would be faded problem selection: initially the system selects the problem for the student, showing why particular problems are good, and over time, the control over problem selection is given to the student. Such faded problem selection would support students by opening the problem-selection strategy, and supporting reflection on their knowledge via the open student model.
In order to test the hypothesis, we developed three versions of the system, differing from each other only in the problem selection strategy. We wanted the students to reflect on their knowledge, in order to identify the type of problem they have difficulties with. For that reason, we show the open student model in all three versions of the system. In the first version, SQL-Tutor selected the appropriate type of problem for the student on the basis of the student model. When the student asked for a new problem, he/she got a page showing their student model, and a message specifying what type of problem was selected by the system. In the second version, the student was shown the open student model, and was always asked to select a type of problem (Figure 6). In the third version, the problem selection was faded. For novices, the student was asked to select the type of the problem, as in Figure 6. If the student’s selection differed from what the system preferred, the student received a new page, showing the student model and specifying the system’s preference. Once the student’s level increased over the threshold, the student was allowed to select the type of problems without system’s intervention. All students initially start with the student level set to 0. Their level increases as they solve problems successfully, until they reach the maximum level of 9. The threshold was set to 4 for this study. Problems available in SQL-Tutor are also assigned complexity levels (ranging from 1 to 9). Once the type of problem has been determined in one of the previous three ways, the system searched for problems of the appropriate type that have not been solved yet. Out of the candidate problems, the system selected one that is at the appropriate level of complexity of the student (i.e. the complexity level of the chosen problem is the same as the student level, or one level higher).
Table 9 summarizes the experimental design. Out of 167 students enrolled in the course, 100 completed the pre-test and were classified into more/less able. The mean score for the pre-test for the whole class was 5.09 out of 9 (SD=1.69). Then, more able students (42 students who scored 6 or more points on the pre-test) were randomly allocated to versions where problems are selected by the student or by the system. Less able students (58 students) were randomly allocated to one of the three versions of the system. We hypothesized that less able students would do the best in the faded condition, and do worst when selecting problems on their own. Also, we hypothesized that less able student will only be able to acquire problem-selection skills in the faded condition.
Table 9. The five groups in the 2002 study
Ability Problem selection
More able (42 students) System Student N/A Less able (58 students) System Student Faded
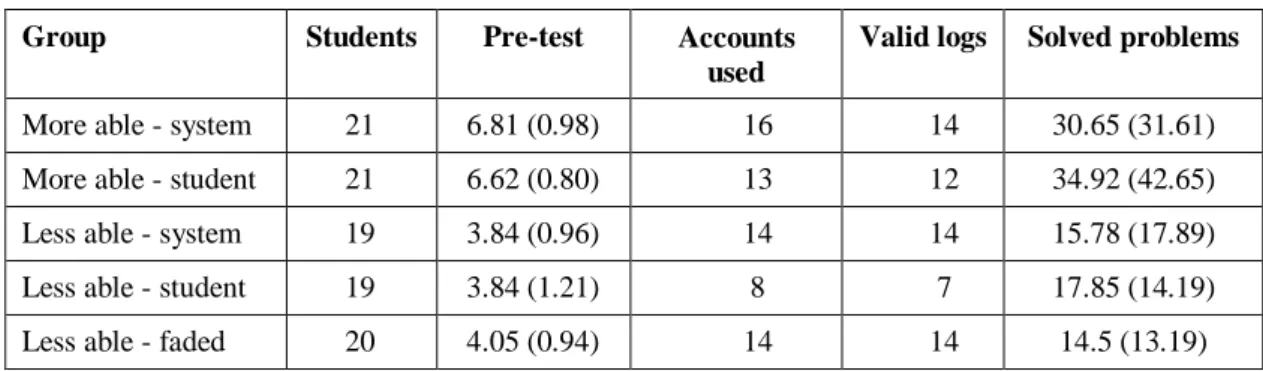
Table 10 gives the number of students in each group, their pre-test scores, and some additional information about their logs. A t-test showed no significant differences between the pre-test scores for the groups of same abilities, meaning the groups are comparable.
Table 10. Some statistics about the 2002 study
Group Students Pre-test Accounts
used
Valid logs Solved problems More able - system 21 6.81 (0.98) 16 14 30.65 (31.61) More able - student 21 6.62 (0.80) 13 12 34.92 (42.65) Less able - system 19 3.84 (0.96) 14 14 15.78 (17.89) Less able - student 19 3.84 (1.21) 8 7 17.85 (14.19) Less able - faded 20 4.05 (0.94) 14 14 14.5 (13.19)
As participation in the study was voluntary, 35 students who completed the pre-test did not log on to the system at all. Table 10 gives the number of students in each of the groups that actually used the system (the Accounts used column). However, some of these students looked at the system only briefly. We excluded the logs of 4 students who did not attempt any problems, and the number of valid logs is given in the table. The remaining 61 logs were then analysed. The more able students solved more problems than the less able ones. The maximal number of solved problems was 160 for more able, and 65 for less able students. There is no significant difference between the numbers of problems solved for the groups of same abilities.
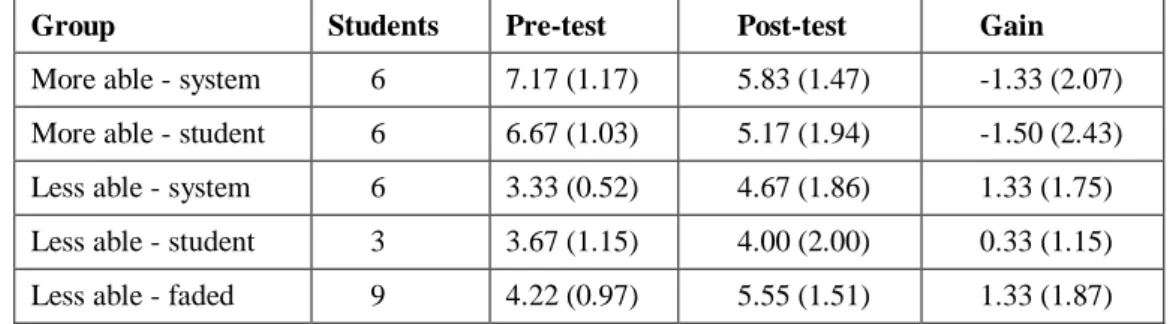
Table 11 gives the results on the pre- and post-test for students who have completed both. The pre- and post-test were of comparable in terms of the number of questions and difficulty. The two more able groups achieved higher results on the pre-test than on the post-test, but the difference is not significant. All three less able groups improved on the post-test, but the improvement is significant for the faded group only (t = -2.14, p < 0.05). This supports our hypothesis that less able students are not good in problem selection, and therefore would learn more when they do not need to select problems by themselves.
Table 11. Pre/post test performance for the 2002 study
We measured the students’ ability to select the clause, by comparing their selections with the system responses, and calculating for each group the mean number of times they chose the same clause as the system. Table 12 lists the results. Although the more able students appear slightly better at clause selection, the difference is not significant.
Table 12. Clause selection ability
Group Matches with system choice (SD)
More able students 26% (19) Less able students 19 % (19)
As stated previously, the faded group was coached in clause selection until they achieved the student level of 4. To see whether or not the faded group learned the problem selection strategy, we measured how often they selected the same clause as the system for each of the first three levels (i.e. for student level of 1, 2 and 3 respectively). Figure 7 plots the results. This graph indicates that they did indeed learn the problem selection strategy, and that by the time they reached level 3, they were better at problem selection than the less able students who were not coached. However, the difference between levels 1 and 3 is not statistically significant.
The experimental results did not support our first hypothesis: more able students appeared to be no significantly better at problem selection than their less able counterparts, with all students benefiting from system assistance at problem selection. However, the results did highlight the importance of problem selection: students that had system help performed best on the post-test. It also appears that
Group Students Pre-test Post-test Gain
More able - system 6 7.17 (1.17) 5.83 (1.47) -1.33 (2.07) More able - student 6 6.67 (1.03) 5.17 (1.94) -1.50 (2.43) Less able - system 6 3.33 (0.52) 4.67 (1.86) 1.33 (1.75) Less able - student 3 3.67 (1.15) 4.00 (2.00) 0.33 (1.15) Less able - faded 9 4.22 (0.97) 5.55 (1.51) 1.33 (1.87)
attempts to coach students in the skill of problem selection were successful: the students in the faded group improved their selection accuracy, and performed better at problem selection than the students who were not coached. The only group who significantly improved between pre- and post-test is the faded group. Selection Ability 0 0.1 0.2 0.3 0.4 0.5 0.6 0.7 1 2 3 Level S a m e a s s y s te m
Fig. 7. Problem selection ability for the faded group
OPENING THE STUDENT MODEL IN e-KERMIT
The open student model in SQL-Tutor is a simple abstraction of the detailed information about constraint histories. We also wanted to investigate whether more detailed open models would support learning and meta-cognitive skills better. The context of this research was KERMIT, our database design tutor (Suraweera & Mitrovic, 2002, 2004).
We developed a new version of the database design tutor, referred to as e-KERMIT (Hartley & Mitrovic, 2002). The open student model in e-KERMIT allows the student to inspect its content only. In contrast to the open student model in SQL-Tutor, which only provides a high-level summary of the student’s knowledge, the open student model in e-KERMIT is a summary of the real model on two different levels of abstraction. The high-level open model gives a general overview of student’s knowledge, while the low-level model presents more details of the student’s understanding of the basic concepts of the domain.
e-KERMIT’s interface includes the high-level summary of the student's knowledge and the number of problems the student has completed, as illustrated in Figure 8. The student’s knowledge is visualized in the bottom left part of the screen (titled Your progress), in terms of four skill meters, which show the student’s knowledge of notation, attributes, relationships and entities. This summary of the student model is always visible; it provides constant feedback on progress and acts as an aid to remind and motivate students to further inspect their models. Students could also go through a tutorial (available through the Help button) that explained the visualized student model.
The student can request a more detailed visualization of the student model, by clicking the Show
Me More button. Figure 9 contains a screenshot showing a more detailed open student model in the form of a hierarchy. The constraints are grouped according to the pedagogically important domain categories, while the individual constraints appear only as leaves in the hierarchy. The window is split into two frames. The top frame displays the hierarchical taxonomy of the Entity-Relationship (ER) knowledge, with progress statistics for each category. Some of the categories in Figure 9 are expanded. For example, consider the Attribute Identification category: the fraction to the right of the skill meter shows the student's score (33%) out of the percentage of material for attribute identification covered so far (44%). Besides summarizing the student’s knowledge, the open student model also presents a high level view of the domain, which supports the student’s understanding of the domain structure. By inspecting their models, students reflect on their knowledge and reconsider their beliefs about the domain concepts.
The lower frame provides a textbox that describes the currently selected category. This provides an explanation for any part of the taxonomy that the student may have problems interpreting. In addition, the first time a student accesses their student model, they are given a short tutorial on how to
interpret what they see. The aim of the tutorial is to facilitate a quick understanding by giving students an introduction to how their progress is represented, and what the percentages convey.
In order to evaluate the effect of such an open student model on learning, we performed a study with 66 students enrolled in the introductory database course at the University of Canterbury (Hartley & Mitrovic, 2002). The evaluation focused on whether students learn more with an open student model, and whether they inspect their models and feel that the open models contributed to their learning. We were also interested in any differences between more and less able students with respect to the above.
The students were assigned to one of two groups: a control group had no open student model, but it was available in the version of the system used by the experimental group. The groups were assigned to different rooms to prevent students from being exposed to both versions of the system. Each student participated in a single session of up to 110 minutes. Data collection consisted of four stages: pre-testing, system interaction, post-testing and subjective system assessment. Since participation was voluntary and laboratory attendance varies, it was hard to control group sizes. The pre/post tests consisted of three questions each, of similar difficulty. To minimise any effect resulting from variation in test difficulty, the tests were rotated between successive sessions. The students’ performance on the pre/post-tests is given in Table 13. Both groups improved significantly between
pre-test and post-test (p<.01 in both cases). Although control group improved more, the difference is not significant.
Table 13. Mean pre- and post-test scores for the e-KERMIT study
Group Students Pre-test Post-test Gain
Control 26 16.16 (1.82) 17.77 (1.45) 1.61 (1.56) Experimental 40 16.23 (2.59) 17.13 (2.37) 0.90 (1.96)
Within each group, students were post-hoc divided into more and less able subgroups based on their performance in the pre-test. The more able group included students who scored above the mean in the pre-test. Table 14 shows the average gains (difference between the post- and pre-test marks) and standard deviations. A 2x2 two-way randomised ANOVA (analysis of variance) revealed that the system used had no significant effect on student gain. The mean gains between the more and less able students in both groups were found to be significantly different (F(1,62) = 45.88, p < 0.001), but there was no significant interaction between the student ability and the system used. Further analysis revealed that only the less able students in control and experimental groups achieved a significant improvement (t = 6.65, p < 0.001 and t = 3.53, p < 0.005 respectively). Hence, the interaction with the system and the student model appears to be more beneficial to the less able students.
Table 14. Pre/post-test results for the more and less able students
The average interaction times of the two groups were not significantly different, as well as the total number of problems attempted/completed (see Table 15). However, students in the experimental group abandoned fewer problems (t = 2.64, p < 0.01).
Table 15. Statistics from the e-KERMIT study
The full open student model was accessed on average 1.36 times. This is possibly an underestimate of the real mean, because students may have opened the progress window only once and kept it open in the background. The tutorial was accessed on average 0.53 times in addition to the first time when progress was assessed. Comparison of the more and less able students revealed no significant difference between the mean number of times the open student model and tutorial were accessed. Correlation between the number of times students accessed their progress and their gain on the post-test for both the more able and less able students is low (r=0.344 and r=-0.146 respectively).
Group Students Pre-test Post-test Gain
Control – less able 15 14.80 (1.01) 17.13 (1.25) 2.33 (1.40) Control –more able 11 17.91 (0.83) 18.64 (1.29) 0.73 (1.74) Exper. – less able 22 14.41 (1.89) 16.14 (2.36) 1.73 (2.29) Exper. – more able 18 18.44 (1.20) 18.33 (1.78) -0.11 (1.75)
Control group Experimental group
Interaction time (mins) 66.65 (21.35) 67.65 (27.4) Attempted problems 4.36 (1.40) 3.89 (2.57) Abandoned problems 2.61 (1.40) 1.78 (1.25)
More than half of the experimental group students (51.2%) accessed the detailed student model. The more able students opened the main progress window more often than the less able ones (66.7% and 45.5% respectively).
The questionnaire first asked how much ER modelling experience the students had prior to using e-KERMIT. Valid responses were only lectures, lectures plus some work and extensive. No students in either group said they had had extensive experience; however a surprising number of students (62.5%) in the experimental group answered with lectures plus work, while only 20% of the students in the control group answered with this response. Despite the suggested difference in experience between the two groups, results from the pre-tests revealed that the groups were of equal competence.
Students were also asked to estimate how much they learnt and how much they enjoyed learning with the system, on a scale from 1 (lowest) and 5 (highest). There were no significant differences for the means for the amount learnt (3.2 and 3.1) and for enjoyment (3.4 and 3.6) for the experimental and the control group.
Students in the control group were asked whether they would like to have access to an open student model. Of the 31 students who completed the questionnaire, 1 student said no, 10 were unsure and 20 said yes, thus favouring an open student model approach.
The experimental group students were asked additional questions about the open student model. 27 students said they examined the summary in the main interface, 2 mostly viewed the detailed student model and 8 used both views equally5. Nine students said they had difficulty in understanding their model, 18 had no problems and 9 said the model was understandable after explanation. Students were also asked whether they found the detailed student model useful, whether they examined their progress to identify weaknesses in their ER knowledge, and whether they felt that the opportunity to examine their progress assisted their learning. The responses to these questions are summarized in Table 16. The Not Applicable option was selected if the students have not examined the detailed student model. The progress model was used to help identify weaknesses in ER knowledge by majority of these students, thus supporting self-assessment.
Table 16. Responses to questions about the open student model (OSM)
Question Yes No Do not know N/A
OSM useful? 45% 7.5% 12.5% 22.5%
OSM used to identify weaknesses? 47.5% 40% 0% 0%
OSM assisted learning? 67.5% 5% 22.5% 0%
Students were not told explicitly to explore the SM, yet around half of them did inspect it. Responses from the questionnaire indicate that students reflected on their progress and domain weaknesses to some extent, although the majority of students said that they consulted mostly the progress summary in the main interface. The majority of students who examined their model found it to be a useful tool to aid in learning.
CONCLUSIONS
Previous research shows that opening the student model has positive effect on students’ problem-solving and meta-cognitive skills. In this paper, we described the simple open student models used in two of our constraint-based tutors, SQL-Tutor and KERMIT. The systems present a high-level abstraction of the detailed information contained in the student model, in terms of skill meters
5
representing the student’s progress on domain concepts. SQL-Tutor presents the open student model when the student requires it, or when selecting new problems. KERMIT, on the other hand, continuously displays a high-level summary of the student’s progress, while more detailed information is available on request.
Our experiences show that even simple open student models can have important positive effects on learning and students’ meta-cognitive skills. A preliminary study performed with SQL-Tutor confirmed that less-able students were worse at self-assessment. However, when supported with a simple open student model, the performance of these students becomes significantly better than that of their peers of similar abilities without access to their models. Furthermore, the open student model seems to provide additional motivation for more able students to spend more time on problem-solving. We have also seen that open student models can help students learn to select better problems, by reflecting more on their knowledge. An experiment with a two-level open student model in e-KERMIT showed that students do appreciate having access to their models, and that they felt this feature contributed to their understanding of the domain.
The results obtained in these studies are very encouraging for such simple representations used. Our students only received a high-level overview of their knowledge, and they could not challenge it or make any modifications. We believe that engaging students in dialogues about their student models would be even more beneficial, and plan to enhance our constraint-based tutors in the future to support that kind of interaction.
Acknowledgements
We thank the anonymous reviewers for their comments, which enabled us to improve the paper. This research could not have been done without the support of other members of ICTG; we would like to specially thank Danita Hartley for her work on KERMIT and Brent Martin for collaborating on SQL-Tutor. The work presented here was supported by the University of Canterbury research grants U6242 and U6430.
References
Aleven, V., Koedinger, K., & Cross, K. (1999) Tutoring answer explanation fosters learning with understanding. In: Lajoie, S.P., Vivet, M. (eds.): Proc. 9th Int. Conf. Artificial Intelligence in Education, pp. 199-206.
Aleven, V., & Koedinger, K. (2000) Limitations of student control: do students know when they need help? In: G. Gauthier, C. Frasson and K. VanLehn (eds.) Proc. 5th Int. Conf. Intelligent Tutoring Systems,
Springer-Verlag, pp. 292-303.
Aleven, V., McLaren, B., Roll, I., & Koedinger, K. (2004) Towards tutoring help seeking. In: J. Lester, R. M. Vicari and F. Paraguacu (eds.): Proc. 7th Int. Conf. Intelligent Tutoring Systems, Springer-Verlag, pp.
227-239.
Baghaei, N., & Mitrovic, A. (2005) COLLECT-UML: Supporting individual and collaborative learning of UML class diagrams in a constraint-based tutor. In: R. Khosla, R. J. Howlett, L. C. Jain (eds.) Proc. 9th Int. Conf. Knowledge-based and Intelligent Information and Engineering Systems KES 2005, Springer-Verlag, LCNS
3684, pp. 458-464.
Baghaei, N., Mitrovic, A., & Irvin, W. (2006) Problem-solving support in a constraint-based intelligent tutoring system for UML. Technology, Instruction, Cognition and Learning (in press).
Bielaczyc, K., Pirolli, P., & Brown, A.L. (1993) Training in self-explanation and self-regulation strategies: investigating the effects of knowledge acquisition activities on problem-solving. Cognition and Instruction, 13(2), 221-252.
Brusilovsky, P., Schwarz, E., & Weber, G. (1996) ELM-ART: an Intelligent Tutoring System on World Wide Web. Proc. 3rd Int. Conf. Intelligent Tutoring Systems, pp. 261-269.
Brusilovsky, P., & Sosnovsky, S. (2005). Engaging students to work with self-assessment questions: a study of two approaches. In: J. Cunha, W. Fleischman, V. K. Proulx, J. Lourenço (eds), Proc. 10th Conf. Innovation and Technology in Computer Science Education, ACM Press, pp. 251-255.
Bull, S. (1997) See yourself write: a simple student model to make students think. In: Jameson, A., Paris, C., Tasso, C. (eds.): Proc. 6th Int. Conf. User Modeling, Springer, pp. 315-326.
Bull, S., Brna, P., & Pain, H. (1995) Extending the scope of the student model. User Modeling and User Adapted
Interaction, 5(1), 45-65.
Bull, S., & Brna, P. (1997) What does Susan know that Paul doesn't? (and vice versa): Contributing to each other's student model. In: B. du Boulay, R. Mizoguchi (eds.), Proc. Int. 8th Conf Artificial Intelligence in Education, IOS Press, Amsterdam, pp. 568-570.
Bull, S., & Brna, P. (1999) Enhancing peer interaction in the Solar system. In: P. Brna, M. Baker & K. Stenning (eds.) Roles of communicative interaction in learning to model in Mathematics and Science: Proc.
C-LEMMAS, Ajaccio, Corsica.
Bull, S., & Pain, H. (1995) Did I say what I think I said, and do you agree with me? Inspecting and Questioning the Student Model. In: J. Greer (ed), Proc. Int. Conf. Artificial Intelligence in Education, pp. 501-508. Bull, S., & Smith, M. (1997) A pair of student models to encourage collaboration. In: A. Jameson, C. Paris & C.
Tasso (eds) Proc. 6th Int. Conf. User Modeling, Springer, pp. 339-341.
Bull, S., Abu-Issa, A.S., Ghag, H., & Lloyd, T. (2005) Some unusual open learner models. In: C-K Looi, G. McCalla, B. Bredeweg, J. Breuker (eds) Proc. 12th Int. Conf. Artificial Intelligence in Education, IOS Press,
pp. 104-111.
Bunt, A., Conati, C., & Muldner, K. (2004) Scaffolding Self-Explanation to Improve Learning in Exploratory Learning Environments. In: J. Lester, R. M. Vicari and F. Paraguacu (eds.): Proc. 7th Int. Conf. Intelligent Tutoring Systems, Springer-Verlag, pp. 656-667.
Czarkowski, M., Kay, J., & Potts, S. (2005) Scrutability as a core interface element. In: C-K Looi, G. McCalla, B. Bredeweg, J. Breuker (eds.) Proc. 12th Int. Conf. Artificial Intelligence in Education, IOS Press, pp.
783-785.
Conati, C., & VanLehn, K. (2000) Further results from the evaluation of an intelligent computer tutor to coach self-explanation. In: Gauthier G., Frasson C., and VanLehn K. (eds.): Proc. 5th Int. Conf. Intelligent Tutoring Systems, Springer-Verlag, pp. 304-313.
Dimitrova, V., Self, J., & Brna, P. (2001) Applying interactive open learner models to learning technical terminology. In: M. Bauer, P. J. Gmytrasiewics, J. Vassileva (eds.) Proc. 8th Int. Conf. User Modeling, Springer, pp. 148-157.
Dimitrova, V. (2003) STyLE-OLM: Interactive open learner modelling, Artificial Intelligence in Education, 13, 35-78.
Greer, J., McCalla, G., Collins, J., Kumar, V., Meagher, P., & Vassileva, J. (1998) Supporting peer help and collaboration in distributed workplace environments. Artificial Intelligence in Education, 9, 159-177. Hartley, D., & Mitrovic, A. (2002) Supporting learning by opening the student model. In: S. Cerri, G.
Gouarderes and F. Paraguacu (eds.) Proc. 6th Int. Conf. Intelligent Tutoring Systems, LCNS 2363, pp.
453-462.
Kay, J. (1995) The UM toolkit for cooperative student modeling. User Modeling and User-Adapted Interaction, 4, 149-196.
Martin, B., & Mitrovic, A. (2003) Domain modeling: art or science? In: U. Hoppe, F. Verdejo & J. Kay (eds.)
Proc. 11th Int. Conf. Artificial Intelligence in Education, IOS Press, pp. 183-190.
Martin, B., & Mitrovic, A. (2005) Using learning curves to mine student models. In: L. Ardissono, P. Brna, A. Mitrovic (eds) Proc. 10th Int. Conf. User Modeling, Springer-Verlag, LNAI 3538, pp. 79-88.
Martin, B., & Mitrovic, A. (2006) The effect of adapting feedback generality in ITS. V. Wade, H. Ashman, and B. Smyth (eds.) Proc. 4th Int. Conf. Adaptive Multimedia and Adaptive Web-based Systems, LNCS 4018, pp.
192 – 202.
Mayo, M., & Mitrovic, A. (2001) Optimising ITS behaviour with Bayesian networks and decision theory.
Artificial Intelligence in Education, 12(2), 124-153.
McCalla, G., Vassileva, J., Greer, J., & Bull, S. (2000) Active learner modeling. In: G. Gauthier, C. Frasson, K. VanLehn (eds.), Proc. 5th Int. Conf. Intelligent Tutoring Systems, Springer, pp. 53-62
Mitrovic, A. (1998) Learning SQL with a computerized tutor. 29th ACM SIGCSE Technical Symposium, pp.
Mitrovic, A. (2001) Investigating students’ self-assessment skills. In: M. Bauer, P.J. Gmytrasiewicz and J. Vassileva (eds.) Proc. 8th Int. Conf. User Modeling, Springer-Verlag LNAI 2109, pp. 247-250.
Mitrovic, A. (2003) An Intelligent SQL Tutor on the Web. Artificial Intelligence in Education, 13(2-4), 173-197. Mitrovic, A. (2005) The effect of explaining on learning: a case study with a data normalization tutor. In: C-K Looi, G. McCalla, B. Bredeweg, J. Breuker (eds.) Proc. 12th Int. Conf. Artificial Intelligence in Education,
IOS Press, pp. 499-506, 2005.
Mitrovic, A., & Martin, B. (2003) Scaffolding and fading problem selection in SQL-Tutor. In: U. Hoppe, F. Verdejo, J. Kay (eds) Proc. 11th Int. Conf. Artificial Intelligence in Education, IOS Press, pp. 479-481.
Mitrovic, A., Martin, B., & Mayo, M. (2002) Using evaluation to shape ITS design: results and experiences with SQL-Tutor. User Modeling and User-Adapted Interaction, 12(2-3), 243-279.
Mitrovic, A., & Ohlsson, S. (1999) Evaluation of a constraint-based tutor for a database language. Artificial
Intelligence in Education, 10(3-4), 238-256.
Mitrovic, A., Suraweera, P., Martin, B., & Weerasinghe, A. (2004) DB-suite: experiences with three intelligent, Web-based database tutors. Journal of Interactive Learning Research, 15(4), 409-432.
Morales, R., Pain, H., & Conlon, T. (2001) Effects of inspecting learner models on learners’ abilities. In: J. D. Moore, C. L. Redfield, W. L. Johnson (eds.) Proc.10th Int. Conf. Artificial Intelligence in Education, pp.
434-445.
Ohlsson, S. (1994) Constraint-based student modeling. In: Greer, J.E., McCalla, G (eds.): Student modeling: the
key to individualized knowledge-based instruction, 167-189.
Paiva, A., & Self, J. (1995) TAGUS – a user and learner modeling workbench. User Modeling and
User-Adapted Interaction, 4, 197-226.
Person, N.K., Graesser, A.C., Magliano, J.P., & Kreuz, R.J. (1994) Inferring what the student knows in one-to-one tutoring: The role of student questions and answers. Learning and Individual Differences, 6, 205-229. Self, J. (1995) Computational Mathetics http://www.cbl.leeds.ac.uk/~jas/cm.html
Suraweera, P., & Mitrovic, A. (2002) KERMIT: a constraint-based tutor for database modeling. In: S. Cerri, G. Gouarderes and F. Paraguacu (eds.) Proc. 6th Int. Conf. Intelligent Tutoring Systems, Biarritz, France,
LCNS 2363, pp. 377-387.
Suraweera, P., & Mitrovic, A. (2004) An intelligent tutoring system for Entity-Relationship modelling. Artificial
Intelligence in Education, 14(3-4), 375-417.
Swanson, H.L. (1990) Influence of metacognitive knowledge and aptitude on problem solving. J. Educational
Psychology, 82, 306-314.
VanLehn, K., Lynch, C., Schulze, K., Shapiro, J.A., Shelby, R., Taylor, L., Treacy, D., Weinstein, A., & Wintersgill, M. (2005) The Andes physics tutoring system: lessons learned. Artificial Intelligence in
Education, 15(3), 147-204.
White, B.Y., Shimoda, T. A., & Frederiksen, J.R. (1999) Enabling students to construct theories of collaborative inquiry and reflective learning: computer support for metacognitive development. Artificial Intelligence in
Education, 10, 151-182.
Zakharov, K., Mitrovic, A., & Ohlsson, S. (2005) Feedback micro-engineering in EER-Tutor. In: C-K Looi, G. McCalla, B. Bredeweg, J. Breuker (eds.) Proc. 12th Int. Conf. Artificial Intelligence in Education, IOS Press,
pp. 718-725.
Zapata-Rivera, J-D. (2001) Supporting negotiated assessment using open student models. In: M. Bauer, P. J. Gmytrasiewicz, J. Vassileva (eds.), Proc. 8th Int. Conf. User Modeling, Springer, 295-297.
Zapata-Rivera, J-D., & Greer, J.E. (2004) Interacting with inspectable Bayesian models, Artificial Intelligence in