AIS Electronic Library (AISeL)
AIS Electronic Library (AISeL)
CAPSI 2020 Proceedings Portugal (CAPSI)
10-2020
Longevity-Linked Life Annuities: A Bayesian Model Ensemble
Longevity-Linked Life Annuities: A Bayesian Model Ensemble
Pricing Approach
Pricing Approach
Jorge M. BravoFollow this and additional works at: https://aisel.aisnet.org/capsi2020
This material is brought to you by the Portugal (CAPSI) at AIS Electronic Library (AISeL). It has been accepted for inclusion in CAPSI 2020 Proceedings by an authorized administrator of AIS Electronic Library (AISeL). For more information, please contact [email protected].
20.ª Conferência da Associação Portuguesa de Sistemas de Informação (CAPSI’2020) 16 e 17 de outubro de 2020, Porto, Portugal
ISSN 2183-489X
1 Jorge M. Bravo, NOVA IMS Universidade Nova de Lisboa & Université Paris-Dauphine PSL & MagIC &
CEFAGE-UE, Portugal, [email protected]
Abstract
Participating longevity-linked life annuities (PLLA) are an interesting solution to manage systematic longevity risk in markets in which alternative risk management solutions are scarce and/or expensive and in which there are significant demand- and supply-side constraints that prevent individuals from annuitizing their retirement wealth. In this paper we revisit, complement and expand previous research on the design, valuation and willingness to pay for various index-type PLLA structures. Contrary to previous studies that use a single model to forecast mortality rates, we develop a novel approach based on a Bayesian Model Ensemble of generalised age-period-cohort stochastic mortality models. To determine which models received a greater or lesser weight in the final projections, we implemented a backtesting cross-validation approach. We use Taiwan (mortality, yield curve and stock market) data from 1980 to 2019 and adopt a longevity option decomposition valuation approach. The empirical results provide significant valuation and policy insights for building post-retirement income, particularly in Asian countries.
Keywords: Longevity-linked life annuities; Bayesian Model Ensemble; forecasting methods; longevity options; Pension design.
1.
I
NTRODUCTIONPension funds and annuity providers face uncertainty regarding financial returns and systematic longevity risk due to unexpected future mortality improvements. Although advances in longevity are not homogenous across socioeconomic groups, providing an efficient risk pooling mechanism that addresses the (individual) uncertainty of death through the provision of a lifetime annuity is one of the main mechanisms pension schemes are considered to redistribute income in a welfare-enhancing manner (Ayuso, Bravo and Holzmann, 2017a,b, 2020; Bravo, 2019). Without such an instrument, individuals risk outliving their accumulated wealth or leaving unintended bequests to his/her dependants. Traditional life annuities are a key instrument in mandated Defined Benefit (DB) pension schemes, in financial (FDC) and non-financial Notional (NDC) Defined Contribution schemes and in private pensions provided by insurance companies (Bravo and Herce, 2020).
Contrary to standard Modigliani life-cycle model of savings and consumption prediction, the voluntary market purchase of retirement annuities is in most countries very limited and decreasing and the actual saving/dissaving behaviour after retirement is often at odds with economic theory (Holzmann et al., 2020). Several demand side (e.g., perceived poor value-for-money, the existence of annuity alternatives, bequest motives, behavioural and informational limitations, taxation1) and supply-side (e.g., the regulatory burden of
20.ª Conferência da Associação Portuguesa de Sistemas de Informação (CAPSI’2020) 2 annuity providers, with onerous capital requirements for unhedgeable risks (e.g., longevity risk) within Solvency II, nearly zero interest rate environment and significant interest rate risk and credit risk exposure2, long-term financial risk, the cost of loss control and loss financing longevity risk management solutions, limited reinsurance capacity to absorb massive exposure-to-risk) arguments have been put forward to explain this "annuity puzzle", i.e., to explain why the level of annuitization by individuals is much smaller than economic theory would suggest. Together with the development of capital market longevity-linked securities and their derivatives and innovative reinsurance designs, this has increased the attention towards new contract structures involving financial and longevity risk sharing mechanisms between the annuity provider and annuitants, and increased recommendations towards the use of deferred annuities.
Several alternative index-type and indemnity-type mechanisms have been proposed in the literature to directly or indirectly share financial and longevity risks between annuity providers and individuals. They typically involve updating the annuity benefit according to observed mortality and investment developments. Depending on the contract design and underlying asset performance, future annuity benefits may decline with time, an undesirable feature that must be compensated at contract inception through lower prices or higher initial benefits (a risk premium). For instance, in investment-linked annuities payments fluctuate according to the actual return of the asset portfolio backing the contract. In traditional participating (with-profit) annuities payments depend on the providers overall performance regarding mortality, investments, and expenses. In longevity-linked life annuities (Bravo and El Mekkaoui de Freitas, 2018) benefits are updated periodically based on the dynamics of both a longevity index and of an interest rate adjustment factor. Lüthy et al. (2001) suggest updating benefits based on the ratio between the annuity factor computed at contract inception and the one based on the latest mortality forecast. Richter and Weber (2011) and Maurer et al. (2013) suggest setting up a contingency fund to reduce the risk of insufficiently funded contracts originated by longevity risk and propose a benefit updating mechanism in which policyholders participate in surplus due to mortality fluctuations but do not have to cover deficit scenarios. Alho, Bravo and Palmer (2013) investigate the consequences of introducing periodically revised annuities in NDC pension schemes and suggest updating benefits periodically based on the relationship between expected and observed period life expectancy. Denuit et al. (2015) propose sharing longevity risk by updating the deferment period of longevity-contingent deferred life annuities to accommodate mortality improvements while keeping payments fixed once they start. Blake et al. (2003) propose participating annuities which pay survivor credits to annuitants according to the mortality experience of a given pool of annuitants. Alternative ways of sharing longevity risk have been proposed in the context of the design and reform of public pension schemes, e.g., the conditional indexation in collective DC plans in the Netherlands and the so-called defined-ambition schemes (Bovenberg et al., 2015), the automatic adjustment mechanism in NDC schemes (Sweden) or the reform project of the first pillar in Belgium with the adoption of a points system with Musgrave rule (Devolder & de Valeriola, 2019), in tontine annuities
2 See, e.g., Bravo and Silva (2006) and Simões, Oliveira and Bravo (2019) for single and multiple ALM interest rate risk immunization strategies for pension funds and annuity providers and Chamboko and Bravo (2016, 2019a,b, 2020) and Ashofteh and Bravo (2019, 2020) for a discussion on credit risk.
20.ª Conferência da Associação Portuguesa de Sistemas de Informação (CAPSI’2020) 3 (Milevsky and Salisbury, 2015, 2016; Chen et al., 2018), and in non-insurance (closed or open) pooling mechanisms that do not provide financial or longevity guarantees (insurance) like Group-Self Annuitization (GSA) schemes (Piggott et al., 2005; Valdez et al., 2006; Qiao and Sherris, 2013; Hanewald et al., 2013; Boyle et al., 2015), Pooled Annuity Funds (Stamos, 2008; Donnelly et al., 2013; Bräutigam, Guillén and Nielsen, 2017), and Annuity Overlay Funds (Donnelly et al., 2014; Donnelly, 2015).
Against this background, this paper revisits, complements and expands previous results on the design and pricing of index-type Participating Longevity-Linked Life Annuities (PLLA). We consider an index-type PLLA and empirically investigate the pricing of both immediate and deferred participating and non-participating annuity structures. Contrary to previous studies that use a single model to forecast mortality rates, we develop a novel approach based on a Bayesian Model Ensemble (BME) of six well known Generalised Age-Period-Cohort (GAPC) stochastic mortality models, all of which probabilistically contribute towards projecting future age-specific mortality rates, survival probabilities and PLLA prices. Ensemble methods reduce the inherent uncertainty in the choice of the appropriate projection model (model risk) and account for additional sources of risk not captured in a single model framework. Moreover, the BME considers how well each individual model performs in predicting mortality rates at the time of computing final projections. To determine which models received a greater or lesser weight in the final projections, we carry out a backtesting exercise to determine individual model forecasting accuracy considering a common "lookback window" and a 5-year forecasting horizon.
We investigate alternative annuity arrangements in which both financial and longevity risks are shared between the provider and annuitants, including capped PLLAs that limit benefit volatility and provide longevity insurance. For the valuation, we use a longevity option decomposition approach and present new results for deferred PLLAs. Additionally, we empirically investigate price sensitivity with regards to changes in the the guaranteed interest rate and in the investment strategy by considering a more aggressive lifecycle approach. We use Taiwan (mortality, yield curve and stock market) data from January 1980 to June 2019 to calibrate the models. Previous studies have focused on the development of innovative annuity contracts in mature European or North American markets. In this paper we contribute to the literature by focusing instead on emerging and high potential Asia Pacific annuity markets in which building post-retirement income is an urgent issue due to advances in longevity and in which Equity-indexed annuities and variable annuities are becoming increasingly important (Chiu, Hsieh, and Tsaib, 2019).
The setting comprises a risk-neutral, frictionless and continuous financial market in which the annuity provider invests the insurance premium in a portfolio of dividend-paying stocks and coupon bonds, and a risk-free interest rate. We assume the yield curve dynamics is well captured by a two-factor equilibrium Vasicek (1977) model and the stock market index follows a standard geometric Brownian motion diffusion process. To account for the longevity risk premium in pricing the contracts, we compute cohort-specific risk-adjusted survival probabilities by using a risk-neutral simulation approach assuming the dynamics of mortality rates is well represented by a BME of stochastic mortality models, with period and cohort indices modelled using standard
20.ª Conferência da Associação Portuguesa de Sistemas de Informação (CAPSI’2020) 4 time series methods and risk neutral distribution of the innovations obtained using the Wang transform. We assume individuals want to optimize the expected present value of utility derived from consumption (annuity income) through their remaining lifetime and compute the fair value of the utility-equivalent fixed life annuity that delivers the same lifetime utility as the PLLA, considering for alternative time preference and risk aversion parameters. A sensitivity analysis of model results is provided. The remainder of the paper is organized as follows. In Section 2, we briefly describe the benefit structure and risk sharing design of PLLAs and introduce the valuation setup. Section 3 describes the financial and stochastic mortality models adopted to empirically investigate the fair value of the contracts. In Section 4 we analyse and discuss the simulation results for the fair value of participating and non-participating PLLAs and embedded longevity options and investigate the robustness of the results against changes in some key models and parameters. Section 5 concludes and provides guidance for further research.
2.
T
HES
ETUP2.1.Benefit Structure and Risk Sharing design
Consider an index-type participating longevity-linked life annuity (PLLA) along the lines proposed by Bravo and El Mekkaoui de Freitas (2018). Under this contract, the annuity benefit is updated periodically based on both the observed survival experience of a reference pool and the investment performance of the financial assets backing the contract. Without loss of generality, let us assume that annuitants contribute equal amounts into the annuity fund and, in return, receive equal annuity benefit payments 𝑏𝑡
at time
𝑡.
The authors show that the annual benefit at some future date 𝑡0+ 𝑘, 𝑏𝑡0+𝑘 will depart from the initial benefit 𝑏𝑡0 depending on the dynamics of both a longevity factor 𝐼𝑡0+𝑘 and an interest rate adjustment (IRA) factor 𝑅𝑡0+𝑘,𝑏𝑡0+𝑘 = 𝑏𝑡0× 𝐼𝑡0+𝑘× 𝑅𝑡0+𝑘, 𝑘 = 1, … , 𝜔 − 𝑥0, (1)
where 𝐼𝑡0+𝑘 is a ratio between the expected survival probability and the survival rate observed in a reference population, defined by 𝐼𝑡0+𝑘 = 𝑝 𝑘 𝑥[𝐹00 ] (𝑡0) 𝑝 𝑘 𝑥0 [𝐹𝑘](𝑡 𝑘) = ∏ 𝑝𝑥0+𝑗 [𝐹0] (𝑡 0+ 𝑗) 𝑝𝑥 0+𝑗 [𝐹𝑘](𝑡 0+ 𝑗) , 𝑘−1 𝑗=0 (2) with 𝑝 𝑘 𝑥0+𝑗 [𝐹0] (𝑡 0+ 𝑗) = ∏[1 − 𝑞𝑥0+𝑗(𝑡0+ 𝑗)], 𝑘−1 𝑗=0 (3)
denoting the k-year survival probability of some reference population cohort aged 𝑥0 at time 𝑡0 (𝐹0 measurable, i.e., computed at contract inception on a market or national population life table) and 𝑘 𝑥𝑝[𝐹0𝑘
]
(𝑡𝑘) is the corresponding k-year survival probability observed at time 𝑡𝑘 (𝐹𝑘 measurable) and 𝜔 the highest-attainable
20.ª Conferência da Associação Portuguesa de Sistemas de Informação (CAPSI’2020) 5 age. In (3), 𝑞𝑥0+𝑗(𝑡0+ 𝑗) is the 1-year death probability of an individual aged 𝑥0+ 𝑗 at time 𝑡0+ 𝑗. The IRA factor 𝑅𝑡0+𝑘 is defined by 𝑅𝑡0+𝑘= ∏𝑘−1(1 + 𝑅𝑡) 𝑗=0 (1 + 𝑖𝑡0) 𝑘 , (4)
where 𝑅𝑡 denotes the observed net investment return in year 𝑡 and 𝑖𝑡0 is the (generally non-negative) guaranteed minimum interest rate set at time 0. If 𝑅𝑡 = 𝑖𝑡0t and mortality improvements are as expected (i.e., 𝐼𝑡0+𝑘= 1 k), the arrangement resembles a classical life annuity with fixed-return and fixed-benefit. If 𝑅𝑡 = 𝑖𝑡0 and observed longevity improvements are higher (lower) than predicted, i.e., 𝐼𝑡0+𝑘 < 1 (𝐼𝑡0+𝑘> 1) k, the annuity payments will decline (increase) along with the dynamics of 𝐼𝑡0+𝑘. If mortality improvements are as expected and investments perform above the guaranteed interest rate (i.e., 𝑅𝑡0+𝑘> 1 k), the extra return is returned to participants in the form of a higher benefit payment. If 𝐼𝑡0+𝑘 < 1 and 𝑅𝑡0+𝑘> 1 the better than expected investment returns may at least partially compensate the negative impact of higher than expected mortality improvements. At annuity inception, the longevity and the IRA indexes are random variables and, hence, future annuity benefits are uncertain. This contrasts with traditional fixed life annuity contracts that guarantee a constant benefit while the annuitant is alive, independently of longevity and financial performance developments, transferring thus all risks (financial and biometric) to the provider.
Appropriate bounds to the longevity and IRA adjustment factors (or to the benefit amount) can in principle be introduced to offer partial guarantees, limit the volatility of annuity payments, to provide effective longevity insurance or to limit the profit-share. For instance, in Bravo and El Mekkaoui de Freitas (2018) the authors suggest to limit the risk beared by policyholders by adding (possibly) time-dependent upper 𝐼𝑡0+𝑘
𝑚𝑎𝑥(𝑡) and lower
𝐼𝑡𝑚𝑖𝑛0+𝑘(𝑡) barriers for the longevity index, i.e., 0 < 𝐼𝑡𝑚𝑖𝑛0+𝑘(𝑡) < 1 < 𝐼𝑡𝑚𝑎𝑥0+𝑘(𝑡). In the particular case caps and floors are constant during the whole contract, 𝐼𝑡𝑚𝑎𝑥0+𝑘(𝑡) = 𝐼𝑚𝑎𝑥 and 𝐼𝑡𝑚𝑖𝑛0+𝑘(𝑡) = 𝐼𝑚𝑖𝑛 for 𝑘 = 1, … , 𝜔 − 𝑥0. In a capped PLLA the longevity index is replaced by its capped version
𝐼𝑡0+𝑘(𝐼𝑡𝑚𝑖𝑛0+𝑘(𝑡), 𝐼 𝑡0+𝑘 𝑚𝑎𝑥(𝑡)) = 𝑚𝑎𝑥{𝑚𝑖𝑛(𝐼 𝑡0+𝑘 𝑚𝑎𝑥(𝑡); 𝐼 𝑡0+𝑘); 𝐼𝑡0+𝑘 𝑚𝑖𝑛(𝑡)}. (5)
Equation (1) states that in a PLLA annuity benefits are adjusted upwards (downwards) depending on whether the observed survival probability is higher (lower) than predicted at contract inception and the realized investment return is above (below) the guaranteed interest rate. The risk (and profit)-sharing mechanism can further be limited by specifying at contract inception a maximum age to apply the benefit adjustment (1), eventually in combination with caps and floors, i.e., a contract structure combining a temporary PLLA with a deferred life annuity with unknown benefit at time 0.
2.2.Valuation
Without loss of generality, consider an immediate PLLA contract with initial benefit 𝑏𝑡0= 1 offered to an individual aged 𝑥0 at time 𝑡0 with remaining lifetime 𝑇𝑥0(𝑡0) = 𝜔 − 𝑥0. Denoting by {𝑟𝑡: 𝑡 ≥ 0} the risk-free
20.ª Conferência da Associação Portuguesa de Sistemas de Informação (CAPSI’2020) 6 instantaneous interest rate process, and by ℚ the equivalent martingale measure associated to the numeraire "money-market account", the ℱ-measurable fair value (single premium) of this contract at time 𝑡0 is given by
𝑎𝑥0 𝑃𝐿𝐿𝐴(𝑡 0) = ∑ 𝐸ℚ 𝜔−𝑥0 𝑘=1 [𝐵(0, 𝑘) ∙ 𝑝𝑘 𝑥[ℱ0𝑘 ] (𝑡𝑘) ∙ 𝐼𝑡0+𝑘∙ 𝑅𝑡0+𝑘|ℱ], (6)
where 𝐵(𝑡, 𝑇) is, for a given interest rate process, an appropriate (deterministic or stochastic) discount factor. In the case 𝑅𝑡0+𝑘 = 1, all systematic longevity risk is transferred to annuitants and a pure PLLA is obtained.
If 𝐼𝑡0+𝑘 = 𝑅𝑡0+𝑘= 1 (∀𝑘) the design (6) is equivalent to that of a classical fixed level annuity. Consider now
a deferred PLLA due with initial benefit 𝑏𝑡0= 1 payable from time 𝑡0+ 𝑢 to an individual then aged 𝑥0+ 𝑢. The fair value of this contract is
𝑎̈ 𝑢| 𝑥0 𝑃𝐿𝐿𝐴(𝑡 0) = ∑ 𝐸ℚ 𝜔−𝑥0−𝑢 𝑘=𝑢 [𝐵(0, 𝑘) ∙ 𝑝𝑘 𝑥0 [ℱ𝑘](𝑡 𝑘) ∙ 𝐼𝑡0+𝑘∙ 𝑅𝑡0+𝑘|ℱ]. (7)
Similarly, the fair value of an immediate capped PLLA (CPLLA) can be expressed as follows
𝑎𝑥0 𝐶𝑃𝐿𝐿𝐴(𝑡 0) = ∑ 𝐸ℚ 𝜔−𝑥0 𝑘=1 [𝐵(0, 𝑘) ∙ 𝑝𝑘 𝑥 0+𝑗 [ℱ𝑘](𝑡 𝑘) ∙ 𝑚𝑎𝑥{𝑚𝑖𝑛(𝐼𝑡0+𝑘 𝑚𝑎𝑥(𝑡); 𝐼 𝑡0+𝑘); 𝐼𝑡0+𝑘 𝑚𝑖𝑛(𝑡)} ∙ 𝑅 𝑡0+𝑘|ℱ]. (8)
For the valuation of the contract, we adopt the longevity option decomposition developed by Bravo and El Mekkaoui de Freitas (2018). Without loss of generality, assume that 𝑏𝑡0 = 1 and that 𝐼𝑡0+𝑘 < 1 and 𝑅𝑡0+𝑘= 1 for 𝑘 = 1, … , 𝜔 − 𝑥0. The fair value of a PLLA at time 𝑡0 can be decomposed into a long position in a classical fixed annuity 𝑎𝑥[ℱ00
]
(𝑡0) and a short position in an embedded European-style longevity floor 𝐿ℱ(𝑡0) with underlying 𝐼𝑡0+𝑘, constant strike equal to one unit of currency and maturity 𝜔 − 𝑥0
𝑎𝑥0 𝑃𝐿𝐿𝐴(𝑡 0) = 𝑎𝑥[ℱ00 ] (𝑡0) − ℒℱ(𝑡0), (9) with ℒℱ(𝑡0) = ∑ 𝐸ℚ 𝜔−𝑥0 𝑘=1 [𝐵(0, 𝑘) ∙ 𝑝𝑘 𝑥[ℱ0𝑘 ] (𝑡𝑘) ∙ (1 − 𝐼𝑡0+𝑘) + |ℱ], (10)
where 𝑎+≔ 𝑚𝑎𝑥(𝑎, 0) is the positive part of 𝑎 ∈ ℝ. The longevity floor can be decomposed into a portfolio of European-style longevity floorlets with common constant strike and maturities matching the annuity payment dates. Similar equations may be derived for a deferred PLLA due with a deferral period of 𝑢 years.
3.
M
ODEL ANDC
ALIBRATION3.1.Mortality forecasting using Bayesian Model Ensemble
We assume the PLLA’s payoff is dependent on the dynamics of the longevity index computed for Taiwan general male population and that individual mortality rates evolve independently from the financial market.
20.ª Conferência da Associação Portuguesa de Sistemas de Informação (CAPSI’2020) 7 Contrary to previous studies that use a single model to forecast mortality rates, in this paper we develop a novel approach based on a Bayesian Model Ensemble (BME) of six well known Generalised Age-Period-Cohort (GAPC) stochastic mortality models. Ensemble learning methods train several baseline models and use rules to combine them together to make predictions. It is an innovative statistical approach to inference in the presence of multiple competing statistical models. When compared to a single model, ensemble learning has demonstrated to improve traditional and machine learning forecasting results and has been widely applied in social and health science areas (see, e.g., Kontis et al., 2017; Bravo and Coelho, 2019; Bravo et al., 2020). Ensemble methods offer an additional advantage in that they reduce the inherent uncertainty in the choice of the appropriate projection model (model risk) and in that they account for more sources of risk, overcoming the problem of drawing conclusions based on a single deemed to be "best" model. Let 𝑦 denote a quantity to be forecasted based on training data 𝑦𝑇 using 𝐾 statistical models {𝑀
1, . . . , 𝑀𝐾}. The law of total probability tells us that the forecast PDF, 𝑝(𝑦), is given by
𝑝(𝑦) = ∑ 𝑝(𝑦|𝑀𝐾) ∙ 𝑝(𝑀𝐾|𝑦𝑇)
𝐾
𝑘=1
(11)
where 𝑝(𝑦|𝑀𝐾) denotes the forecast PDF based on model 𝑀𝐾 alone, and 𝑝(𝑀𝐾|𝑦𝑇) is the posterior probability of model 𝑀𝐾 being correct given the training data, thus reflecting how well model 𝑀𝐾 fits the training data. The posterior model probabilities add up to one, i.e., ∑𝐾𝑘=1𝑝(𝑀𝐾|𝑦𝑇) = 1 and can be interpreted as weights. The BME PDF is a weighted average of the PDFs given the individual models, weighted by their posterior model probabilities (Raftery et al., 2005).
Let 𝐷𝑥,𝑡 denote the number of deaths recorded at age 𝑥 during calendar year 𝑡 from the population initially (𝐸𝑥,𝑡0 ) or centrally (𝐸𝑥,𝑡𝑐 ) exposed-to-risk. We follow Hunt and Blake (2015) and adopt a GAPC stochastic mortality model framework to describe the individual models used in this study. A stochastic GAPC model links a response variable (𝑞𝑥,𝑡 or 𝜇𝑥,𝑡) to an appropriate linear predictor 𝜂𝑥,𝑡, capturing the systematic effects of age 𝑥, calendar year 𝑡 and year-of-birth (cohort) 𝑐 = 𝑡 − 𝑥, given by
𝜂𝑥,𝑡 = 𝛼𝑥+ ∑ 𝛽𝑥 (𝑖) 𝜅𝑡(𝑖) 𝑁 𝑖=1 + 𝛽𝑥 (0) 𝛾𝑡−𝑥, (12)
where 𝑒𝑥𝑝(𝛼𝑥) denotes the general shape of the mortality schedule across age, 𝛽𝑥 (𝑖)
𝜅𝑡(𝑖) is a set of 𝑁 age-period terms describing the mortality trends, with each time index 𝜅𝑡(𝑖) contributing in specifying the general mortality trend and 𝛽𝑥
(𝑖)
modulating its effect across ages, and the term 𝛾𝑡−𝑥 accounts for the cohort effect with 𝛽𝑥 (0) modulating its effect across ages. The framework assumes the number of deaths follows a Poisson 𝐷𝑥,𝑡~𝒫(𝜇𝑥,𝑡𝐸𝑥,𝑡𝑐 ) or a Binomial distribution 𝐷𝑥,𝑡~ℬ(𝑞𝑥,𝑡𝐸𝑥,𝑡0 ) with 𝔼(𝐷𝑥,𝑡/𝐸𝑥,𝑡𝑐 ) = 𝜇𝑥,𝑡 and 𝔼(𝐷𝑥,𝑡/𝐸𝑥,𝑡0 ) = 𝑞𝑥,𝑡, respectively (Villegas et al., 2018). The specification is complemented with a set of parameter constraints to ensure unique parameter estimates.
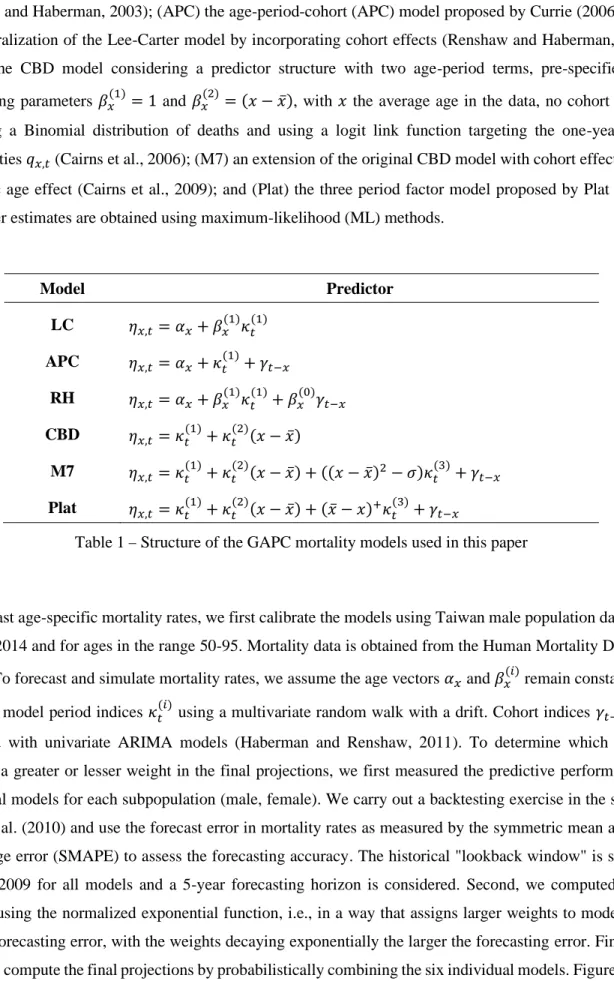
20.ª Conferência da Associação Portuguesa de Sistemas de Informação (CAPSI’2020) 8 Table 1 summarizes the structure of the GAPC mortality models considered in this paper. The set of models includes: (LC) the standard age-period Lee-Carter model under a Poisson setting (Brouhns et al., 2002; Renshaw and Haberman, 2003); (APC) the age-period-cohort (APC) model proposed by Currie (2006); (RH) the generalization of the Lee-Carter model by incorporating cohort effects (Renshaw and Haberman, 2006); (CBD) the CBD model considering a predictor structure with two period terms, pre-specified age-modulating parameters 𝛽𝑥(1) = 1 and 𝛽𝑥(2)= (𝑥 − 𝑥̅), with 𝑥 the average age in the data, no cohort effects, assuming a Binomial distribution of deaths and using a logit link function targeting the one-year death probabilities 𝑞𝑥,𝑡 (Cairns et al., 2006); (M7) an extension of the original CBD model with cohort effects and a quadratic age effect (Cairns et al., 2009); and (Plat) the three period factor model proposed by Plat (2009). Parameter estimates are obtained using maximum-likelihood (ML) methods.
Model Predictor LC 𝜂𝑥,𝑡 = 𝛼𝑥+ 𝛽𝑥 (1) 𝜅𝑡(1) APC 𝜂𝑥,𝑡 = 𝛼𝑥+ 𝜅𝑡 (1) + 𝛾𝑡−𝑥 RH 𝜂𝑥,𝑡 = 𝛼𝑥+ 𝛽𝑥 (1) 𝜅𝑡(1)+ 𝛽𝑥 (0) 𝛾𝑡−𝑥 CBD 𝜂𝑥,𝑡 = 𝜅𝑡 (1) + 𝜅𝑡(2)(𝑥 − 𝑥̅) M7 𝜂𝑥,𝑡 = 𝜅𝑡 (1) + 𝜅𝑡(2)(𝑥 − 𝑥̅) + ((𝑥 − 𝑥̅)2− 𝜎)𝜅 𝑡 (3) + 𝛾𝑡−𝑥 Plat 𝜂𝑥,𝑡 = 𝜅𝑡 (1) + 𝜅𝑡(2)(𝑥 − 𝑥̅) + (𝑥̅ − 𝑥)+𝜅 𝑡 (3) + 𝛾𝑡−𝑥
Table 1−Structure of the GAPC mortality models used in this paper
To forecast age-specific mortality rates, we first calibrate the models using Taiwan male population data from 1980 to 2014 and for ages in the range 50-95. Mortality data is obtained from the Human Mortality Database (2019). To forecast and simulate mortality rates, we assume the age vectors 𝛼𝑥 and 𝛽𝑥
(𝑖)
remain constant over time and model period indices 𝜅𝑡(𝑖) using a multivariate random walk with a drift. Cohort indices 𝛾𝑡−𝑥 were modelled with univariate ARIMA models (Haberman and Renshaw, 2011). To determine which models received a greater or lesser weight in the final projections, we first measured the predictive performance of individual models for each subpopulation (male, female). We carry out a backtesting exercise in the spirit of Dowd et al. (2010) and use the forecast error in mortality rates as measured by the symmetric mean absolute percentage error (SMAPE) to assess the forecasting accuracy. The historical "lookback window" is set from 1980 to 2009 for all models and a 5-year forecasting horizon is considered. Second, we computed model weights using the normalized exponential function, i.e., in a way that assigns larger weights to models with smaller forecasting error, with the weights decaying exponentially the larger the forecasting error. Finally, in step 3 we compute the final projections by probabilistically combining the six individual models. Figure 1 plots
20.ª Conferência da Associação Portuguesa de Sistemas de Informação (CAPSI’2020) 9 the crude mortality rates by year (1980-2014) and age (50-95) for Taiwan's male population. We can observe a clear downward trend in the mortality rates at all ages and years, more pronounced in the age range 60-85.
Figure 1 –Taiwan: Crude mortality rates by year (1980-2014) and age (50-95), male population
For pricing purposes, we need to consider the market price of longevity risk (Bravo and Nunes, 2020). Since the underlying longevity index is not an existing tradable asset in a liquid market, we use a distortion operator to create an equivalent risk-adjusted probability distribution for 𝑞𝑥,𝑡 or 𝜇𝑥,𝑡 to compute the fair value of the derivative security, an approach recommended when pricing long-term contracts (Blake et al., 2006).3 To be
3 Alternative approaches have been proposed to price longevity-linked securities, including the arbitrage-free pricing framework of interest-rate derivatives (see, e.g., Cairns et al., 2006), using the instantaneous Sharpe ratio (see, e.g., Milevsky et al., 2005), adopting the Equivalent Utility Pricing Principle (see, e.g., Cui, 2008), the CAPM- and CCAPM-based approaches (see, e.g., Friedberg and Webb, 2006) or the cost of capital approach.
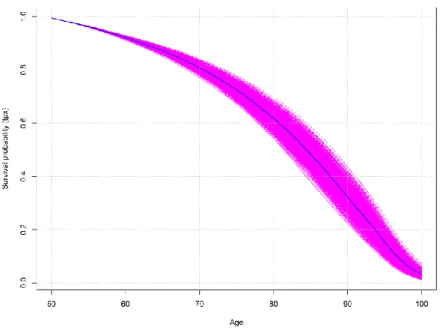
20.ª Conferência da Associação Portuguesa de Sistemas de Informação (CAPSI’2020) 10 more specific, we use the flexible risk-neutral simulation approach proposed by Boyer and Stentoft (2013) using the classical Wang transform as a risk measure (Wang, 2002). This method involves risk-neutralizing the innovations in stochastic mortality models that assume Gaussianity to represent mortality process risk (e.g., members of the GAPC family of models) using the Wang distortion operator 𝜆. For a given parameter 𝜆 ∈ (0; 0.3), a simulation consists of 𝑁 = 10000 trajectories for the cohort survival probability and the longevity index. Figure 2 presents a fan plot of the simulated survival probability of a cohort aged 50 in 2014 over 10000 replications.
Figure 2 – Fan plot of simulated survival probability of the male cohort aged 50 in 2014
Finally, to close the prospective life tables at high ages and to establish the highest attainable age 𝜔, we use the Denuit and Goderniaux (2005) method with ultimate age set at 𝜔 = 125 for all years.
3.2.Financial market
In a risk-neutral, frictionless and continuous financial market, we assume the annuity provider invests the insurance premia collected into a portfolio of dividend-paying stocks (30%) and straight 10-year coupon bonds (70%). Regular bond coupon and dividend payments are invested in a riskless short-term bank account until the next (annual) portfolio rebalancing period. At the beginning of each year, the insurance company pays annuitants benefits from asset income and from assets sold at market prices. Depending on the insurer's mortality and investment experience, annuitants may receive surplus payments in addition to their guaranteed return. This surplus is generated when observed policyholder mortality exceeds that assumed at contract inception, and/or when total investment return exceeds the guaranteed return. We assume that the insurer's solvency capital always exceeds a pre-specified solvency limit such that the period's total surplus can be fully paid out to annuitants. We assume the yield curve dynamics is well captured by a two-factor equilibrium Vasicek (1977) model. The model proved to explain significantly more yield curve shifts that are observed at
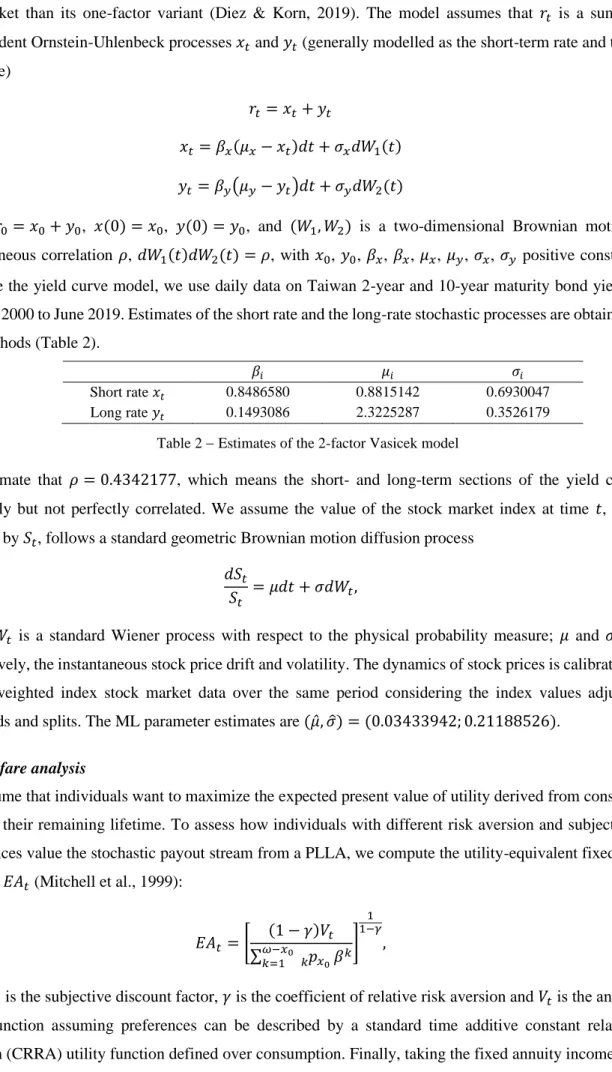
20.ª Conferência da Associação Portuguesa de Sistemas de Informação (CAPSI’2020) 11 the market than its one-factor variant (Diez & Korn, 2019). The model assumes that 𝑟𝑡 is a sum of two independent Ornstein-Uhlenbeck processes 𝑥𝑡 and 𝑦𝑡 (generally modelled as the short-term rate and the long-term rate)
𝑟𝑡 = 𝑥𝑡 + 𝑦𝑡
𝑥𝑡 = 𝛽𝑥(𝜇𝑥− 𝑥𝑡)𝑑𝑡 + 𝜎𝑥𝑑𝑊1(𝑡) 𝑦𝑡= 𝛽𝑦(𝜇𝑦− 𝑦𝑡)𝑑𝑡 + 𝜎𝑦𝑑𝑊2(𝑡)
(13)
where 𝑟0= 𝑥0+ 𝑦0, 𝑥(0) = 𝑥0, 𝑦(0) = 𝑦0, and (𝑊1, 𝑊2) is a two-dimensional Brownian motion with instantaneous correlation 𝜌, 𝑑𝑊1(𝑡)𝑑𝑊2(𝑡) = 𝜌, with 𝑥0, 𝑦0, 𝛽𝑥, 𝛽𝑥, 𝜇𝑥, 𝜇𝑦, 𝜎𝑥, 𝜎𝑦 positive constants. To calibrate the yield curve model, we use daily data on Taiwan 2-year and 10-year maturity bond yields from January 2000 to June 2019. Estimates of the short rate and the long-rate stochastic processes are obtained using ML methods (Table 2).
𝛽𝑖 𝜇𝑖 𝜎𝑖
Short rate 𝑥𝑡 0.8486580 0.8815142 0.6930047
Long rate 𝑦𝑡 0.1493086 2.3225287 0.3526179
Table 2 − Estimates of the 2-factor Vasicek model
We estimate that 𝜌 = 0.4342177, which means the short- and long-term sections of the yield curve are positively but not perfectly correlated. We assume the value of the stock market index at time 𝑡, which is denoted by 𝑆𝑡, follows a standard geometric Brownian motion diffusion process
𝑑𝑆𝑡 𝑆𝑡
= 𝜇𝑑𝑡 + 𝜎𝑑𝑊𝑡, (14)
where 𝑊𝑡 is a standard Wiener process with respect to the physical probability measure; 𝜇 and 𝜎 denote, respectively, the instantaneous stock price drift and volatility. The dynamics of stock prices is calibrated to the TSEC weighted index stock market data over the same period considering the index values adjusted for dividends and splits. The ML parameter estimates are (𝜇̂, 𝜎̂) = (0.03433942; 0.21188526).
3.3.Welfare analysis
We assume that individuals want to maximize the expected present value of utility derived from consumption through their remaining lifetime. To assess how individuals with different risk aversion and subjective time preferences value the stochastic payout stream from a PLLA, we compute the utility-equivalent fixed annuity income, 𝐸𝐴𝑡 (Mitchell et al., 1999):
𝐸𝐴𝑡 = [ (1 − 𝛾)𝑉𝑡 ∑ 𝑘 𝑥𝑝 0 𝜔−𝑥0 𝑘=1 𝛽𝑘 ] 1 1−𝛾 , (15)
where 𝛽 is the subjective discount factor, 𝛾 is the coefficient of relative risk aversion and 𝑉𝑡 is the annuitant’s value function assuming preferences can be described by a standard time additive constant relative risk aversion (CRRA) utility function defined over consumption. Finally, taking the fixed annuity income (15) we
20.ª Conferência da Associação Portuguesa de Sistemas de Informação (CAPSI’2020) 12 compute the fair value of the utility-equivalent fixed life annuity (EFLA) that delivers the same lifetime utility as the PLLA and compare it with that of a fixed level life annuity. In the simulations, we consider three alternative time preference and risk aversion parameters. For the subjective discount factor, we consider individuals that are 𝛽=0.98 (patient), 𝛽=0.96 (normal) and 𝛽=0.94 (impatient). For the coefficient of relative risk aversion, we classify policyholders as 𝛾=2 (low risk), 𝛾=5 (medium risk) and 𝛾=10 (high risk).
4.
R
ESULTS AND DISCUSSION4.1.Base Case
Table 3 reports the mean of the simulated risk-neutral distribution of the annuity and longevity option prices for some representative ages and different values of the market price of longevity risk in the baseline scenario. We assume in this case: (i) a guaranteed interest rate of 0% per year, (ii) the reference life table is given by the mean of the simulated survival trajectories with zero longevity risk premium, (iii) the contract is non-participating and pays an initial benefit of one monetary unit per year, and (iv) annuity payments are capped at the initial benefit. Each simulation consists of 10.000 independent sample paths for both the survival probability of a cohort aged 𝑥 in 2014 { 𝑝𝑘 𝑥0(2014): 𝑥0∈ [50,90] } and the portfolio returns. Panel A reports the pure premium 𝑎𝑥[ℱ00](𝑡
0) of a fixed immediate life annuity purchased at representative ages. Recall that for
𝑖𝑡0= 0%, the value of 𝑎𝑥0
[ℱ0](𝑡
0) matches that of the remaining life expectancy at age 𝑥0. The baseline interest
rate scenario resembles the current debt market conditions in Taiwan and in most G20 and OECD countries. Panels B and C report, respectively, the fair value of the embedded European-style longevity floor options (with constant unit strike price and maturity 𝜔 − 𝑥0) for alternative values of the longevity risk premium in absolute and relative terms (i.e., as a percentage of 𝑎𝑥[ℱ00](𝑡
0), in basis points), and Panel D reports the fair value of a non-participating PLLA together with the corresponding 95% confidence interval bounds.
As expected, the fair value of a fixed annuity 𝑎𝑥[ℱ00](𝑡
0) is smaller the older the policyholder at contract initiation, i.e., decreases with the reduction in the remaining life expectancy (Panel A). Similarly, the longevity floor prices are increasing in maturity (decreasing with the age of the policyholder at contract inception) and in the market price of risk (Panel B). For instance, for 𝜆 = 0 the longevity option price for a 50-year old individual at the end of 2014 is 0.54, whereas for an equivalent contract starting at age 65 the price is 0.35. For 𝜆 = 0.3, the longevity floor option price increases to 1.92 (0.96) for a 50 (65)-year old individual. The embedded European-style longevity floor prices represent between 0.78% and 5.93% of the pure premium of a conventional fixed annuity (Panel C). This means, for instance, that a 50-year old male individual entering into a non-participating LLA contract should pay a pure single premium 5.93% smaller than that of an equivalent fixed annuity (for 𝜆 = 0.3) to accept the chance of annuity benefits declining if observed survivorship rates are higher than predicted. For this representative case, the 95% confidence interval for the mean estimate of the fair value is [28.30−32.62] with mean estimate 30.46 (Panel D).
20.ª Conferência da Associação Portuguesa de Sistemas de Informação (CAPSI’2020) 13
Age 50 55 60 65 70 75 80 85 90
Panel A: Pure premium of a fixed life annuity
𝑎𝑥0
[ℱ0](𝑡
0) 32.38 27.63 23.07 18.76 14.77 11.22 8.19 5.74 3.85
Panel B: Longevity Floor price ℒℱ(𝑡0)
λ=0.0 0.54 0.48 0.42 0.35 0.26 0.20 0.12 0.06 0.03 λ=0.1 0.92 0.78 0.65 0.51 0.38 0.26 0.17 0.09 0.05 λ=0.2 1.38 1.16 0.93 0.72 0.53 0.35 0.21 0.11 0.05 λ=0.3 1.92 1.59 1.28 0.96 0.69 0.45 0.26 0.14 0.06 Panel C:ℒℱ(𝑡0) as a % of 𝑎𝑥0 [ℱ0](𝑡 0) (in b.p) λ=0.0 167 174 182 184 173 174 147 105 78 λ=0.1 283 282 280 272 254 227 201 157 117 λ=0.2 426 418 403 384 355 307 256 183 117 λ=0.3 593 575 553 512 467 401 311 235 156
Panel D: Pure premium of a non-participating PLLA 𝑎𝑥0
𝑃𝐿𝐿𝐴(𝑡 0) λ=0.0 (mean) 31.84 27.15 22.65 18.42 14.52 11.03 8.07 5.68 3.82 UB 95% 33.23 28.36 23.65 19.18 15.01 11.28 8.15 5.69 3.82 LB 95% 30.45 25.94 21.65 17.65 14.02 10.77 7.99 5.67 3.82 λ=0.1 (mean) 31.47 26.85 22.43 18.25 14.40 10.97 8.03 5.65 3.81 UB 95% 33.21 28.35 23.65 19.17 14.99 11.26 8.12 5.67 3.81 LB 95% 29.72 25.35 21.20 17.33 13.80 10.67 7.93 5.63 3.80 λ=0.2 (mean) 32.38 26.48 22.14 18.04 14.25 10.88 7.98 5.64 3.81 UB 95% 34.38 28.20 23.54 19.08 14.92 11.21 8.09 5.65 3.81 LB 95% 30.38 24.75 20.74 17.00 13.57 10.54 7.87 5.62 3.80 λ=0.3 (mean) 30.46 26.04 21.80 17.80 14.08 10.77 7.94 5.61 3.79 UB 95% 32.62 27.90 23.32 18.94 14.82 11.14 8.05 5.62 3.79 LB 95% 28.30 24.18 20.27 16.66 13.34 10.40 7.82 5.59 3.79
Table 3 − Fair value of non-participating PLLA and embedded longevity floor option prices
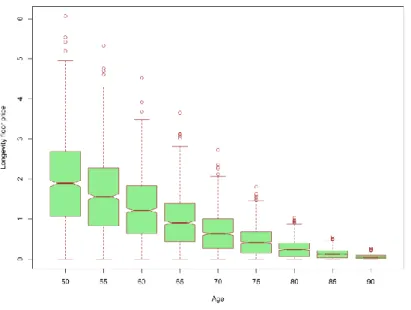
Figure 3 offers additional insight into the simulated risk-neutral distribution of longevity option prices for 𝜆 = 0.3. The variability of option prices is naturally higher at younger ages given the higher uncertainty regarding the remaining lifetime prospects at these ages, decreasing then steadily with age. These results are in line with those obtained by Bravo and El Mekkaoui de Freitas (2018) using data for France, although in this later case the higher trend risk observed in the French population resulted in higher longevity option prices.
Table 4 reports the mean of the simulated risk-neutral distribution of the pure premium of a deferred non-participating PLLA due assuming a deferment period of 15 year (𝑢 = 15). The prices of both the fixed and PLLA deferred contracts are now naturally smaller than that of immediate annuities at all ages and values of the market price of longevity risk since the number of potential annuity payments is reduced. For instance, for a 50-year old male individual the fair value of the deferred non-participating PLLA contract is now 55.4% (16.89) of that of the corresponding immediate annuity (30.46) for 𝜆 = 0.3. For contracts initiating at older
20.ª Conferência da Associação Portuguesa de Sistemas de Informação (CAPSI’2020) 14 ages the annuity and longevity option prices decrease substantially and the confidence intervals are narrower since the number of potential annuity payments is smaller, and the survival probabilities are minimal. This makes the product potentially interesting for both providers and annuitants.
Figure 3 – Boxplot of the simulated risk-neutral distribution of longevity option prices
Empirical studies have shown that retirees are reluctant to convert retirement savings into annuities and that the levels of voluntary annuitization are low. As a result, insurance companies are putting a lot of effort to design more attractive annuity products. Deferred PLLA contracts, eventually incorporating bounds to the annuity benefit to limit the volatility of retirement income, are an interesting solution for the payout phase of pension schemes since it requires a smaller initial investment than immediate PLLAs and provide similar longevity insurance for the oldest-old.
Moving now to contract structures in which the annuity benefit is bounded by some caps and floors, Table 5 reports the monetary prices of European-style longevity floor options embedded in non-participating capped PLLAs for different constant threshold levels and selected ages at contract initiation. For instance, the case [𝐼𝑡𝑚𝑖𝑛0+𝑘, 𝐼𝑡𝑚𝑎𝑥0+𝑘] = [0.8; 1.2] corresponds to a PLLA structure with 𝐼𝑡𝑚𝑖𝑛0+𝑘 = 𝐼𝑚𝑖𝑛= 0.8 and 𝐼𝑡𝑚𝑎𝑥0+𝑘= 𝐼𝑚𝑎𝑥 = 1.2 for 𝑘 = 1, … , 𝜔 − 𝑥0, i.e., annuity payments can decline (increase) by a maximum of 20% of the initial benefit if observed survivorship rates are higher (lower) than predicted. The case [𝐼𝑡𝑚𝑖𝑛0+𝑘, 𝐼𝑡𝑚𝑎𝑥0+𝑘] = [0.0; 2.0] refers to a structure in which all risk is transferred to annuitants, i.e., to a non-capped PLLA.
The results in Table 5 show that for a 60-year old male individual entering a PLLA contract allowing for a maximum 10% variation in annuity payments the longevity floor price reduces from 1.28 in the non-capped equivalent structure to 0.90 (-29.4%). Stated differently, limiting the longevity risk borne by annuitants reduces the price discount to be offered in PLLAs when compared to both a traditional fixed annuity and the uncapped PLLA.
20.ª Conferência da Associação Portuguesa de Sistemas de Informação (CAPSI’2020) 15
Age 50 55 60 65 70 75
Panel A: Pure premium of a deferred fixed life annuity
𝑎̈ 𝑢| 𝑥[ℱ00
]
(𝑡0) 18.51 14.01 9.88 6.27 3.40 1.45
Panel B: Deferred Longevity Floor price ℒ𝑢ℱ(𝑡0)
λ=0.0 0.46 0.40 0.33 0.25 0.16 0.08 λ=0.1 0.77 0.65 0.52 0.38 0.23 0.12 λ=0.2 1.17 0.96 0.75 0.53 0.34 0.16 λ=0.3 1.63 1.33 1.03 0.73 0.44 0.21 Panel C:ℒ𝑢ℱ(𝑡0) as a % of 𝑢| 𝑥𝑎̈ 0 [ℱ0](𝑡 0) (in b.p) λ=0.0 246 288 329 394 459 537 λ=0.1 414 464 527 601 688 806 λ=0.2 632 687 763 850 994 1075 λ=0.3 878 947 1040 1161 1300 1433 246 288 329 394 459 537
Panel D: Pure premium of a non-participating deferred PLLA 𝑢| 𝑥𝑎̈ 0
𝑃𝐿𝐿𝐴(𝑡 0) λ=0.0 (mean) 18.06 13.60 9.55 6.03 3.24 1.37 UB 95% 19.45 14.82 10.56 6.79 3.74 1.62 LB 95% 16.67 12.39 8.55 5.26 2.75 1.12 λ=0.1 (mean) 17.75 13.36 9.36 5.90 3.17 1.33 UB 95% 19.49 14.86 10.58 6.81 3.76 1.63 LB 95% 16.00 11.86 8.13 4.98 2.57 1.04 λ=0.2 (mean) 18.51 13.05 9.12 5.74 3.06 1.30 UB 95% 20.52 14.77 10.52 6.78 3.74 1.63 LB 95% 16.51 11.32 7.72 4.70 2.39 0.96 λ=0.3 (mean) 16.89 12.68 8.85 5.54 2.96 1.24 UB 95% 19.05 14.54 10.37 6.69 3.70 1.61 LB 95% 14.73 10.82 7.33 4.40 2.22 0.87
Table 4 − Fair value of non-participating deferred PLLAs
Our results also show that the fair value of the longevity floor and, consequently, the fair value of the capped PLLA converges steadily to that of the equivalent uncapped annuity design the larger the fraction of unexpected mortality improvements that is transferred to annuitants. We can observe that allowing for a maximum of 20% variation in annuity benefits transfers close to 90% of the longevity risk to annuitants. Partial risk-sharing annuity structures are an interesting alternative to cope with longevity risk when compared to, for instance, expensive longevity-linked reinsurance arrangements, increasing pricing loadings which reduce the attractiveness of annuity contracts or allocating more solvency capital.
20.ª Conferência da Associação Portuguesa de Sistemas de Informação (CAPSI’2020) 16 Age [𝐼𝑡𝑚𝑖𝑛0+𝑘, 𝐼𝑡𝑚𝑎𝑥0+𝑘] 50 55 60 65 70 75 80 85 90 [0.9;1.1] 1.31 1.11 0.90 0.71 0.53 0.36 0.23 0.12 0.06 [0.8;1.2] 1.70 1.43 1.16 0.89 0.65 0.44 0.26 0.14 0.06 [0.7;1.3] 1.85 1.53 1.23 0.95 0.68 0.45 0.26 0.14 0.06 [0.6;1.4] 1.89 1.58 1.26 0.96 0.68 0.45 0.26 0.14 0.06 [0.5;1.5] 1.91 1.59 1.26 0.96 0.68 0.45 0.26 0.14 0.06 [0.4;1.6] 1.91 1.59 1.26 0.96 0.68 0.45 0.26 0.14 0.06 [0.3;1.7] 1.92 1.59 1.28 0.96 0.69 0.45 0.26 0.14 0.06 [0.2;1.8] 1.92 1.59 1.28 0.96 0.69 0.45 0.26 0.14 0.06 [0.1;1.9] 1.92 1.59 1.28 0.96 0.69 0.45 0.26 0.14 0.06 [0.0;2.0] 1.92 1.59 1.28 0.96 0.69 0.45 0.26 0.14 0.06
Table 5 − Capped PLLA: Longevity floor option prices ℒℱ(𝑡0|𝐼𝑡0+𝑘
𝑚𝑖𝑛, 𝐼 𝑡0+𝑘
𝑚𝑎𝑥)
4.2.Individual preferences and willingness-to-pay for the contract
We consider individuals' preferences towards risk and evaluate the willingness-to-pay (WTP) for the contracts by computing the fair value of the EFLA that delivers the same lifetime utility as the PLLA. Table 6 reports the mean EFLA results for participating PLLAs considering three alternative time preference and risk aversion parameters. We assume the market price of longevity risk parameter is 𝜆 = 0.3 and the guaranteed interest rate is 𝑖 = 0%. For every age, the WTP results compare with that of a fixed life annuity. For instance, the WTP for a non-participating LLA for a 65-year old male policyholder with medium risk aversion (𝛾 = 5) and normal (𝛽 = 0.96) intertemporal preference is 16.31, a price that represents 95.6% of that of the corresponding fixed annuity. Non-participating PLLAs transfer all systematic longevity risk to policyholders and do not offer the upside potential of positive financial developments, reducing the utility drawn by high risk aversion and impatient annuitants from uncertain and potentially volatile annuity benefits. Consequently, policyholders will only be willing to enter the contract at a given price discount relatively to a standard fixed annuity. Alternatively, they would be willing to pay the same premium in exchange for a higher payout stream when compared to fixed annuities.
The results in Table 6 also show that, for all ages and time preference and risk aversion parameters, the WTP for a participating PLLAs is higher than for a non-participating structure. For instance, the WTP for a PLLA for a 60-year old male policyholder with low risk aversion (𝛾 = 2) and low (𝛽 = 0.98) intertemporal preference is 23.94. Policyholders value favourably the possibility to profit from positive financial market developments (negative scenarios are bounded by the guaranteed interest rate) despite the increased variability in annuity benefits from the combined effect of longevity and financial market risks. The WTP for participating PLLAs is higher the lower the guaranteed interest rate. In a low (zero) interest rate environment, the upside potential carried by a PLLAs is more valued and can be sufficient to offset the disutility generated by lower
20.ª Conferência da Associação Portuguesa de Sistemas de Informação (CAPSI’2020) 17 annuity payments if observed survival prospects are higher than anticipated. Similar conclusions were obtained for participating and non-participating capped PLLAs and deferred annuity structures.4
Parameters Age 𝜷 𝜸 50 55 60 65 70 75 80 85 90 2 33.90 28.80 23.94 19.42 15.25 11.58 8.47 5.94 3.98 0.98 5 32.29 27.43 22.81 18.50 14.53 11.03 8.07 5.65 3.79 10 31.53 26.78 22.26 18.06 14.18 10.77 7.87 5.52 3.70 2 33.56 28.34 23.37 18.75 14.51 10.79 7.63 5.51 3.81 0.96 5 31.00 26.69 21.72 17.17 13.94 10.31 7.20 5.08 3.58 10 29.93 25.60 21.74 17.15 13.00 10.27 7.18 4.97 3.57 2 33.03 27.74 22.71 18.03 14.01 10.24 6.95 5.08 3.72 0.94 5 29.23 25.63 20.44 16.65 13.28 9.58 6.87 4.91 3.53 10 28.62 24.59 21.28 16.57 12.74 9.76 6.75 4.87 3.51
Table 6 − WTP (EFLA) for PLLAs
4.3.Sensitivity to Asset Allocation
In the baseline scenario we assumed a static conservative asset allocation strategy. In real world investment environments, this involves setting target allocations for the asset classes (e.g., stocks, bonds) in which the annuity provider's portfolio is invested and periodically rebalancing to match the original allocations when, for instance, there are coupon/dividend payments and/or existing bonds mature and new issues start to be traded. This is often a buy-and-hold strategy. In this section we investigate the sensitivity of our results to alternative asset allocations, particularly a more aggressive lifecycle strategy. This strategy allocates 70% of the portfolio to stocks at contract inception and the remaining to coupon bonds, with the risky assets gradually reduced to 30% at the end of the investment horizon. As the allocation to stocks is reduced, the allocation to debt instruments is increased, with the provider switching to the baseline conservative asset allocation strategy at the end of the horizon. Milevsky and Promislow (2001) suggest the need for holding a substantial stock allocation in retirement portfolios to enhance pension income.
Table 7 reports the mean WTP (EFLA) results for the lifecycle asset allocation strategy for participating LLAs considering alternative time preference and risk aversion parameters. The results suggest that augmenting the exposure to stock markets early in the contract's life increases the expected annuity payments and benefit volatility. The enhanced right tail of the portfolio return distribution is positively valued by policyholders, particularly patient and low risk aversion individuals who appreciate the possibility of higher investment returns. In contrast, the increased variability in portfolio returns generated by the lifecycle asset allocation strategy acts against impatient and high-risk aversion annuitants since it makes it more difficult for retirement planning compared to a conservative (low risk) asset allocation strategy.
4 We conducted a sensitivity analysis on the impact of the GIR on the WTP for PLLAs and concluded that for participating contracts higher guaranteed interest rates reduce the initial benefits and diminish the expected distributed surplus and upside potential when compared to a standard fixed annuity.
20.ª Conferência da Associação Portuguesa de Sistemas de Informação (CAPSI’2020) 18 Parameters Age 𝜷 𝜸 50 55 60 65 70 75 80 85 90 2 35.93 30.49 25.33 20.52 16.10 12.22 8.92 6.24 4.17 0.98 5 33.88 28.75 23.88 19.35 15.19 11.52 8.41 5.88 3.93 10 32.75 27.79 23.08 18.70 14.67 11.13 8.12 5.68 3.80 2 35.57 30.01 24.72 19.81 15.32 11.38 8.03 5.79 3.99 0.96 5 32.53 27.97 22.74 17.96 14.56 10.77 7.50 5.28 3.72 10 31.08 26.57 22.54 17.76 13.45 10.62 7.41 5.12 3.67 2 35.01 29.37 24.02 19.04 14.79 10.80 7.32 5.33 3.90 0.94 5 30.67 26.86 21.40 17.41 13.88 10.00 7.17 5.10 3.66 10 28.45 24.52 21.29 16.63 12.82 9.85 6.83 4.95 3.58
Table 7 − WTP (EFLA) for participating PLLA with lifecycle asset allocation strategy
5.
C
ONCLUSIONParticipating longevity-linked life annuities include embedded longevity and financial options that allow the annuity provider to periodically revise annuity payments if observed survivorship and portfolio outcomes deviate from expected (or guaranteed) values at contract initiation. Contrary to standard fixed annuities in which the insurer bears all risk, PLLAs offer an efficient and transparent way of sharing biometric and financial market risks between annuity providers and policyholders. They are an interesting and promising product for the payout phase of pension schemes since the contract tackles some of the demand- and supply-side constraints that prevent individuals from annuitizing their retirement wealth and may contribute to help insurers writing new annuity policies. By linking the annuity benefit to the survival experience of a given underlying population and to the performance of the asset portfolio backing the contract PLLAs provide a direct mechanism to share financial and longevity risk and are an interesting alternative to manage systematic longevity risk in markets in which alternative risk management solutions (longevity-linked securities, reinsurance arrangements, capital allocation) are scarce and/or expensive.
In this paper we empirically investigated the design and valuation of index-type participating longevity-linked life annuities using Taiwan (mortality, yield curve and stock market) data from January 1980 to June 2019, considering for both immediate and deferred, capped and uncapped participating and non-participating annuity structures. We expanded previous research by adopting a novel approach based on a Bayesian Model Ensemble of multiple generalised age-period-cohort stochastic mortality models, by investigating the robustness of results against alternative asset allocation strategies and different values for the guaranteed interest rate. The use of a Bayesian Model Ensemble allows us to explicitly capture model risk. This is the first study that provides empirical results of PLLA valuation for Asian annuity markets, in a scenario in which building post-retirement income in Asian countries is crucial due to faster than predicted longevity improvements.
Considering for alternative cohorts and values for the market price of longevity risk, our results show that the fair value of PLLAs should be lower than that of a traditional fixed annuity by up to 6% for annuitants to accept to share the impact of adverse longevity developments. The longevity floor prices embedded in PLLA decline with the age of the policyholder at contract inception and with the market price of longevity risk. The variability
20.ª Conferência da Associação Portuguesa de Sistemas de Informação (CAPSI’2020) 19 of PLLA benefits and price is higher the younger the policyholder at contract initiation. Compared to immediate annuities, deferred PLLA contracts, eventually including for caps and floors, are an interesting solution for the payout phase of pension schemes since in exchange for a significantly smaller premium they provide protection against ones' outliving their (financial, housing, pension) wealth at old ages. Our results suggest that considering for a maximum of 20% variation in annuity benefits transfers close to 90% of the longevity risk to annuitants, allowing insurers to release some of substantial capital buffer they are required to hold to back annuity portfolios and limit default risk. The empirical results show that individuals with low risk aversion and low intertemporal preference value positively the chance to profit from right tail financial market developments in participating PLLAs (negative scenarios are bounded by the GIR) despite increased variability in annuity benefits. The adoption of a riskier lifecycle asset allocation strategy early in the contract's life increases the expected annuity payments and benefit volatility, a feature that is positively valued by patient and low risk aversion policyholders who appreciate the chance of higher investment returns. Further research should investigate the robustness of these results against changes in the method used to risk-neutralize the innovations in the stochastic mortality model used for forecasting or to account for the longevity risk premium (e.g., by adopting a cost of capital Solvency II approach). Further research is also needed to design and valuate alternative methods to directly share longevity risk between the provider and annuitants (e.g., by linking the benefits to periodically revised annuity factors). Further research is also needed to develop alternative methods for the valuation of the financial and longevity options embedded in PLLAs.
R
EFERENCESAlho, J., Bravo, J. M. and Palmer, E. (2013). Annuities and life expectancy in NDC. In R. Holzmann, E. Palmer, D. Robalino (eds.), Non-Financial Defined Contribution Pension Schemes in a Changing Pension World, Volume 2: Gender, Politics and Financial Stability, Washington: World Bank Publications, 395-436. Ashofteh, A. and Bravo, J. M. (2019). A non-parametric-based computationally efficient approach for credit
scoring. Atas da Conferência da Associação Portuguesa de Sistemas de Informação 2019 [CAPSI 2019 - 19th Conference of the Portuguese Association for Information Systems, Proceedings. 4].
Ashofteh, A., and Bravo, J. M. (2020). A Conservative Approach for Online Credit Scoring. Expert Systems With Applications. Revised & resubmitted.
Ayuso, M., Bravo, J. M., and Holzmann, R. (2017a). On the Heterogeneity in Longevity among Socioeconomic Groups: Scope, Trends, and Implications for Earnings-Related Pension Schemes. Global Journal of Human Social Sciences - Economics, 17(1), 31-57.
Ayuso, M., Bravo, J. M. and Holzmann, R. (2017b). Addressing Longevity Heterogeneity in Pension Scheme Design. Journal of Finance and Economics. 6(1), 1-21.
Ayuso, M., Bravo, J. M. and Holzmann, R. (2020). Getting Life Expectancy Estimates Right for Pension Policy: Period versus Cohort Approach. Journal of Pension Economics and Finance, 1-20. doi: doi:10.1017/S1474747220000050
Blake, D., Cairns, A., Dowd, K. and MacMinn, R. (2006). Longevity Bonds: Financial Engineering, Valuation, and Hedging. The Journal of Risk and Insurance, 73(4), 647-672.
Blake, D., Cairns, A.J.G. and Dowd, K. (2003). Pensionmetrics II: stochastic pension plan design during the distribution phase. Insurance: Mathematics and Economics, 33, 29-47.
Bovenberg, L., Bilsen, S. and Mehlkopf, R. (2015). Personal Pensions with Risk Sharing Affordable, Adequate and Stable Private Pensions in Europe. Netspar Discussion Paper Series 03-2015.
Boyer, M. and Stentoft, L. (2013). If we can simulate it, we can insure it: An application to longevity risk management. Insurance: Mathematics and Economics, Elsevier, vol. 52(1), pages 35-45.
Boyle, P., Hardy, M., MacKay, A., and Saunder, D. (2015). Variable Payout Annuities. Society of Actuaries, December.
20.ª Conferência da Associação Portuguesa de Sistemas de Informação (CAPSI’2020) 20
Bräutigam, M., Guillén, M. and Nielsen, J. P. (2017), Facing Up to Longevity with Old Actuarial Methods: A Comparison of Pooled Funds and Income Tontines. The Geneva Papers on Risk and Insurance - Issues and Practice, 42, (3), 406-422.
Bravo, J. M. (2016). Taxation of Pensions in Portugal: A Semi-Dual Income Tax System. CESifo DICE Report - Journal for Institutional Comparisons. 14 (1), 14-23.
Bravo, J. M. (2019). Funding for Longer Lives: Retirement Wallet and Risk-Sharing Annuities. Ekonomiaz, 96 (2), 268-291.
Bravo, J. M. and Coelho, E. (2019). Forecasting Subnational Demographic Data using Seasonal Time Series Methods. Atas da Conferência da Associação Portuguesa de Sistemas de Informação 2019 [CAPSI 2019 - 19th Conference of the Portuguese Association for Information Systems, Proceedings. 24].
Bravo, J. M., and Herce, J. A. (2020). Career Breaks, Broken Pensions? Long-run Effects of Early and
Late-career Unemployment Spells on Pension Entitlements. Journal of Pension Economics and Finance 1–27.
https://doi.org/10.1017/S1474747220000189
Bravo, J. M. and Silva, C. (2006). Immunization Using a Stochastic Process Independent Multifactor Model: The Portuguese Experience. Journal of Banking and Finance, 30 (1), 133-156.
Bravo, J. M., and El Mekkaoui de Freitas, N. (2018). Valuation of longevity-linked life annuities. Insurance: Mathematics and Economics, 78, 212-229.
Bravo, J. M., and Nunes, J. P. (2020). Pricing Longevity Swaps via Option Decomposition and Fourier Transforms. Insurance: Mathematics and Economics. Revised and submitted.
Bravo, J. M., Ayuso, M., Holzmann, R. and Palmer, E. (2020). Addressing Life Expectancy Gap in Pension Policy. Insurance: Mathematics and Economics. Revised and submitted.
Brouhns, N., Denuit, M. and Vermunt, J. (2002). A Poisson log-bilinear regression approach to the construction of projected lifetables. Insurance: Mathematics & Economics 31, 373-393.
Cairns, A.J.G., Blake, D., and Dowd, K., (2006). A Two-Factor Model for Stochastic Mortality with Parameter Uncertainty: Theory and Calibration. Journal of Risk and Insurance, 73, 687-718.
Cairns, A., Blake, D., Dowd, K., Coughlan, G., Epstein, D., Ong, A. & Balevich, I. (2009). A Quantitative Comparison of Stochastic Mortality Models Using Data from England and Wales and the United States. North American Actuarial Journal, 13(1), 1-35.
Chamboko, R., and Bravo, J. M. (2020). A Multi-State Approach to Modelling Intermediate Events and Multiple Mortgage Loan Outcomes. Risks, 8, 64.
Chamboko, R. and Bravo, J. M. (2019a). Modelling and forecasting recurrent recovery events on consumer loans. International Journal of Applied Decision Sciences, 12(3), 271-287.
Chamboko, R. and Bravo, J. M. (2019b). Frailty correlated default on retail consumer loans in developing markets. International Journal of Applied Decision Sciences, 12(3), 257--270.
Chamboko, R., and Bravo, J. M. (2016). On the modelling of prognosis from delinquency to normal
performance on retail consumer loans. Risk Management, 18(4), 264--287.
https://doi.org/10.1057/s41283-016-0006-4
Chen, A., P. Hieber and J. K. Klein (2018). Tonuity: a novel individual-oriented retirement plan. ASTIN Bulletin, 1-26.
Chiu,Yu-Fen, Hsieh, Ming-Hua and Tsaib, Chenghsien (2019). Valuation and analysis on complex equity indexed annuities. Pacific-Basin Finance Journal, 57. https://doi.org/10.1016/j.pacfin.2019.101175 Cui, J. (2008). Longevity Risk Pricing. Netspar Discussion paper, dP 2008-001.
Currie, I. (2006). Smoothing and Forecasting Mortality Rates with P-Splines. London: Institute and Faculty of Actuaries. Available online: https://www.actuaries.org.uk/documents/smoothing-and-forecasting-mortality-rates-p-splines-handouts (accessed on 20 July 2018).
Denuit, M. and Goderniaux, A. C. (2005). Closing and projecting life tables using log-linear models. Bulletin of the Swiss Association of Bulletin of the Swiss Association of Actuaries, (1), 29-48.
Denuit, M., Haberman, S., and Renshaw, A. (2015). Longevity-contingent deferred life annuities. Journal of Pension Economics and Finance, 14(3), 315-327.
Devolder, P. and de Valeriola, S. (2019). Between DB and DC: optimal hybrid PAYG pension schemes. European Actuarial Journal. https://doi.org/10.1007/s13385-019-00216-y.
Diez, F. & Korn, R. (2019). Yield curve shapes of Vasicek interest rate models, measure transformations and an application for the simulation of pension products. European Actuarial Journal, https://doi.org/10.1007/s13385-019-00214-0.
Donnelly, C. (2015). Actuarial fairness and solidarity in pooled annuity funds. ASTIN Bulletin, 45(1), 49-74. Donnelly, C., Guillén, M. and Nielsen, J. (2013). Exchanging uncertain mortality for a cost. Insurance:
Mathematics & Economics, 52, 65--76.
Donnelly, C., Guillén, M. and Nielsen, J. (2014). Bringing cost transparency to the life annuity market. Insurance: Mathematics and Economics, 56, 14-27.
Dowd, K., Cairns, A., Blake, D., Coughlan, G. Epstein, D. & Khalaf-Allah, M. (2010). Backtesting Stochastic Mortality Models, North American Actuarial Journal, 14:3, 281-298.
20.ª Conferência da Associação Portuguesa de Sistemas de Informação (CAPSI’2020) 21
Friedberg, L., and Webb, A. (2006). Life is Cheap: Using Mortality Bonds to Hedge Aggregate Mortality Risk, NBER Working Paper No. 11984
Haberman, S. & Renshaw, A. (2011). A comparative study of parametric mortality projection models. Insurance: Mathematics and Economics 48, 35--55.
Hanewald, K., Piggott, J. and Sherris, M. (2013). Individual Post-retirement Longevity Risk Management under Systematic Mortality Risk. Insurance: Mathematics and Economics 52, 87-97.
Holzmann, R., Ayuso, M., Alaminos, E. and Bravo, J. M. (2020). Life Cycle Saving and Dissaving across Three-tier Income Groups: Starting hypotheses, refinement through literature review, and ideas of international empirical testing. Work, Ageing and Retirement, Submitted.
Human Mortality Database (2019). University of California, Berkeley (USA), and Max Planck Institute for Demographic Research (Germany). Available at www.mortality.org or www.humanmortality.de (data downloaded on [15-June-2019]).
Hunt, Andrew, and David Blake (2015). On the Structure and Classification of Mortality Models. Pension
Institute. Working Paper. Available online:
http://www.pensions-institute.org/workingpapers/wp1506.pdf (accessed on 5 September 2019).
Kontis, V., Bennett, J., Mathers, C., Li, G., Foreman, K. and Ezzati, M. (2017). Future life expectancy in 35 industrialised countries: projections with a Bayesian model ensemble. Lancet, 389 (10076), 1323-1335. Lüty, H., Keller, P. L., Binswangen, K., and Gmür, B. (2001). Adaptive algorithmic annuities. Mitteilungen der
Schweizerischen Aktuarvereinigung, 2, 123-138.
Maurer, R., Mitchell, O., Rogalla, R. and Kartashov, V. (2013). Lifecycle portfolio choice with systematic longevity risk and variable investment-linked deferred annuities. The Journal of Risk and Insurance, vol. 80(3), 649--676.
Milevsky, M. A. and Salisbury, T. S. (2015). Optimal retirement income tontines. Insurance: Mathematics and Economics, vol. 64: 91-105.
Milevsky, M. A. and Salisbury, T. S. (2016). Equitable retirement income tontines: mixing cohorts without discriminating. ASTIN Bulletin, 46(3), 571-604.
Milevsky, M. A., and David Promislow, S. (2001). Mortality derivatives and the option to annuitise. Insurance: Mathematics and Economics, 29 (3), 299-318.
Milevsky, M.A., Promislow, S.D., Young, V.R., 2005. Financial valuation of mortality risk via the instantaneous Sharpe ratio: applications to pricing pure endowments. Working Paper. Department of Mathematics. University of Michigan. Available at: http://arxiv.org/abs/0705.1302.
Mitchell, O.S., Poterba, J.M., Warshawsky, M.J. and Brown J.R. (1999). New evidence on the money's worth of individual annuities. The American Economic Review, 89(5), 1299-1318.
Piggott, J., Valdez, E. and Detzel, B. (2005). The simple analytics of pooled annuity funds. The Journal of Risk and Insurance 72 (3), 497-520.
Plat, R. (2009). On stochastic mortality modeling. Insurance: Mathematics and Economics 45, 393-404. Qiao, C., and Sherris, M. (2013). Managing Systematic Mortality Risk with Group Self-Pooling and
Annuitization Schemes, Journal of Risk and Insurance, 80(4), 949-974.
Raftery, A., Gneiting, T., Balabdaoui, F. & Polakowski, M. (2005). Using Bayesian Model Averaging to Calibrate Forecast Ensembles. Journal of American Meteorological society 133, 1155-1174.
Renshaw, A.E. and Haberman, S. (2003). Lee-Carter mortality forecasting with age specific enhancement. Insurance: Mathematics & Economics, 33, 255-272.
Renshaw A, Haberman S (2006). A Cohort-Based Extension to the Lee-Carter Model for Mortality Reduction Factors. Insurance: Mathematics and Economics, 38(3), 556--570.
Richter, A., and Weber, F. (2011). Mortality-indexed annuities: Managing longevity risk via product design. North American Actuarial Journal, 15, 212-236.
Simões, C., Oliveira, L. and Bravo, J. M. (2019). Immunization Strategies for Funding Multiple Inflation-Linked Liabilities. Preprint submitted for Journal publication.
Stamos, M. (2008). Optimal consumption and portfolio choice for pooled annuity funds. Insurance: Mathematics and Economics, 43(1), 56-68.
Valdez, E., Piggott, J. and Wang, L. (2006). Demand and Adverse Selection in a Pooled Annuity Fund, Insurance: Mathematics and Economics, 39(2), 251-266.
Vasicek, O. (1977). An Equilibrium Characterization of the Term structure. Journal of Financial Economics 5, 177-88.
Villegas, A., Millossovich, P. & Kaishev, V. (2018). StMoMo: An R Package for Stochastic Mortality Modelling. R Package Version 0.4.1. Available online: https://CRAN.R-project.org/package=StMoMo (accessed on 15 September 2019).
Wang, S. (2002). A Universal Framework for Pricing Financial and Insurance Risks. ASTIN Bulletin, 32(2), 213-234.
Wang, X., and Li, Q. (2018). Trends in the Chinese Annuity Market and the Management of Longevity Risk. Society of Actuaries.