Independent component analysis: Mining microarray data for fundamental
human gene expression modules
Jesse M. Engreitz
a, Bernie J. Daigle Jr.
b, Jonathan J. Marshall
a, Russ B. Altman
a,b,* aDepartment of Bioengineering, Stanford University, Stanford, CA 94305, USA b
Department of Genetics, Stanford University School of Medicine, Stanford, CA 94305, USA
a r t i c l e
i n f o
Article history:
Received 10 December 2009 Available online 7 July 2010
Keywords:
Microarrays
Independent component analysis Data mining
Parthenolide Gene modules
a b s t r a c t
As public microarray repositories rapidly accumulate gene expression data, these resources contain increasingly valuable information about cellular processes in human biology. This presents a unique opportunity for intelligent data mining methods to extract information about the transcriptional modules underlying these biological processes. Modeling cellular gene expression as a combination of functional modules, we use independent component analysis (ICA) to derive 423 fundamental components of human biology from a 9395-array compendium of heterogeneous expression data. Annotation using the Gene Ontology (GO) suggests that while some of these components represent known biological mod-ules, others may describe biology not well characterized by existing manually-curated ontologies. In order to understand the biological functions represented by these modules, we investigate the mecha-nism of the preclinical anti-cancer drug parthenolide (PTL) by analyzing the differential expression of our fundamental components. Our method correctly identifies known pathways and predicts thatN -gly-can biosynthesis and T-cell receptor signaling may contribute to PTL response. The fundamental gene modules we describe have the potential to provide pathway-level insight into new gene expression datasets.
Ó2010 Elsevier Inc. All rights reserved.
1. Introduction
The wide use of high-throughput DNA microarray technology promises to provide an increasingly detailed view of the human transcriptome in many different contexts. As experimentalists con-tinue to sample a variety of biological conditions and cell types, public gene expression repositories grow exponentially: the Gene Expression Omnibus (GEO), the largest of these databases, now contains over 400,000 individual microarrays (www.ncbi.nlm.nih. gov/geo/). Although biomedical researchers typically design micro-array experiments to explore specific biological contexts, meta-analyses that integrate data from multiple experiments have the potential to reveal relationships that are not accessible through any individual dataset[1–10]. One critical question in the post-genomic era is the identification of sets of functionally related genes that correspond to a particular biological process. While cu-rated databases such as the Gene Ontology (GO) group genes with related functions, these resources are necessarily incomplete and prone to human error[11]. Furthermore, GO categories do not nec-essarily correspond to co-regulated transcriptional units [12]. Computational methods based on co-expression, therefore, have
the potential to enhance the identification of genes that contribute to the same biological processes[1,7,13]. Given the wide sampling of diverse cellular conditions, a meta-analysis of human gene expression data should yield information about many of the key pathways and processes in human biology.
Methods that extract gene expression modules (subsets of genes that are co-regulated across subsets of conditions) provide a means for identifying functionally related genes from microarray data[13–21]. Popular methods for this analysis, such as hierarchi-cal clustering, k-means clustering, and self-organizing maps (SOMs), identify disjoint sets of genes that are co-expressed throughout a particular dataset. Because these approaches require that genes belong to only one transcriptional module, however, they do not capture an important feature of gene regulation: it is common for the same proteins to serve different functions depend-ing on biological context[22]. Furthermore, simple clustering ap-proaches may be inappropriate for large-scale gene expression meta-analysis because they capture global signals in the compen-dium and exclude more specific signals[23]. These challenges have led to methods like biclustering that simultaneously cluster sub-sets of genes over subsub-sets of conditions[23–25].
For a more biologically relevant model for gene expression, researchers often turn to matrix decomposition methods[19,25– 32]. Gene expression data lends itself to representation as a matrix, with columns corresponding to genes and rows corresponding to
1532-0464/$ - see front matterÓ2010 Elsevier Inc. All rights reserved. doi:10.1016/j.jbi.2010.07.001
*Corresponding author. Address: 318 Campus Drive S172, MC: 5444, Stanford, CA 94305-5444, USA. Fax: +1 650 723 8544.
E-mail address:[email protected](R.B. Altman).
Contents lists available atScienceDirect
Journal of Biomedical Informatics
j o u r n a l h o m e p a g e : w w w . e l s e v i e r . c o m / l o c a t e / y j b i nexperiments. Like biclustering, matrix decomposition offers an improvement over traditional clustering methods by modeling microarray data as a combination of biological modules that can share genes. Furthermore, matrix decomposition provides a gener-ative model that allows for unified analysis of multiple datasets. One common method, principal component analysis (PCA), pro-vides a representation of microarray data in terms of a set of line-arly uncorrelated axes[26,27]. Each axis, or principal component, explains the maximal variance not represented by the previous, orthogonal components. While PCA can identify interesting biolog-ical information, its linear transformation involves only second or-der statistics; like clustering methods based on co-expression, PCA may miss more complex relationships between genes[31]. Fur-thermore, the application of PCA to biological data assumes that gene expression follows a multivariate normal distribution. Recent studies demonstrate that microarray gene expression measure-ments typically follow a super-Gaussian distribution[33,34], sug-gesting that PCA applies a model that does not accurately reflect our knowledge of biology.
Independent component analysis (ICA), in contrast, provides a more biologically plausible model for gene expression data by assuming non-Gaussian data distributions. A blind source separa-tion algorithm, ICA models observasepara-tions as a linear combinasepara-tion of latent feature variables, or components, which are chosen to be as statistically independent as possible. For microarray data, observations consist of microarray gene expression measurements, and independent components are interpreted to be transcriptional modules that often correspond to specific biological processes[28]. ICA has proven successful in a variety of biological inquiries, including identifying oscillating regulatory modules in yeast cell cycle data [28], investigating tumor-related pathways [35–39], classifying disease datasets[40,41], characterizing transcriptional regulators [42,43], identifying disease-specific biomarkers [44], and examining response to bacterial infection[45]. Furthermore, ICA outperforms PCA and other unsupervised methods in identify-ing co-regulated and biologically relevant gene modules in diverse datasets [31,39]. Although ICA produces stochastic component estimates with different initial conditions, clustering and averaging the results from multiple runs can yield robust independent com-ponent estimates [38,45]. While previous applications of ICA to microarray data have used at most hundreds of experiments, no large-scale meta-analysis to identify fundamental gene modules has been attempted.
Compared with resources such as the Gene Ontology, ICA pro-vides a data-driven method for exploring functional relationships and grouping genes into transcriptional modules. We apply ICA to a large microarray compendium initially comprised of 9395 microarrays representing a diverse set of experimental conditions and cell types. We identify 423 fundamental components (FCs) of human biology, and show that these components yield gene expression modules with coherent functions. To evaluate the bio-logical relevance of our fundamental components, we develop a method to perform differential expression analysis in the feature-space described by our FCs.
Using this technique, we assess the ability of our method to identify known mechanisms of parthenolide (PTL), a preclinical drug under investigation for its ability to selectively induce apop-tosis in multiple cancer types[46–50]. Known PTL effects can be divided into two intracellular signals. First, PTL induces oxidative stress, evidenced by increased levels of reactive oxygen species [51]and activation of c-Jun N-terminal kinase (JNK)[52]. Second, PTL inhibits inflammatory responses via inhibition of STAT3[53] and the transcription factor NF-
j
B [54,55]. PTL treatment leads to apoptosis in various cancer cell lines[46,51], and activation of p53 has been associated with the AML-specific apoptosis mecha-nism[46]. We show that independent components derived froma diverse compendium offer module-level insight into transcrip-tional response that cannot be gleaned from the PTL dataset alone. 2. Methods
2.1. Creation of the human gene expression compendium
We downloaded our microarray compendium from the Gene Expression Omnibus (GEO) [56], selecting all GEO Series (GSEs) run on the Affymetrix Human Genome U133 Plus 2.0 array (GEO accession GPL570) available on May 28, 2008. We filtered these ar-rays to remove samples that represented species other than hu-man, and we removed GSEs with missing data so that imputation was not necessary. Normalized microarray data are often uploaded to GEO, but we downloaded only unprocessed CEL files in order to standardize the normalization procedures across all arrays in the compendium. After applying these filters, the resulting dataset consisted of 298 GEO Series comprised of 9395 arrays.
We applied a two-step normalization pipeline as previously de-scribed[10]. For each series, we aggregated and normalized probe level information using robust multi-array average (RMA) [57], transformed each expression value using log base 2, and removed technical bias resulting from variation in hybridization conditions and starting material using the R packagebias0.0.3[58]. This with-in-series normalization identified probe or arrays outliers within each dataset. We mapped probes to genes using the Bioconductor annotation package hgu133plus2 1.16.0 [59], and calculated expression values for each gene by averaging the values of probe-sets measuring the same gene. Finally, we performed quantile nor-malization [60] on the entire compendium using the limma R package (version 2.18.2)[61]in order to reconcile broader differ-ences between datatsets and ensure that all arrays were on the same scale prior to applying ICA. This produced a compendium comprising 20,099 genes and 9395 arrays.
To reduce the contributions of over-represented conditions, and to eliminate rare signals that the compendium did not sample suf-ficiently, we grouped similar arrays using hierarchical clustering. First, we centered and scaled the expression values within an array, and centered the expression values for each gene. We calculated pairwise correlations between arrays using Spearman’s rank corre-lation coefficient,r, a metric robust to outliers that performs well with microarray data[62,63]. We defined pairwise distances,d, by
dx;y¼1 jrx;yj; ð1Þ
wherexandyare the gene expression measurements of individual microarrays. Using these distances, we applied agglomerative hier-archical clustering to the compendium using average linkage. To fil-ter the resulting clusfil-ters, we required that nodes pass two cutoffs. First, in order to cap the heterogeneity of arrays within a cluster, we empirically limited the maximum pairwise intra-cluster dis-tance,dmax, to 0.3. Second, in order to eliminate conditions or
sig-nals that did not have sufficient representation within the compendium, we required a minimum cluster size,cmin, of 5. We
generated representative nodes for clusters that passed these cut-offs by using average linkage to calculate centroids. We called these representative cluster nodes ‘‘meta-samples”, and combined them to create a meta-compendium that reduced the dimensionality of the data. We examined the sensitivity of the meta-compendium and independent components extracted to the parameters dmax
and cmin and found that our results were robust with different
parameters (data not shown). 2.2. Iterated FastICA
ICA identifies latent variables, or independent components, that provide a new set of basis vectors for a dataset. In other words, ICA
performs dimension reduction by describing the data in the fea-ture-space identified by independent components. As opposed to gene modules, which typically consist of unordered subsets of genes, components contain scores for each gene in the domain. To extract a robust set of independent components from the meta-compendium, we applied iterated ICA and averaged the re-sults. Here we briefly describe the ICA model; for a more thorough review of the procedural details of the application of ICA to micro-array data, see Kong et al.[64].
LetXrepresent themnmatrix of microarray data measuring the expression of n genes in m experiments. ICA models this expression matrix as a linear combination of independent biologi-cal processes by decomposingXinto aknsource matrixSand a mkmixing matrixAsuch thatX = AS, wherekis a user-supplied parameter no greater than the minimum ofmandn. For our anal-yses, we setk=mto extract the maximum number of components from the meta-compendium. These components, or rows ofS, are independent in the sense that the gene weights in each component reflect samplings of independent random variables. In the context of gene expression, this suggests that the sets of genes comprising the groups strongly contributing to each component have indepen-dent compositions. We performed ICA using the R interface to the FastICA algorithm (version 1.1–11), which attempts to maximize the non-Gaussianity of the component distributions [65]. For microarray data, these distributions are typically super-Gaussian: only a small number of genes contribute heavily to a specific bio-logical process, while the majority of genes do not contribute [28]. We used the contrast function
gðuÞ ¼log coshu ð2Þ
and allowed a convergence tolerance of 0.0001. To account for the stochastic nature of ICA, we ran the algorithm 20 times and pooled the independent component estimates in a method similar to the Icasso software[66]. We clustered component estimates with par-titioning around medoids[67], a robust version ofk-means, using the distance metric based on Spearman’s correlation coefficient in Eq.(1). We defined the fundamental components (FCs) of our anal-ysis as thekmedoids that result from this clustering analysis. To visualize the independent component estimates, we used classical multi-dimensional scaling to represent the 20,099-dimension com-ponent matrix in two dimensions.
2.3. Functional annotation of fundamental components
To examine the biological processes associated with each com-ponent, we made use of two sources of information yielded by the ICA decomposition: the distribution of gene weights in a compo-nent (rows ofS), and the distribution of a component’s expression in arrays in the compendium (columns ofA).
2.3.1. Annotation based on component gene weight distributions The rows of the source matrix,S, describe the contributions of individual genes to each component. Each component contains an expression value for each gene. ICA produces components with unit variance and zero mean, so the contributions of each gene are relative. We call the genes that significantly contribute to each component theactive genes, and identified them by using a weight threshold[37]of three standard deviations from the mean. Similar to Lee and Batzoglou[31], we generated two sets of active genes for each component: one for genes with positive loadings and one for genes with negative loadings. Our initial observations, as well as those of Frigyesi et al.[38], suggested that this division re-sults in a greater number of significant annotations. For a given component, we called the module with more genes thedominant module. Since the signs of independent component expression
val-ues are arbitrary, we reoriented each component so that the load-ings for the dominant module were positive.
To investigate the biological functions of our fundamental com-ponents, we used Alexa et al.’selimalgorithm[68]to identify en-riched biological process GO categories in the active gene modules, assessing significance with Fisher’s exact test. We anno-tated each gene cluster with GO categories with a Bonferroni-cor-rected p-value <0.05. To further characterize the biological processes associated with each component, we identified signifi-cant canonical pathways using Ingenuity Pathway Analysis (Inge-nuity Systems, www.ingenuity.com). Ingenuity uses Fisher’s exact test to calculate ap-value determining the probability that the association between genes in the dataset and the canonical pathway is explained by chance alone. We defined significant pathways as those with ap-value <0.05 after correcting for false discovery rate with the Benjamini–Hochberg method.
2.3.2. Annotation based on component expression in compendium Independent components provide an orthogonal basis with which to describe the original data, so we modeled each original experiment as a linear combination of FCs. To generate a mixing matrix that describes the original arrays, we projected the full 9395-array compendium into the feature-space defined by the FCs using Eq.(3)
A¼XST ð3Þ
This resulted in an (arraycomponent) mixing matrix, A, whose columns describe the contributions of a component to each array in the compendium. A high absolute weight in this matrix for componentiand arrayjindicates that the gene expression pattern present in component i plays a significant role in defining the expression profile of arrayj. Because component expression forms complex distributions[37], we annotated each FC with the 100 individual arrays in the compendium that have the highest expres-sion of that component. In other words, we found the 100 arrays with the highest scores in each column ofA, which we called the active arrays. The active arrays define the context in which a gene module is expressed. We annotated each gene module with the GEO Series containing the active arrays, ordering the GSEs by the number of active arrays contributed by each series.
2.4. Differential expression analysis of parthenolide
From the full compendium, we selected and normalized GSE7538, a dataset consisting of 12 pairs of PTL-treated or untreated primary acute myelogenous leukemia (AML) specimens[8]. We pro-jected this dataset onto the basis vectors defined by our fundamental components [Eq.(3)] to determine the levels of component expres-sion in each array. Analogous to the use of differential expresexpres-sion analysis to identify differentially expressed (DE) genes of interest, we used the quantitative expression levels of components to identify DE components. Specifically, we applied the linear modeling and empirical Bayes methods of thelimma2.18.2 R package[61]to iden-tify differentially expressed components between treated and un-treated AML samples. To compare this approach with existing DE gene identification methods, we used the moderatedt-statistic from limmato identify DE genes from the original dataset. We also applied ICA to the PTL dataset alone, using the methodology described in Sec-tion2.2, to identify the maximum possible number of independent components (24 components). Using only the data from GSE7538, we again used linear modeling to identify DE components. For each comparison, we adjusted thep-values for differential expression using the Benjamini–Hochberg correction. We examined genes with p-values below 0.05 and components withp-values below 0.001. We also restricted our search to components whose differential
expres-sion had the same sign for all 12 treated/untreated pairs; while this strategy might eliminate true signal, it also removes inconsistent patterns that may represent heterogeneity within the tumors. 2.5. Identification of novel regulators of parthenolide response
To identify novel regulators of parthenolide response, we used the dominant gene modules from DE components to create protein interactions networks with Ingenuity Pathway Analysis (Ingenuity Systems, www.ingenuity.com). Ingenuity overlaid active genes onto a global molecular network developed from information con-tained in Ingenuity’s Knowledge Base, and it algorithmically gener-ated networks based on gene connectivity. We ranked genes in order of connectivity, and examined the highly-connected hub genes. To generate a list of known PTL-associated genes, we used the Pharmspresso text-mining tool to search the biomedical litera-ture [69]. Pharmspresso searched all 322 PubMed articles with ‘‘parthenolide” in the title or abstract looking for co-occurrences of the term ‘‘parthenolide” with gene names in the same sentence, and obtained a list of 363 known PTL-associated genes.
3. Results
3.1. Identification of fundamental components of human biology Our starting compendium consisted of 20,099 genes measured by 9395 heterogeneous arrays, representing 298 GEO Series (GSEs) that spanned a wide range of human biology. While a majority of these data series contributed fewer than 15 arrays, we noticed that the five largest GSEs constituted over one third of the total arrays in the compendium. For instance, GSE2109 contributed 1974 pri-mary tumor samples from various sources and GSE8052 contrib-uted 404 lymphoblastoid samples from an asthma study. A compendium-wide analysis using Spearman’s rank correlation as a similarity metric revealed strong correlations within datasets and between experiments performed with similar cell types and conditions (Supplementary Fig. 1). We reasoned that the dispro-portionate representation of some transcriptional patterns might cause certain biological conditions to dominate the ICA results. At the same time, we did not wish for rare gene expression pat-terns caused by extreme experimental perturbations or technical errors to skew the compendium. Therefore, to reduce the contribu-tions of over-represented condicontribu-tions and to eliminate cellular sig-natures that were not replicated within the compendium, we applied a filter based on hierarchical clustering to the original com-pendium (Fig. 1). The resulting meta-compendium consisted of
423 meta-samples that included contributions from 5818 of the original arrays.
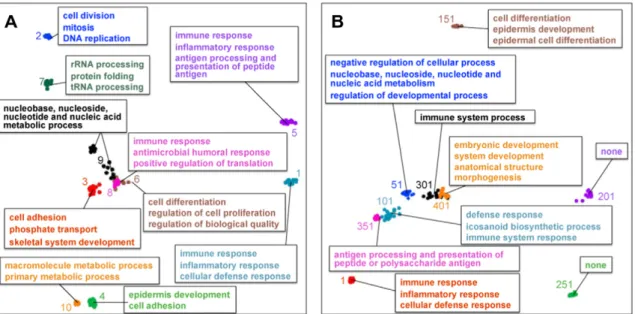
We next applied iterated ICA to the meta-compendium to iden-tify 423 fundamental components that span a wide range of hu-man biology. Since ICA produces components in an arbitrary order, we sorted the components based on the amount of variance of the meta-compendium they explain (Supplementary Fig. 2). Un-like PCA, ICA does not use variance explained as a criterion to select components. Still, ordering components based on this metric may provide biologically relevant information[28]: fundamental ponents that explain a large percentage of the variance in a com-pendium represent processes that are active in many biological or experimental conditions, while those that explain a relatively small percentage of the variance represent relatively infrequent transcriptional patterns that are active only under certain condi-tions. In this ordering scheme, the first independent component explained 3.2% of the variance in the meta-compendium. Over multiple runs, ICA reliably reproduced the 10 components that ex-plain the most variance (Fig. 2A). To verify that low-ranking com-ponents also clustered together, we examined a sampling of components that explained varying fractions of the variance in the data (Fig. 2B). Signals appeared robust even for the less well-represented components. Henceforth, we refer to components by their rank in this ordering. That is, fundamental component 1 (FC-1) explains the most variance in the meta-compendium, while FC-423 explains the least.
To investigate whether our method of meta-compendium crea-tion succeeded in reducing the contribucrea-tions of over-represented conditions, we compared the percentage of variance explained by each FC in the meta-compendium to that in the original compen-dium (Supplementary Fig. 3). Some FCs explain more variance in the meta-compendium than in the original compendium; these FCs may represent relatively rare but reproducible biology that was up-weighted in the meta-compendium. Many FCs, however, explain 1.5- to 3-fold less variance in the meta-compendium, and may represent biology that was over-sampled in the original com-pendium. We examined the active array clusters for two represen-tative FCs, 62 and 268, selected for their high reduction in variance explained and their relative separation in the component ordering (Supplementary Fig. 3). FC-62 explains 1.26% of the variance in the full compendium but only 0.31% of the variance in the meta-com-pendium, and the 100 arrays with the highest expression of the component all are part of GSE8052, the 404-array asthma study mentioned previously (Supplementary Fig. 1). Similarly, the 100 arrays with the highest expression for FC-268 consist entirely of brain samples from a single GEO series. Since FC-268 explains
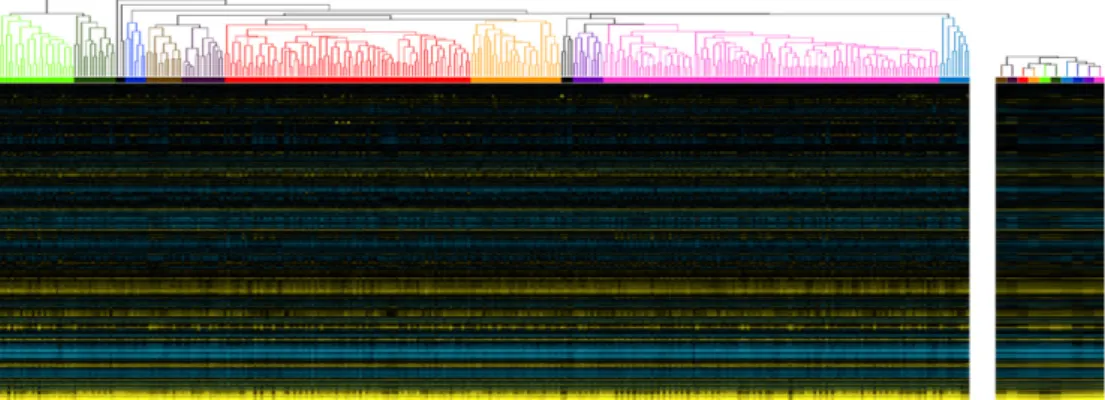
Fig. 1.Clustering procedure applied to subset of compendium. To reduce the contributions of highly replicated conditions in the compendium, we applied agglomerative hierarchical clustering using a distance metric based on Spearman’s rank correlation to the full compendium, then selected and consolidated clusters with a maximum intra-cluster distance of 0.3 and a minimum size of 5. We selected 323 neuron samples that intra-clustered together to graphically demonstrate this preprocessing step. Experiments from the original compendium (left) clustered together to form samples (right) with corresponding colors. We excluded samples with black lines (left) from the meta-compendium because they did not satisfy our cluster selection criteria: they might represent extreme experimental perturbations or technical errors.
relatively little variance in either compendium, it likely represents an over-sampled gene expression signature that does not play a large role in most biological conditions.
3.2. Functional annotation of fundamental components
To examine the biological processes and functions associated with each component, we made use of two sources of information yielded by ICA decomposition: the distribution of gene weights in a component, and the distribution of component expression in ar-rays in the compendium. First, to identify genes that contribute significantly to each component, we used a loading cut-off of 3.0, corresponding to three standard deviations above the zero mean. For each component we created two gene modules, one for signif-icant genes with positive loadings and one for negative loadings. The mean module size was 155.95, with a standard deviation of 73.57, although typically one module associated with a component was larger than the other; the mean difference between the sizes of a component’s modules was 110.00, with a standard deviation of 80.57. For a particular component, we refer to the module with more genes as the dominant module. 14,932 out of 20,009 genes belong to at least one module. We then calculated GO category enrichment in the active gene sets. 292 out of the 423 FCs had en-riched GO categories in at least one of the two active gene modules. Supplementary Table 1shows the enriched GO categories for the dominant modules of the first 10 components. We observed a weak correlation between the amount of variance explained by a FC and the total number of enriched GO categories found for its ac-tive genes (Fig. 3). However, in accordance with Roden et al.’s observations with PCA[70], many FCs that explain less than 0.5% of variance in the compendium have strong GO annotation. This suggests that these FCs explain relatively infrequent but biologi-cally coherent transcriptional patterns.
3.3. Differential expression analysis of parthenolide treatment response
To assess the utility of our fundamental components, we ana-lyzed a dataset from the initial compendium (GEO accession GSE7538) using three methods: (1) standard differential gene
expression analysis, (2) differential expression analysis based on independent components derived from the dataset alone, and (3) differential expression analysis using FCs derived from the full compendium of data. GSE7538 contains acute myelogenous leuke-mia (AML) CD34+cells from 12 patients treated with parthenolide (PTL), a sesquiterpene lactone with inflammatory and anti-cancer activities[46,47].
Linear modeling with empirical Bayes methods in gene-space identified 2574 differentially expressed (DE) genes at a significance level <0.05 after correcting for multiple hypothesis testing, and we annotated this set of genes with significant GO categories and
Fig. 2.Independent component estimates with GO Biological Process annotations. We applied ICA to the meta-compendium using 20 different random seeds to obtain 42320 = 8460 component estimates. We clustered these estimates using partitioning around medoids and defined the 423 medoids as the fundamental components. We plotted a 2-D projection of the component estimates for (A) the 10 components that explain the most variance in the meta-compendium and (B) a range of high- to low-ranking components that explain different amounts of variance in the meta-compendium. Colored numbers represent component ranks when ordered by variance explained.
Fig. 3.Correlation between variance explained and enriched GO categories. We analyzed the active genes in the two modules associated with each FC and plotted the total number of enriched GO categories for a component versus the fraction of variance explained. Some FCs that explain a small percentage of variance have many enriched GO categories, suggesting that they represent rare but relevant expression profiles.
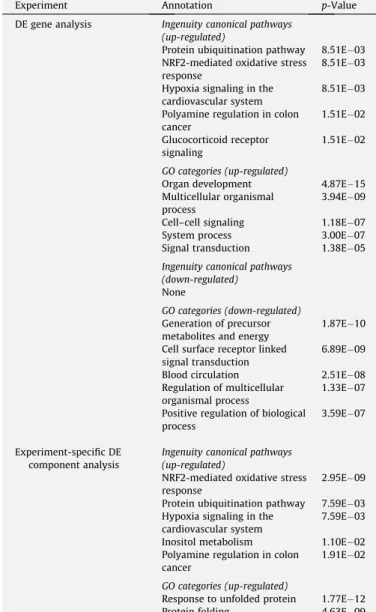
Ingenuity canonical pathways. We obtained more enriched terms with higher scores when separating the genes into up-regulated and down-regulated sets, so we present those results here. The sig-nificant pathways identified from the genes up-regulated in PTL-treated CD34+AML cells included NRF2-mediated oxidative stress response, hypoxia signaling in the cardiovascular system, and pro-tein ubiquitination pathway (Table 1), all of which are consistent with oxidative stress-induced apoptosis caused by parthenolide. Differential expression analysis in gene-space also marked gluco-corticoid receptor signaling, which is related to the NF-
j
B signaling pathway[71,72].Next we applied iterative ICA to the 24-experiment data series, identifying 24 independent components. We projected the data into this feature-space, and identified one significant DE compo-nent that explains 31.6% of the variability between treated and un-treated cells. This method predicted that the protein ubiquitination pathway and NRF2-mediated oxidative stress response are up-reg-ulated with increased significance compared to the gene-space analysis (Table 1). GO enrichment analysis in this feature-space
did not yield as many enriched GO categories as the same analysis in gene-space (Supplementary Tables 2 and 3).
Finally we analyzed the differential expression in response to PTL treatment in terms of our fundamental components. We pro-jected the original dataset into FC-space and identified 29 DE com-ponents with a p-value threshold of 0.001. To eliminate signals reflecting parthenolide response heterogeneity, we limited our re-sults to the 19 components that were regulated in the same direc-tion in all 12 paired samples (Fig. 4). Unlike DE analysis using independent components from GSE7538 alone, no FC explained a large fraction of differential expression as compared to the others; rather, complex manipulations of a wide range of gene modules contributed to the expression changes between PTL-treated and untreated cells. In addition to GO enrichment and Ingenuity Path-way Analysis, we identified for each DE component the experi-ments that contain arrays with the highest expression scores for that component.
Although neither gene-space nor experiment-specific feature-space analysis identified NF-
j
B as a significant pathway in PTL re-sponse, FC-space analysis identified NF-j
B signaling as the top pathway associated with FC-66, the fundamental component with the greatest differential expression (Table 2). FC-66 was also en-riched for JAK/Stat signaling and SAPK/JNK signaling ( Supplemen-tary Table 4), two pathways with known associations with PTL response[52,53]. Listing the experiments that highly express this component revealed that FC-66 plays an important role in leuke-mia (Table 2). In the second most over-expressed fundamental component, FC-362, NRF2-mediated oxidative stress response appeared at the top of the list of enriched Ingenuity pathways, echoing the findings in gene-space and experiment-specific com-ponent-space and matching previous experimental results [51]. Intriguingly,N-glycan biosynthesis appeared at the top of the list for the third most over-expressed fundamental component, FC-84. Subsets of glycan structures have specific functions that affect cell differentiation, growth and migration, and have been impli-cated with cancer development and metastasis[73]. Of the three most under-expressed FCs, only FC-62 offered descriptive GO cat-egories and Ingenuity pathways. The dominant gene module for this component showed enrichment for EIF2 Signaling, and a closer examination of the gene list for this module revealed a preponder-ance of ribosomal proteins. This suggests that PTL modulatestrans-Table 1
Enriched pathways for DE genes and DE experiment-specific independent components.*
Experiment Annotation p-Value DE gene analysis Ingenuity canonical pathways
(up-regulated)
Protein ubiquitination pathway 8.51E03 NRF2-mediated oxidative stress
response
8.51E03 Hypoxia signaling in the
cardiovascular system
8.51E03 Polyamine regulation in colon
cancer 1.51E02 Glucocorticoid receptor signaling 1.51E02 GO categories (up-regulated)
Organ development 4.87E15 Multicellular organismal
process
3.94E09 Cell–cell signaling 1.18E07 System process 3.00E07 Signal transduction 1.38E05
Ingenuity canonical pathways (down-regulated)
None
GO categories (down-regulated)
Generation of precursor metabolites and energy
1.87E10 Cell surface receptor linked
signal transduction
6.89E09 Blood circulation 2.51E08 Regulation of multicellular
organismal process
1.33E07 Positive regulation of biological
process
3.59E07
Experiment-specific DE component analysis
Ingenuity canonical pathways (up-regulated)
NRF2-mediated oxidative stress response
2.95E09 Protein ubiquitination pathway 7.59E03 Hypoxia signaling in the
cardiovascular system
7.59E03 Inositol metabolism 1.10E02 Polyamine regulation in colon
cancer
1.91E02
GO categories (up-regulated)
Response to unfolded protein 1.77E12 Protein folding 4.63E09
*p-Values for ingenuity canonical pathways have Benjamini–Hochberg correction
applied.p-Values for GO categories have Bonferroni correction applied.
Fig. 4.Nineteen differentially expressed fundamental components between PTL-treated and unPTL-treated AML CD34+
cells, sorted by relative fold change. Expression units are arbitrary due to normalization and scaling.
Table 2
Annotations for six DE fundamental components with the highest absolute expression change.*
Component (Dexpr)** Annotation p-Value
66 Ingenuity canonical pathways
(+3.11) NF-jB signaling 8.51E03
T-cell receptor signaling 8.51E03
Type I diabetes mellitus signaling 8.51E03
IL-6 signaling 1.51E02
Glucocorticoid receptor signaling 1.51E02
GO categories
Regulation of transcription, DNA-dependent 2.76E06 Negative regulation of biological process 4.23E02
GEO experiments with high expression of this component
GSE10609 The recurrent SET-NUP214 fusion as a new HOXA activation mechanism in pediatric T-ALL
GSE7440 Early Response and Outcome in High-Risk Childhood Acute Lymphoblastic Leukemia: A Children’s Oncology Group Study GSE10358 Discovery and validation of expression data for the Genomics of Acute Myeloid Leukemia Program at Washington University GSE10792 Genome wide genotyping and gene expression data of childhood B-cell precursor ALL without known genetic aberrations GSE7757 Robustness of gene expression signatures in leukemia: comparison of three distinct total RNA preparation procedures 362 Ingenuity canonical pathways
(+2.34) NRF2-mediated oxidative stress response 1.05E04
Complement system 1.23E02
Aryl hydrocarbon receptor signaling 1.23E02 Glucocorticoid receptor signaling 2.40E02 Role of pattern recognition receptors in recognition of bacteria and viruses 2.40E02
GO categories
Response to unfolded protein 1.67E15
Protein folding 2.86E15
Organ development 4.48E02
GEO experiments with high expression of this component
GSE7307 Human body index – transcriptional profiling
GSE7621 Expression data of substantia nigra from postmortem human brain of Parkinson’s disease patients (PD)
GSE10315 Multipotent mesenchymal stromal cells: identification of pathways common to TGFb3/BMP2-induced chondrogenesis GSE8977 Bone-marrow-derived mesenchymal stem cells promote breast cancer metastasis
GSE2816 cMyb and vMyb in human monocytes 84 Ingenuity canonical pathways
(+1.53) N-glycan biosynthesis 3.38E10
Endoplasmic reticulum stress pathway 1.23E04 NRF2-mediated oxidative stress response 1.23E02
antigen presentation pathway 1.72E02
Lipid antigen presentation by CD1 3.03E02
GO categories
Protein folding 4.92E10
Protein amino acid N-linked glycosylation 2.46E07
Secretion 6.40E05
Intracellular protein transport 2.26E04
Cell redox homeostasis 2.90E04
GEO experiments with high expression of this component
GSE10315 Multipotent mesenchymal stromal cells: identification of pathways common to TGFb3/BMP2-induced chondrogenesis GSE6283 Specific transcriptional changes in human fetus with autosomal trisomies
GSE6400 Cultured A549 lung cancer cells treated with actinomycin D and sapphyrin PCI-2050 GSE6241 The effects of Serum Amyloid A on gene expression profile in HUVECs
GSE7846 Differentially expressed genes in HEECs of eutopic endometrium of patients with endometriosis compared with control 208 Ingenuity canonical pathways
(1.73) None
GO categories
None
GEO experiments with high expression of this component
GSE2109 Expression Project for Oncology (expO)
GSE10609 The recurrent SET-NUP214 fusion as a new HOXA activation mechanism in pediatric T-ALL GSE9891 Expression profile of 285 ovarian tumor samples
GSE6532 Definition of clinically distinct molecular subtypes in estrogen receptor positive breast carcinomas using genomic grade GSE9151 Allergen induced gene expression of airway epithelial cells shows a possible role for TNF-a
62 Ingenuity canonical pathways
(1.95) EIF2 signaling 1.91E10
Regulation of eIF4 and p70S6K signaling 3.89E08
mTOR signaling 3.72E04
GO categories
Translation <1E-30
lational activity in the cell, perhaps as part of the stress response to the increase in reactive oxygen species.
Unexpectedly, FC-66 was over-expressed in PTL-treated sam-ples, seemingly countering current belief that PTL inhibits NF-
j
B activation. To determine the reason for this apparent reversal, we examined the expression of genes in the Ingenuity NF-j
B Signaling pathway for both FC-66 (Fig. 5) and the original data from GSE7538 (Supplementary Fig. 4). This analysis revealed that genes in theNF-j
B pathway exhibit a wide range of transcriptional changes in response to parthenolide, regardless of whether the genes play inhibitory or stimulatory roles. In the original data, Ij
Ba
(NIKBIA), an inhibitor of the NF-j
B complex, is down-regulated in PTL-trea-ted samples, while other components of inhibitory complexes are up-regulated (Ij
Bb, Ij
Be
). Similarly, subunits of the NF-j
B complex itself show varied transcriptional responses. However, the direct target of PTL, IKKb(IKBKB), had a negative loading in FC-66 and was down-regulated in PTL-treated compared to un-treated cells, suggesting that transcription-level regulation and protein-level activation are coordinated for this key gene in parthe-nolide response.To explore the biological validity of our method’s predictions on the gene-level as well as the module-level, we created a protein interaction network from the dominant module of each differen-tially expressed FC. For each FC, we ranked genes by connectivity in this network, since highly-connected proteins, or hub genes, are likely more essential to biological function and survival[74– 76]and potentially represent therapeutic targets[77]. We defined our hub genes as the most highly-connected 1% of the 3278 genes active in at least one of the 19 DE components, yielding a list of 32 highly-connected genes (Table 3). To identify novel predictions, we compared this list of hub genes to our text-mined catalog of known PTL-associated genes. Fourteen of the 32 hub genes appear on this text-mined list, including key regulators of PTL response such as TNF, NFKB1, STAT4 and FOS.
Among the genes not on the Pharmspresso list, several appear to represent known genes that the text-mining algorithm did not detect. C/EBP-b(CEBPB), for instance, is a transcription factor that interacts with a known PTL-associated gene, C/EBP-
a
(CEBPA), whose loss of function leads to the development of AML [78]. Kawasaki et al. found that regulatory targets of C/EBP-bare differ-entially expressed in PTL-treated prostate cancer cells[79]. HGF,although not previously directly linked to PTL, depends on the STAT pathway for HGF/SF-Met mediated tumorigenesis[80], and so may be linked to the PTL response mechanism.
Other genes on this list may represent new genes and pathways involved in PTL response. CNBP and EIF3A both contribute to FC-62, whose dominant gene module is associated with protein trans-lation. CNBP plays a role in controlling proliferation and cell survival, for instance by regulating the CT element of the c-myc protooncogene[81]. A group of highly-connected proteins – LCK, ZAP70, LAT, CD247 and CD3E – contribute to the T-cell receptor signaling pathway in FC-43 (Supplementary Table 4). Some of these genes also appear in the NF-
j
B Signaling pathway (Fig. 5). Lewis and coworkers reported aberrant expression of T-cell mark-ers in AML[82], and an independent microarray study implicated T-cell receptor signaling in AML stem cell function[83], suggesting that expression of this pathway may be relevant to AML response to PTL.4. Discussion
To develop a data-driven view of the human transcriptome, the biological community needs analysis tools that leverage the grow-ing repositories of gene expression data. We assembled a large cross-study compendium of human microarray data and extracted fundamental components of human biology using independent component analysis. These components described gene modules that have biologically coherent functions, and we used them to im-prove the differential expression analysis of a microarray dataset involving the preclinical drug parthenolide (PTL).
Because we identified gene modules through a meta-analysis of expression data from GEO, our analysis depends fundamentally on the quality of the primary microarray data. Variation in hybridiza-tion condihybridiza-tions and starting mRNA quantity and quality could introduce spurious signals whose origins are technical rather than biological. To address this issue, we applied the technical bias cor-rection proposed by Eklund and Szallasi[58]to all GEO data. Our initial compendium also reflected a non-uniform sampling of hu-man biology due to biases in the biological conditions commonly investigated (Supplementary Fig. 1). In a study to mine functional gene relationships from a large microarray compendium,
Hutten-Table 2(continued)
Component (Dexpr)** Annotation p-Value
Regulation of translational initiation 4.18E04 Ribonucleoprotein complex biogenesis 3.64E03
GEO experiments with high expression of this component
GSE10358 Discovery and validation of expression data for the Genomics of Acute Myeloid Leukemia Program at Washington University GSE10609 The recurrent SET-NUP214 fusion as a new HOXA activation mechanism in pediatric T-ALL
GSE2109 Expression Project for Oncology (expO)
GSE10792 Genome wide genotyping and gene expression data of childhood B-cell precursor ALL without known genetic aberrations GSE7307 Human body index – transcriptional profiling
101 Ingenuity canonical pathways
(2.68) None
GO categories
Defense response 2.22E03
Icosanoid biosynthetic process 5.91E03
Immune system process 8.37E03
GEO experiments with high expression of this component
GSE10358 Discovery and validation of expression data for the Genomics of Acute Myeloid Leukemia Program at Washington University GSE7757 Robustness of gene expression signatures in leukemia: comparison of three distinct total RNA preparation procedures GSE8023 AML1-ETO transduced human cord blood cells, CD34 selected, compared to normal cord blood cells, CD34 selected
*Only the top five annotations in each category are shown. For a full list, seeSupplementary Table 4.p-Values for ingenuity canonical pathways have Benjamini–Hochberg
correction applied.p-Values for GO categories have Bonferroni correction applied.
**
hower et al. applied Bayesian normalization to account for the over-representation of certain biological or experimental condi-tions[84]. Similarly, we wished to derive a broad but even sam-pling of human biology; we did not want our fundamental components to describe a disproportional number of pathways un-ique to cancer, for example. We applied a grouping method based on hierarchical clustering to create a meta-compendium that down-weighted the contributions from over-represented condi-tions and eliminated expression profiles that did not appear repro-ducibly in the compendium. In the process, we averaged
microarray profiles within the same cluster, possibly removing information about some of the less well-represented transcrip-tional subunits present within datasets. However, we wanted to fo-cus on modules active in multiple experiments throughout our collection, so we chose to retain well-represented transcriptional processes at the expense of less well-represented ones.
Additionally, this procedure for normalizing the weights of dif-ferent biological conditions resulted in the removal of over 3000 arrays. Of these arrays, approximately 1900 of them consisted of tumor samples derived from a single compilation dataset (GEO
Fig. 5.FC-66 expression of the Ingenuity NF-jB Signaling canonical pathway. Ingenuity software overlaid gene expression loadings from FC-66 onto a pre-designed pathway. Red = over-expressed in PTL-treated versus untreated, green = under-expressed.
accession GSE2109). We note, however, that even with this nor-malization, the scope of our results depends on the sampling of biology available.
In our analysis, we used ICA to identify gene modules that vary together across our gene expression compendium. While Fehr-mann et al. used principal component analysis (PCA) for a similar analysis[21], ICA provides a complementary method for analyzing gene expression data[31]. At the same time, ICA does not rely on prior knowledge for identification of gene modules; although prior knowledge may enhance the analysis of well-studied biological processes[16,29], we chose to use gene expression data alone to guide the formation of our gene modules. In this context, ICA has two major procedural limitations. First, the user must specify the number of components to extract. Like other studies using ICA, we searched for the maximum possible number of components (423, the number of samples in the meta-compendium), assuming that more biological processes exist than we can describe with this number of sources[31]. Second, ICA is a stochastic algorithm. To extract robust biological signals from the meta-compendium, we repeated ICA twenty times. In contrast to approaches that mitigate unstable signals by eliminating them entirely[37], we clustered the results to obtain more reliable component estimates[66]using partitioning around medoids. To maximize our ability to compre-hensively model microarray data, we included all 423 components in downstream analyses. One final challenge associated with ma-trix decomposition methods involved identifying active genes. Although alternative methods exist[38], we followed the approach of Liebermeister[28]and used a gene loading threshold.
To confirm the biological relevance of these gene modules, we devised a method to analyze differential expression in the fea-ture-space defined by our fundamental components. This follows
naturally from the typical assumption in work with ICA that the ac-tive genes in each component are differentially expressed[28,35]. Although several groups have used principal component features to enhance the detection of individual differentially expressed genes[85]or gene pathways from GO and KEGG[86], the opportu-nity to assess the differential expression of entire gene modules has not been adequately explored. We exploited the component loadings in the mixing matrix of the ICA decomposition and used the moderatedttest[61]to assess the differential expression of globally-derived gene modules within a single dataset. Analysis in feature-space reduced the number of statistical tests performed, decreasing the need for multiple hypothesis testing correction and increasing the sensitivity of biological signal detection [87]. We empirically selected differentp-value cutoffs for DE gene analysis (p= 0.05) and DE component analysis (p= 0.001) to optimize the performance of each method.
DE analysis in feature-space outperformed similar analysis in gene-space, identifying more known PTL-associated genes as signif-icant (Fig. 6). Additionally, the pathways enriched in differentially expressed FCs proved to be highly consistent with previously char-acterized PTL effects on cellular processes, identifying both NF-
j
B signaling and oxidative stress as major mechanisms involved in re-sponse to PTL treatment. Because we modeled a gene expression profile as a linear combination of components, however, we must interpret pathway predictions with care. An active gene in a DE com-ponent may not necessarily be a DE gene in gene-space analysis. In our investigation of the mechanism of parthenolide, FC-66 loadings of genes in the NF-j
B pathway did not necessarily mirror the direction of regulation in differential gene expression analysis (Supplementary Fig. 4). Complex gene networks such as the NF-j
B signaling pathway contain proteins with both inhibitory and stimu-latory effects, so the finding that FC-66 was over-expressed in PTL-treated cells did not necessarily indicate that the entire NF-j
B pathway was both transcriptionally and functionally up-regulated. Rather, different genes responded to this stimulus according to their role in the pathway (Fig. 5). As a further demonstration of this tran-scriptional complexity, we note that our method identified the hub gene Cox-2 (PTGS2) as differentially up-regulated in FC-406 and down-regulated in FC-101 (data not shown). While we were unable to determine the net direction in which PTL response influences Cox-2 expression, our result corroborates previous data suggesting thatTable 3
32 hub genes from DE fundamental components in PTL-treated versus untreated AML CD34+
cells.* Connections Gene FC(s) 47 XBP1 84 33 TNF 66 30 LCK 43 25,14,11 CEBPB 192,362,406 21 IL1B 101 18,13 CEBPA 101,406 16 ZAP70 43 15 CNBP 62 15 CD40LG 43 14,11 FOS 62,359 14 IL1A 73 14 IL10 406 14 HGF 406 13 HSPA8 362 13 HLA-B 84 12 HSPA5 84 12 NFKB1 66 11,10 EP300 66,406 11,9 STAT4 66,43 11 HSP90AA1 362 11 LAT 43 11 CD28 43 10 IL15 406 10 CD247 43 10 CD3E 43 9 PTGS2 101 9 EIF3A 62 9 HSP90AB1 362 9 CD2 43 9 VEGFA 79 9 MMP9 79 8 CREM 66
*Boldindicates a gene that does not appear on the text-mined
list and thus represents a potentially novel prediction.
Fig. 6.Comparison of differential expression analysis of GSE7538 in gene- and fundamental component feature-space. We defined hub genes as the most highly-connected 1% of the 3278 genes active in at least one of the differentially expressed FCs.p-Values denote enrichment of known PTL-associated genes in each group, calculated using the hypergeometric test. Fractions represent the number of known PTL-associated genes and the total number of genes in each set (known/total).
Cox-2 protein activity changes in response to PTL treatment[88,89]. This demonstrates the enhanced sensitivity of our approach, as DE analysis in gene-space did not identify Cox-2 as an important gene in PTL response.
After deriving gene modules using a data-driven approach, we used ontological annotations to provide a preliminary indication of the functional relationships between active genes. We found that for some of these gene modules, Ingenuity Pathway Analysis provided more descriptive relationships between genes, especially in the realm of signaling pathways (e.g. FC-66,Table 2). Our anal-ysis of the mechanism of PTL, a drug that affects the NF-
j
B signal-ing pathway, particularly benefited from this form of annotation. In other cases, GO Biological Process categories labeled components where Ingenuity did not (e.g. FC-101,Table 2). Still, annotation of our fundamental components with GO categories left 131 compo-nents unlabeled, suggesting that GO does not completely describe some functional gene relationships. Indeed, some of the DE funda-mental components identified in our analysis of PTL had neither descriptive GO categories nor significant Ingenuity Pathways. FC-208, for instance, was highly expressed in several cancer-related experiments, but was down-regulated in response to PTL (Table 2). This gene module may represent a cancer-specific transcrip-tional subunit that is suppressed by PTL. Similarly, FC-101 had va-gue GO annotations including ‘‘defense response”, but was highly expressed in three independent AML experiments (Table 2). The three genes with the highest weights in FC-101 consisted of DNTT, whose expression in AML cells correlates with outcome[90,91]; SOCS2, which is part of a gene signature prognostic for an unfavor-able AML subtype[92]; and DDIT4, whose mRNA levels are in-duced in AML cell lines and normal CD34+ cells during differentiation[93]. Thus our method detected a transcriptional subunit active in AML that is not adequately characterized by tra-ditional functional analysis methods.Since ICA defines components in a manner that allows a gene to participate in more than one transcriptional module, our approach also provides a mechanism for modeling context specificity[13]. As we highlighted using the example of Cox-2, our method defines the functional role of a gene in the context of other genes. Given the independence properties of components derived by ICA, we interpret these results as defining several specific contexts in which each gene operates. Furthermore, since we can identify experimental conditions that lead to the co-expression of sets of genes, we can match gene modules with their biological contexts. For example, the set of genes in the dominant module of FC-101 might be labeled as ‘‘up-regulated in AML” and ‘‘differentially ex-pressed in PTL response”. This context awareness will prove invaluable as we continue to explore the functional relationships between genes at the genomic scale.
5. Conclusion
As opposed to a top-down resource such as the Gene Ontology (GO), we provide an entirely data-driven way to identify gene modules in a meta-analysis of expression data using ICA. These modules contain functionally coherent sets of genes and increase the descriptive power of differential expression analysis. The re-sults of our analysis of a parthenolide-related dataset suggests that the fundamental components we have identified may serve as use-ful, reusable features; although we applied these modules to exam-ine a microarray experiment from our original compendium, we can use the same components to investigate new expression data. In addition to differential expression analysis, these gene modules could serve as data-driven gene sets for Gene Set Enrichment Anal-ysis[18]or as features for clustering and classifying diverse micro-array expression data. Given the wide range of biological pathways
represented in the compendium, these components could be applied to query a microarray database for experiments that modulate similar biological processes. Finally, we can use this data-driven framework to annotate genes with context-specific functional relationships.
6. Availability
The fundamental components, gene lists for our fundamental gene expression modules, and the R implementation of our method are available athttp://www.simtk.org/home/fcanalysis.
7. Funding
This work was supported by NIH Grant 5U01GM061374-08 for the Pharmacogenomics Knowledge Base. Computational resources were provided by the Stanford Bio-X2 Cluster, supported by NSF award CNS-0619926. J.M.E. was supported in part by a Stanford Bio-X Undergraduate Research Award. B.J.D. was supported by the Geraldine Jackson Fuhrman Stanford Graduate Fellowship and an HHMI predoctoral fellowship.
Acknowledgments
The authors wish to thank Craig Jordan for sharing his insights into parthenolide response; Yael Garten for identifying partheno-lide-associated genes with Pharmspresso; and Ramon Felciano for supporting the work with Ingenuity Pathway Analysis.
Appendix A. Supplementary data
Supplementary data associated with this article can be found, in the online version, atdoi:10.1016/j.jbi.2010.07.001.
References
[1] Hughes TR, Marton MJ, Jones AR, Roberts CJ, Stoughton R, Armour CD, et al. Functional discovery via a compendium of expression profiles. Cell 2000;102(1):109–26.
[2] Rhodes DR, Barrette TR, Rubin MA, Ghosh D, Chinnaiyan AM. Meta-analysis of microarrays: interstudy validation of gene expression profiles reveals pathway dysregulation in prostate cancer. Cancer Res 2002;62(15):4427–33. [3] Ihmels J, Friedlander G, Bergmann S, Sarig O, Ziv Y, Barkai N. Revealing modular
organization in the yeast transcriptional network. Nat Genet 2002;31(4): 370–7.
[4] Ramaswamy S, Ross KN, Lander ES, Golub TR. A molecular signature of metastasis in primary solid tumors. Nat Genet 2003;33(1):49–54.
[5] Xu L, Tan AC, Naiman DQ, Geman D, Winslow RL. Robust prostate cancer marker genes emerge from direct integration of inter-study microarray data. Bioinformatics 2005;21(20):3905–11.
[6] Lamb J, Crawford ED, Peck D, Modell JW, Blat IC, Wrobel MJ, et al. The connectivity map: using gene-expression signatures to connect small molecules, genes, and disease. Science 2006;313(5795):1929–35.
[7] Hibbs MA, Hess DC, Myers CL, Huttenhower C, Li K, Troyanskaya OG. Exploring the functional landscape of gene expression: directed search of large microarray compendia. Bioinformatics 2007;23(20):2692–9.
[8] Hassane DC, Guzman ML, Corbett C, Li X, Abboud R, Young F, et al. Discovery of agents that eradicate leukemia stem cells using an in silico screen of public gene expression data. Blood 2008;111(12):5654–62.
[9] Dudley JT, Tibshirani R, Deshpande T, Butte AJ. Disease signatures are robust across tissues and experiments. Mol Syst Biol 2009;5:307.
[10] Daigle Jr BJ, Deng A, McLaughlin T, Cushman SW, Cam MC, Reaven G, et al. Using pre-existing microarray datasets to increase experimental power: application to insulin resistance. PLoS Comput Biol 2010;6(3):e1000718. [11] Khatri P, Dra˘ghici S. Ontological analysis of gene expression data: current
tools, limitations, and open problems. Bioinformatics 2005;21(18):3587–95. [12] Ihmels J, Bergmann S, Berman J, Barkai N. Comparative gene expression
analysis by differential clustering approach: application to the Candida albicans transcription program. PLoS Genet 2005;1(3):e39.
[13] Huang Y, Li H, Hu H, Yan X, Waterman MS, Huang H, et al. Systematic discovery of functional modules and context-specific functional annotation of human genome. Bioinformatics 2007;23(13):i222–9.
[14] Eisen MB, Spellman PT, Brown PO, Botstein D. Cluster analysis and display of genome-wide expression patterns. Proc Natl Acad Sci USA 1998;95(25): 14863–8.
[15] Spellman PT, Sherlock G, Zhang MQ, Iyer VR, Anders K, Eisen MB, et al. Comprehensive identification of cell cycle-regulated genes of the yeast
Saccharomyces cerevisiae by microarray hybridization. Mol Biol Cell 1998;9(12):3273–97.
[16] Segal E, Shapira M, Regev A, Pe’er D, Botstein D, Koller D, et al. Module networks: identifying regulatory modules and their condition-specific regulators from gene expression data. Nat Genet 2003;34(2):166–76. [17] Bar-Joseph Z, Gerber GK, Lee TI, Rinaldi NJ, Yoo JY, Robert F, et al.
Computational discovery of gene modules and regulatory networks. Nat Biotechnol 2003;21(11):1337–42.
[18] Subramanian A, Tamayo P, Mootha VK, Mukherjee S, Ebert BL, Gillette MA, et al. Gene set enrichment analysis: a knowledge-based approach for interpreting genome-wide expression profiles. Proc Natl Acad Sci USA 2005;102(43):15545–50.
[19] Ihmels J, Bergmann S, Barkai N. Defining transcription modules using large-scale gene expression data. Bioinformatics 2004;20(13):1993–2003. [20] Wang X, Dalkic E, Wu M, Chan C. Gene module level analysis: identification to
networks and dynamics. Curr Opin Biotechnol 2008;19(5):482–91. [21] Fehrmann RSN, de Jonge HJM, Ter Elst A, de Vries A, Crijns AGP, Weidenaar AC,
et al. A new perspective on transcriptional system regulation (TSR): towards TSR profiling. PLoS One 2008;3(2):e1656.
[22] Jeffery CJ. Moonlighting proteins: old proteins learning new tricks. Trends Genet 2003;19(8):415–7.
[23] Madeira SC, Oliveira AL. Biclustering algorithms for biological data analysis: a survey. IEEE/ACM Trans Comput Biol Bioinform 2004;1(1):24–45.
[24] Cheng Y, Church GM. Biclustering of expression data. Proc Int Conf Intell Syst Mol Biol 2000;8:93–103.
[25] Carmona-Saez P, Pascual-Marqui RD, Tirado F, Carazo JM, Pascual-Montano A. Biclustering of gene expression data by non-smooth non-negative matrix factorization. BMC Bioinform 2006;7:78.
[26] Raychaudhuri S, Stuart JM, Altman RB. Principal components analysis to summarize microarray experiments: application to sporulation time series. Pac Symp Biocomput 2000:455–66.
[27] Alter O, Brown PO, Botstein D. Singular value decomposition for genome-wide expression data processing and modeling. Proc Natl Acad Sci USA 2000;97(18): 10101–6.
[28] Liebermeister W. Linear modes of gene expression determined by independent component analysis. Bioinformatics 2002;18(1):51–60.
[29] Liao JC, Boscolo R, Yang Y, Tran LM, Sabatti C, Roychowdhury VP. Network component analysis: reconstruction of regulatory signals in biological systems. Proc Natl Acad Sci USA 2003;100(26):15522–7.
[30] Gong T, Xuan J, Wang C, Li H, Hoffman E, Clarke R, et al. Gene module identification from microarray data using nonnegative independent component analysis. Gene Regul Syst Biol 2007;1:349–63.
[31] Lee S, Batzoglou S. Application of independent component analysis to microarrays. Genome Biol 2003;4(11):R76.
[32] Li Y, Adali T, Calhoun VD. Estimating the number of independent components for functional magnetic resonance imaging data. Hum Brain Mapp 2007;28(11):1251–66.
[33] Purdom E, Holmes SP. Error distribution for gene expression data. Stat Appl Genet Mol Biol 2005;4 [Article 16].
[34] Salas-Gonzalez D, Kuruoglu E, Ruiz D. A heavy-tailed empirical Bayes method for replicated microarray data. Comput Stat Data Anal 2009;53(5):1535–46. [35] Saidi SA, Holland CM, Kreil DP, MacKay DJC, Charnock-Jones DS, Print CG, et al.
Independent component analysis of microarray data in the study of endometrial cancer. Oncogene 2004;23(39):6677–83.
[36] Martoglio A, Miskin JW, Smith SK, MacKay DJC. A decomposition model to track gene expression signatures: preview on observer-independent classification of ovarian cancer. Bioinformatics 2002;18(12):1617–24. [37] Chiappetta P, Roubaud MC, Torrésani B. Blind source separation and the
analysis of microarray data. J Comput Biol 2004;11(6):1090–109.
[38] Frigyesi A, Veerla S, Lindgren D, Höglund M. Independent component analysis reveals new and biologically significant structures in micro array data. BMC Bioinform 2006;7:290.
[39] Teschendorff AE, Journée M, Absil PA, Sepulchre R, Caldas C. Elucidating the altered transcriptional programs in breast cancer using independent component analysis. PLoS Comput Biol 2007;3(8):e161.
[40] Zhang XW, Yap YL, Wei D, Chen F, Danchin A. Molecular diagnosis of human cancer type by gene expression profiles and independent component analysis. Eur J Hum Genet 2005;13(12):1303–11.
[41] Zheng C, Huang D, Kong X, Zhao X. Gene expression data classification using consensus independent component analysis. Genom Proteom Bioinform 2008;6(2):74–82.
[42] Li H, Zhan M. Unraveling transcriptional regulatory programs by integrative analysis of microarray and transcription factor binding data. Bioinformatics 2008;24(17):1874–80.
[43] Capobianco E. Model validation for gene selection and regulation maps. Funct Integr Genom 2008;8(2):87–99.
[44] Chen L, Xuan J, Wang C, Shih I, Wang Y, Zhang Z, et al. Knowledge-guided multi-scale independent component analysis for biomarker identification. BMC Bioinform 2008;9:416.
[45] Lutter D, Langmann T, Ugocsai P, Moehle C, Seibold E, Splettstoesser WD, et al. Tularensis holartica. J Biomed Inform 2009;42(4):605–11.
[46] Guzman ML, Rossi RM, Karnischky L, Li X, Peterson DR, Howard DS, et al. The sesquiterpene lactone parthenolide induces apoptosis of human acute myelogenous leukemia stem and progenitor cells. Blood 2005;105(11):4163–9. [47] Wang W, Adachi M, Kawamura R, Sakamoto H, Hayashi T, Ishida T, et al. Parthenolide-induced apoptosis in multiple myeloma cells involves reactive oxygen species generation and cell sensitivity depends on catalase activity. Apoptosis 2006;11(12):2225–35.
[48] Anderson KN, Bejcek BE. Parthenolide induces apoptosis in glioblastomas without affecting NF-kappaB. J Pharmacol Sci 2008;106(2):318–20. [49] Liu Y, Lu W, Guo J, Du J, Li T, Wu J, et al. A potential target associated with both
cancer and cancer stem cells: a combination therapy for eradication of breast cancer using vinorelbine stealthy liposomes plus parthenolide stealthy liposomes. J Control Release 2008;129(1):18–25.
[50] Suvannasankha A, Crean CD, Shanmugam R, Farag SS, Abonour R, Boswell HS, et al. Antimyeloma effects of a sesquiterpene lactone parthenolide. Clin Cancer Res 2008;14(6):1814–22.
[51] Wen J, You K, Lee S, Song C, Kim D. Oxidative stress-mediated apoptosis. The anticancer effect of the sesquiterpene lactone parthenolide. J Biol Chem 2002;277(41):38954–64.
[52] Nakshatri H, Rice SE, Bhat-Nakshatri P. Antitumor agent parthenolide reverses resistance of breast cancer cells to tumor necrosis factor-related apoptosis-inducing ligand through sustained activation of c-Jun N-terminal kinase. Oncogene 2004;23(44):7330–44.
[53] Sobota R, Szwed M, Kasza A, Bugno M, Kordula T. Parthenolide inhibits activation of signal transducers and activators of transcription (STATs) induced by cytokines of the IL-6 family. Biochem Biophys Res Commun 2000;267(1): 329–33.
[54] Hehner SP, Hofmann TG, Dröge W, Schmitz ML. The antiinflammatory sesquiterpene lactone parthenolide inhibits NF-kappa B by targeting the I kappa B kinase complex. J Immunol 1999;163(10):5617–23.
[55] Kwok BH, Koh B, Ndubuisi MI, Elofsson M, Crews CM. The anti-inflammatory natural product parthenolide from the medicinal herb Feverfew directly binds to and inhibits IkappaB kinase. Chem Biol 2001;8(8):759–66.
[56] Edgar R, Domrachev M, Lash AE. Gene expression omnibus: NCBI gene expression and hybridization array data repository. Nucleic Acids Res 2002;30(1):207–10.
[57] Irizarry RA, Hobbs B, Collin F, Beazer-Barclay YD, Antonellis KJ, Scherf U, et al. Exploration, normalization, and summaries of high density oligonucleotide array probe level data. Biostatistics 2003;4(2):249–64.
[58] Eklund AC, Szallasi Z. Correction of technical bias in clinical microarray data improves concordance with known biological information. Genome Biol 2008;9(2):R26.
[59] Gentleman RC, Carey VJ, Bates DM, Bolstad B, Dettling M, Dudoit S, et al. Bioconductor: open software development for computational biology and bioinformatics. Genome Biol 2004;5(10):R80.
[60] Bolstad BM, Irizarry RA, Astrand M, Speed TP. A comparison of normalization methods for high density oligonucleotide array data based on variance and bias. Bioinformatics 2003;19(2):185–93.
[61] Smyth GK. Linear models and empirical Bayes methods for assessing differential expression in microarray experiments. Stat Appl Genet Mol Biol 2004;3 [Article 3].
[62] Balasubramaniyan R, Hüllermeier E, Weskamp N, Kämper J. Clustering of gene expression data using a local shape-based similarity measure. Bioinformatics 2005;21(7):1069–77.
[63] Yona G, Dirks W, Rahman S, Lin DM. Effective similarity measures for expression profiles. Bioinformatics 2006;22(13):1616–22.
[64] Kong W, Vanderburg CR, Gunshin H, Rogers JT, Huang X. A review of independent component analysis application to microarray gene expression data. Biotechniques 2008;45(5):501–20.
[65] Hyvarinen A. Fast and robust fixed-point algorithms for independent component analysis. IEEE Trans Neural Netw 1999;10(3):626–34.
[66] Himberg J, Hyvärinen A, Esposito F. Validating the independent components of neuroimaging time series via clustering and visualization. Neuroimage 2004;22(3):1214–22.
[67] Kaufman L, Rousseeuw PJ. Finding groups in data: an introduction to cluster analysis. Hoboken, NJ: Wiley; 2005.
[68] Alexa A, Rahnenführer J, Lengauer T. Improved scoring of functional groups from gene expression data by decorrelating GO graph structure. Bioinformatics 2006;22(13):1600–7.
[69] Garten Y, Altman RB. Pharmspresso: a text mining tool for extraction of pharmacogenomic concepts and relationships from full text. BMC Bioinform 2009;10(Suppl. 2):S6.
[70] Roden JC, King BW, Trout D, Mortazavi A, Wold BJ, Hart CE. Mining gene expression data by interpreting principal components. BMC Bioinform 2006;7:194.
[71] Ray A, Prefontaine KE. Physical association and functional antagonism between the p65 subunit of transcription factor NF-kappa B and the glucocorticoid receptor. Proc Natl Acad Sci USA 1994;91(2):752–6. [72] Barnes PJ, Karin M. Nuclear factor-kappaB: a pivotal transcription factor in
chronic inflammatory diseases. New Engl J Med 1997;336(15):1066–71. [73] Dennis JW, Granovsky M, Warren CE. Glycoprotein glycosylation and cancer
progression. Biochim Biophys Acta 1999;1473(1):21–34.
[74] Jeong H, Mason SP, Barabási AL, Oltvai ZN. Lethality and centrality in protein networks. Nature 2001;411(6833):41–2.
[75] Tong AHY, Lesage G, Bader GD, Ding H, Xu H, Xin X, et al. Global mapping of the yeast genetic interaction network. Science 2004;303(5659):808–13.
[76] Carlson MRJ, Zhang B, Fang Z, Mischel PS, Horvath S, Nelson SF. Gene connectivity, function, and sequence conservation: predictions from modular yeast co-expression networks. BMC Genom 2006;7:40.
[77] Carter SL, Brechbühler CM, Griffin M, Bond AT. Gene co-expression network topology provides a framework for molecular characterization of cellular state. Bioinformatics 2004;20(14):2242–50.
[78] Mueller BU, Pabst T. C/EBPalpha and the pathophysiology of acute myeloid leukemia. Curr Opin Hematol 2006;13(1):7–14.
[79] Kawasaki BT, Hurt EM, Kalathur M, Duhagon MA, Milner JA, Kim YS, et al. Effects of the sesquiterpene lactone parthenolide on prostate tumor-initiating cells: an integrated molecular profiling approach. Prostate 2009;69(8):827–37. [80] Zhang Y, Wang L, Jove R, Vande Woude GF. Requirement of Stat3 signaling for
HGF/SF-Met mediated tumorigenesis. Oncogene 2002;21(2):217–26. [81] Michelotti EF, Tomonaga T, Krutzsch H, Levens D. Cellular nucleic acid binding
protein regulates the CT element of the human c-myc protooncogene. J Biol Chem 1995;270(16):9494–9.
[82] Lewis RE, Cruse JM, Sanders CM, Webb RN, Suggs JL. Aberrant expression of T-cell markers in acute myeloid leukemia. Exp Mol Pathol 2007;83(3):462–3. [83] Majeti R, Becker MW, Tian Q, Lee TM, Yan X, Liu R, et al. Dysregulated gene
expression networks in human acute myelogenous leukemia stem cells. Proc Natl Acad Sci USA 2009;106(9):3396–401.
[84] Huttenhower C, Haley EM, Hibbs MA, Dumeaux V, Barrett DR, Coller HA, et al. Exploring the human genome with functional maps. Genome Res 2009;19(6):1093–106.
[85] Jonnalagadda S, Srinivasan R. Principal components analysis based methodology to identify differentially expressed genes in time-course microarray data. BMC Bioinform 2008;9:267.
[86] Ma S, Kosorok MR. Identification of differential gene pathways with principal component analysis. Bioinformatics 2009;25(7):882–9.
[87] Qin H, Feng T, Harding SA, Tsai C, Zhang S. An efficient method to identify differentially expressed genes in microarray experiments. Bioinformatics 2008;24(14):1583–9.
[88] Hwang D, Fischer NH, Jang BC, Tak H, Kim JK, Lee W. Inhibition of the expression of inducible cyclooxygenase and proinflammatory cytokines by sesquiterpene lactones in macrophages correlates with the inhibition of MAP kinases. Biochem Biophys Res Commun 1996;226(3):810–8.
[89] Oka D, Nishimura K, Shiba M, Nakai Y, Arai Y, Nakayama M, et al. Sesquiterpene lactone parthenolide suppresses tumor growth in a xenograft model of renal cell carcinoma by inhibiting the activation of NF-kappaB. Int J Cancer 2007;120(12):2576–81.
[90] Venditti A, Del Poeta G, Buccisano F, Tamburini A, Cox-Froncillo MC, Aronica G, et al. Prognostic relevance of the expression of Tdt and CD7 in 335 cases of acute myeloid leukemia. Leukemia 1998;12(7):1056–63.
[91] Huh YO, Smith TL, Collins P, Bueso-Ramos C, Albitar M, Kantarjian HM, et al. Terminal deoxynucleotidyl transferase expression in acute myelogenous leukemia and myelodysplasia as determined by flow cytometry. Leuk Lymphoma 2000;37(3–4):319–31.
[92] Bullinger L, Döhner K, Kranz R, Stirner C, Fröhling S, Scholl C, et al. An FLT3 gene-expression signature predicts clinical outcome in normal karyotype AML. Blood 2008;111(9):4490–5.
[93] Gery S, Park DJ, Vuong PT, Virk RK, Muller CI, Hofmann W, et al. RTP801 is a novel retinoic acid-responsive gene associated with myeloid differentiation. Exp Hematol 2007;35(4):572–8.