http://www.rfexposurelab.com
R&D TESTING
SAR EVALUATION
Bodywell Chip Dates of Test: February 5, 2013
1815 NE 146th Test Report Number: R&D.20130207
Miami, FL 33181
I attest to the accuracy of the data. All measurements were performed by myself or were made under my supervision and are correct to the best of my knowledge and belief. I assume full responsibility for the completeness of these measurements and vouch for the qualifications of all persons taking them.
Jay M. Moulton Vice President
Certificate # 2387.01
Model(s): iPad with Bodywell Chip Standard
Test Sample: Production Units
Serial Number: N/A
Equipment Type: Cellular Handset
Classification: Portable Transmitter Next to Body
TX Frequency Range: 836.52 MHz
Frequency Tolerance: ± 2.5 ppm
Maximum RF Output: Not Measured
Signal Modulation: CDMA
Accessories: Bodywell Chip Standard
Antenna Type: Standard
Battery: Standard
Application Type: R&D
FCC Rule Parts: Part 2, 22
KDB Test Methodology: KDB 447498, KDB 648474
Table of Contents
1. Introduction ... 3
SAR Definition [5] ... 3
2. SAR Measurement Setup ... 4
Robotic System ... 4
System Hardware ... 4
System Electronics ... 5
Probe Measurement System ... 5
3. Probe and Dipole Calibration ...10
4. Phantom & Simulating Tissue Specifications ...11
Head & Body Simulating Mixture Characterization ...11
Device Holder ...11
5. Definition of Reference Points ...12
Ear Reference Point ...12
Device Reference Points ...12
6. Test Configuration Positions ...13
Positioning for Cheek/Touch [5] ...13
Positioning for Ear / 15˚ Tilt [5] ...14
Body Worn Configurations ...15
7. ANSI/IEEE C95.1 – 1992 RF Exposure Limits [2] ...16
Uncontrolled Environment ...16
Controlled Environment ...16
8. Measurement Uncertainty ...17
9. System Validation...18
Tissue Verification ...18
10. SAR Test Data Summary ...19
Procedures Used To Establish Test Signal ...19
Device Test Condition ...19
SAR Data Summary – Body SAR ...20
11. Test Equipment List ...21
12. Conclusion ...22
13. References ...23
Appendix A – System Validation Plots and Data ...24
Appendix B – SAR Test Data Plots ...29
Appendix C – Probe Calibration Data Sheets ...32
Appendix D – Dipole Calibration Data Sheets ...44
1.
Introduction
This measurement report shows the results of the Bodywell Chip Model iPad with Bodywell Chip Standard with FCC Part 2, 1093, ET Docket 93-62 Rules for mobile and portable devices and with RSS102 & Safety Code 6. The FCC have adopted the guidelines for evaluating the environmental effects of radio frequency radiation in ET Docket 93-62 on August 6, 1996 to protect the public and workers from the potential hazards of RF emissions due to FCC regulated portable devices. [1], [6]
The test results recorded herein are based on a single type test of Bodywell Chip Model iPad with Bodywell Chip Standard and therefore apply only to the tested sample.
The test procedures, as described in ANSI C95.1 – 1999 Standard for Safety Levels with Respect to Human Exposure to Radio Frequency Electromagnetic Fields, 3 kHz to 300 GHz [2], ANSI C95.3 – 2002 Recommended Practice for the Measurement of Potentially Hazardous Electromagnetic Fields [3], FCC OET Bulletin 65 Supp. C – 2001 [4], IEEE Std.1528 – 2003 Recommended Practice [5], and Industry Canada Safety Code 6 Limits of Human Exposure to Radiofrequency Electromagnetic Fields in the Frequency Range from 3kHz to 300 GHz were employed.
SAR Definition [5]
Specific Absorption Rate is defined as the time derivative (rate) of the incremental energy (dW) absorbed by (dissipated in) an incremental mass (dm) contained in a volume element (dV) of a given density (ρ).
=
=
dV
dW
dt
d
dm
dW
dt
d
SAR
ρ
SAR is expressed in units of watts per kilogram (W/kg). SAR can be related to the electric field at a point by
ρ
σ
2|
|
E
SAR
=
where:σ = conductivity of the tissue (S/m)
ρ = mass density of the tissue (kg/m3)
2.
SAR Measurement Setup
Robotic System
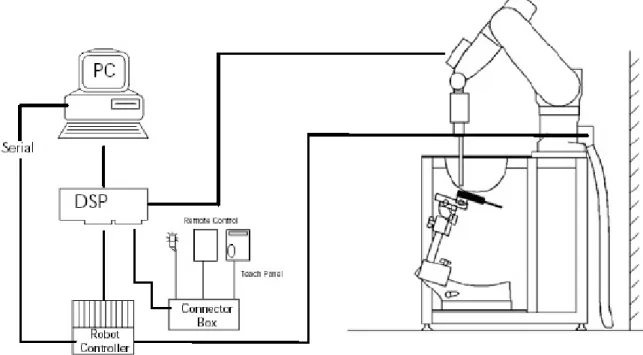
These measurements are performed using the DASY52 automated dosimetric assessment system. The DASY52 is made by Schmid & Partner Engineering AG (SPEAG) in Zurich, Switzerland and consists of high precision robotics system (Staubli), robot controller, Intel Core2 computer, near-field probe, probe alignment sensor, and the generic twin phantom containing the brain equivalent material. The robot is a six-axis industrial robot performing precise movements to position the probe to the location (points) of maximum electromagnetic field (EMF) (see Fig. 2.1).
System Hardware
A cell controller system contains the power supply, robot controller teach pendant (Joystick), and a remote control used to drive the robot motors. The PC consists of the HP Intel Core2 computer with Windows XP system and SAR Measurement Software DASY52, A/D interface card, monitor, mouse, and keyboard. The Staubli Robot is connected to the cell controller to allow software manipulation of the robot. A data acquisition electronic (DAE) circuit that performs the signal amplification, signal multiplexing, AD-conversion, offset measurements, mechanical surface detection, collision detection, etc. is connected to the Electro-optical coupler (EOC). The EOC performs the conversion from the optical into digital electric signal of the DAE and transfers data to the PC plug-in card.
The DAE4 consists of a highly sensitive electrometer-grade preamplifier with auto-zeroing, a channel and gain-switching multiplexer, a fast 16 bit AD-converter and a command decoder and control logic unit. Transmission to the PC-card is accomplished through an optical downlink for data and status information and an optical uplink for commands and clock lines. The mechanical probe mounting device includes two different sensor systems for frontal and sidewise probe contacts. They are also used for mechanical surface detection and probe collision detection. The robot uses its own controller with a built in VME-bus computer. The system is described in detail in.
Probe Measurement System
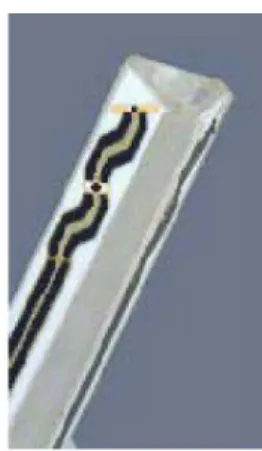
The SAR measurements were conducted with the dosimetric probe EX3DV4, designed in the classical triangular configuration (see Fig. 2.2) and optimized for dosimetric evaluation. The probe is constructed using the thick film technique; with printed resistive lines on ceramic substrates. The probe is equipped with an optical multi fiber line ending at the front of the probe tip. (see Fig. 2.3) It is connected to the EOC box on the robot arm and provides an automatic detection of the phantom surface. Half of the fibers are connected to a pulsed infrared transmitter, the other half to a synchronized receiver. As the probe approaches the surface, the reflection from the surface produces a coupling from the transmitting to the receiving fibers. This reflection increases first during the approach, reaches maximum and then decreases. If the probe is flatly touching the surface, the coupling is zero. The distance of the coupling maximum to the surface is independent of the surface reflectivity and largely independent of the surface to probe angle. The DASY52 software reads the reflection during a software approach and looks for the maximum using a 2nd order fitting. The approach is stopped at reaching the maximum.
Probe Specifications
Calibration: In air from 10 MHz to 6.0 GHz
In brain and muscle simulating tissue at Frequencies of 450 MHz, 835 MHz, 1750 MHz, 1900 MHz, 2450 MHz, 2600 MHz, 3500 MHz, 5200 MHz, 5300 MHz, 5600 MHz, 5800 MHz Frequency: 10 MHz to 6 GHz Linearity: ±0.2dB (30 MHz to 6 GHz) Dynamic: 10 mW/kg to 100 W/kg Range: Linearity: ±0.2dB
Dimensions: Overall length: 330 mm
Tip length: 20 mm
Body diameter: 12 mm
Tip diameter: 2.5 mm
Distance from probe tip to sensor center: 1 mm
Application: SAR Dosimetry Testing
Compliance tests of wireless device
Figure 2.2 Triangular Probe Configurations
Dosimetric Assessment Procedure
Each probe is calibrated according to a dosimetric assessment procedure described in with accuracy better than +/- 10%. The spherical isotropy was evaluated with the procedure described in and found to be better than +/-0.25dB. The sensitivity parameters (Norm X, Norm Y, Norm Z), the diode compression parameter (DCP) and the conversion factor (Conv F) of the probe is tested.
Free Space Assessment
The free space E-field from amplified probe outputs is determined in a test chamber. This is performed in a TEM cell for frequencies below 1 GHz, and in a waveguide above 1GHz for free space. For the free space calibration, the probe is placed in the volumetric center of the cavity at the proper orientation with the field. The probe is then rotated 360 degrees until the three channels show the maximum reading. The power density readings equates to 1 mW/cm2.
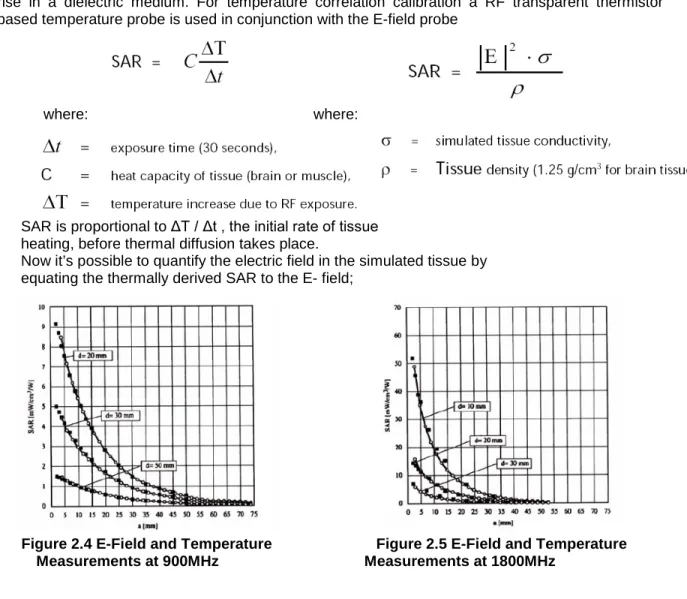
Temperature Assessment *
E-field temperature correlation calibration is performed in a flat phantom filled with the appropriate simulated brain tissue. The measured free space E-field in the medium, correlates to temperature rise in a dielectric medium. For temperature correlation calibration a RF transparent thermistor based temperature probe is used in conjunction with the E-field probe
where: where:
SAR is proportional to ΔT / Δt , the initial rate of tissue heating, before thermal diffusion takes place.
Now it’s possible to quantify the electric field in the simulated tissue by equating the thermally derived SAR to the E- field;
Data Extrapolation
The DASY52 software automatically executes the following procedures to calculate the field units from the microvolt readings at the probe connector. The first step of the evaluation is a linearization of the filtered input signal to account for the compression characteristics of the detector diode. The compensation depends on the input signal, the diode type and the DC-transmission factor from the diode to the evaluation electronics. If the exciting field is pulsed, the crest factor of the signal must be known to correctly compensate for peak power. The formula for each channel can be given like below;
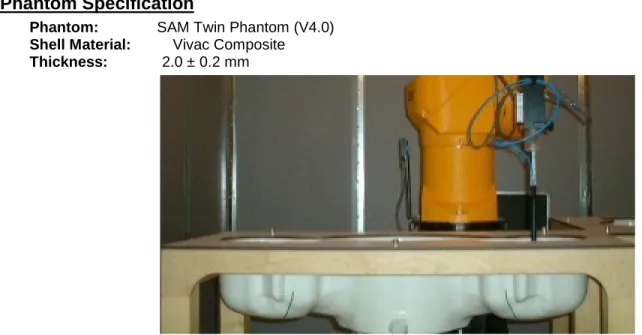
The SAM Twin Phantom V4.0 is constructed of a fiberglass shell integrated in a wooden table. The shape of the shell is based on data from an anatomical study designed to determine the maximum exposure in at least 90% of all users. It enables the dosimetric evaluation of left and right hand phone usage as well as body mounted usage at the flat phantom region. A cover prevents the evaporation of the liquid. Reference markings on the Phantom allow the complete setup of all predefined phantom positions and measurement grids by manually teaching three points in the robot. (see Fig. 2.6)
Phantom Specification
Phantom: SAM Twin Phantom (V4.0)
Shell Material: Vivac Composite
Thickness: 2.0 ± 0.2 mm
Device Holder for Transmitters
In combination with the SAM Twin Phantom V4.0 the Mounting Device (see Fig. 2.7), enables the rotation of the mounted transmitter in spherical coordinates whereby the rotation point is the ear opening. The devices can be easily, accurately, and repeat ably be positioned according to the FCC, CENELEC, IEC and IEEE specifications. The device holder can be locked at different phantom locations (left head, right head, flat phantom).
Note: A simulating human hand is not used due to the complex anatomical and geometrical structure of the hand that may produce infinite number of configurations. To produce the worst-case condition (the hand absorbs antenna output power), the
hand is omitted during the tests.
3.
Probe and Dipole Calibration
4.
Phantom & Simulating Tissue Specifications
Head & Body Simulating Mixture Characterization
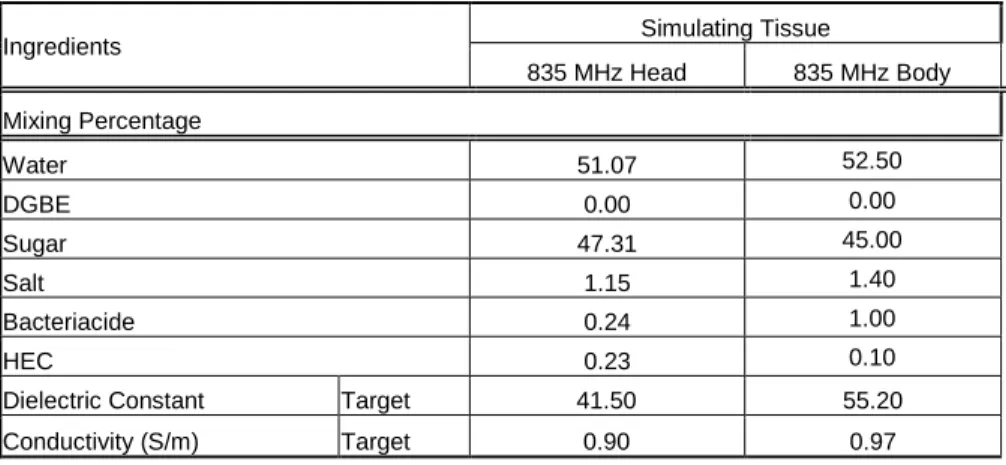
The head and body mixtures consist of the material based on the table listed below. The mixture is calibrated to obtain proper dielectric constant (permittivity) and conductivity of the desired tissue. Body tissue parameters that have not been specified in P1528 are derived from the issue dielectric parameters computed from the 4-Cole-Cole equations.
Table 4.1 Typical Composition of Ingredients for Tissue
Ingredients Simulating Tissue
835 MHz Head 835 MHz Body Mixing Percentage Water 51.07 52.50 DGBE 0.00 0.00 Sugar 47.31 45.00 Salt 1.15 1.40 Bacteriacide 0.24 1.00 HEC 0.23 0.10
Dielectric Constant Target 41.50 55.20 Conductivity (S/m) Target 0.90 0.97
Device Holder
In combination with the SAM phantom, the mounting device enables the rotation of the mounted transmitter in spherical coordinates whereby the rotation point is the ear opening. The devices can easily, accurately, and repeatably be positioned according to the FCC specifications. The device holder can be locked at different phantom locations (left head, right head, and uni-phantom).
5.
Definition of Reference Points
Ear Reference Point
Figure 5.2 shows the front, back and side views of the SAM Phantom. The point “M” is the reference point for the center of the mouth, “LE” is the left ear reference point (ERP), and “RE” is the right ERP. The ERPs are 15mm posterior to the entrance to the ear canal (EEC) along the B-M line (Back-Mouth), as shown in Figure 5.1. The plane passing through the two ear canals and M is defined as the Reference Plane. The line N-F (Neck-Front) is perpendicular to the reference plane and passing through the RE (or LE) is called the Reference Pivoting Line (see Figure 5.1). Line B-M is perpendicular to the N-F line. Both N-F and B-M lines are marked on the external phantom shell to facilitate handset positioning [5].
Figure 5.1 Close-up
Figure 5.2 Front, back and side view of SAM
side view of ERP’s
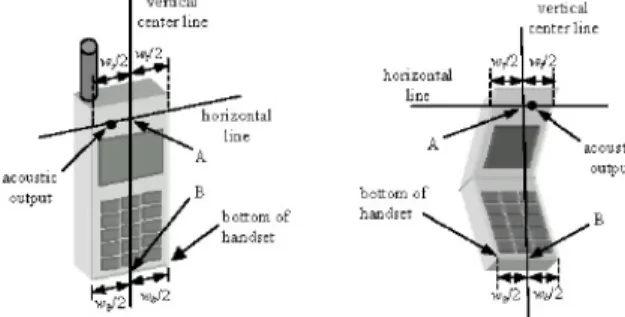
Device Reference Points
Two imaginary lines on the device need to be established: the vertical centerline and the horizontal line. The test device is placed in a normal operating position with the “test device reference point” located along the “vertical centerline” on the front of the device aligned to the “ear reference point” (See Fig. 5.3). The “test device reference point” is than located at the same level as the center of the ear reference point. The test device is positioned so that the “vertical centerline” is bisecting the front surface of the device at it’s top and bottom edges, positioning the “ear reference point” on the outer surface of both the left and right head phantoms on the ear reference point [5].
6.
Test Configuration Positions
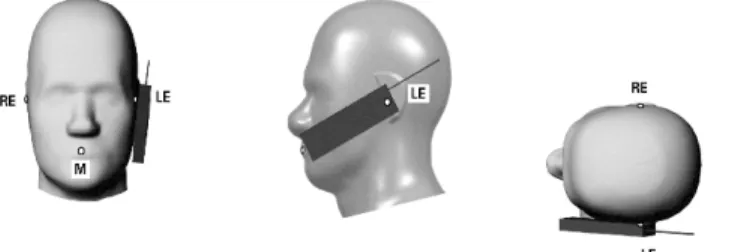
Positioning for Cheek/Touch [5]
1. Position the device close to the surface of the phantom such that point A is on the (virtual) extension of the line passing through points RE and LE on the phantom (see Figure 6.1), such that the plane defined by the vertical center line and the horizontal line of the device is approximately parallel to the sagittal plane of the phantom.
Figure 6.1 Front, Side and Top View of Cheek/Touch Position
2. Translate the device towards the phantom along the line passing through RE and LE until the device touches the ear.
3. While maintaining the device in this plane, rotate it around the LE-RE line until the vertical centerline is in the plane normal to MB-NF including the line MB (called the reference plane).
4. Rotate the device around the vertical centerline until the device (horizontal line) is symmetrical with respect to the line NF.
5. While maintaining the vertical centerline in the reference plane, keeping point A on the line passing through RE and LE and maintaining the device contact with the ear, rotate the device about the line NF until any point on the device is in contact with a phantom point below the ear (cheek). See Figure 6.2.
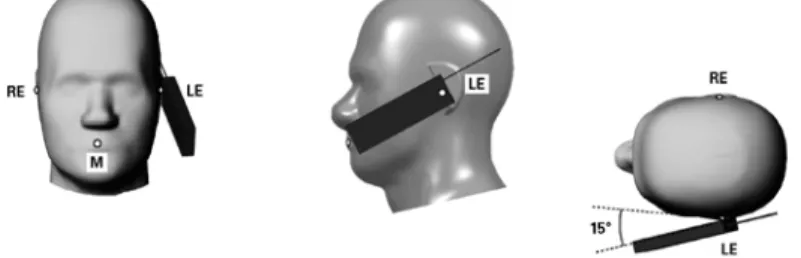
Positioning for Ear / 15˚ Tilt [5]
With the test device aligned in the Cheek/Touch Position”:
1. While maintaining the orientation of the device, retracted the device parallel to the reference plane far enough to enable a rotation of the device by 15 degrees.
2. Rotate the device around the horizontal line by 15 degrees.
3. While maintaining the orientation of the device, move the device parallel to the reference plane until any part of the device touches the head. (In this position, point A is located on the line RE-LE). The tilted position is obtained when the contact is on the pinna. If the contact is at any location other than the pinna, the angle of the device shall be reduced. The tilted position is obtained when any part of the device is in contact with the ear as well as a second part of the device is in contact with the head (see Figure 6.3).
Body Worn Configurations
Body-worn operating configurations are tested with the accessories attached to the device and positioned against a flat phantom in a normal use configuration. A device with a headset output is tested with a headset connected to the device. Body dielectric parameters are used.
Accessories for Body-worn operation configurations are divided into two categories: those that do not contain metallic components and those that do contain metallic components. When multiple accessories that do not contain metallic components are supplied with the device, the device is tested with only the accessory that dictates the closest spacing to the body. Then, when multiple accessories that contain metallic components are supplied with the device, the device is tested with each accessory that contains a unique metallic component. If multiple accessories share an identical metallic component (i.e. the same metallic belt-clip used with different holsters with no other metallic components) only the accessory that dictates the closest spacing to the body is tested.
Body-worn accessories may not always be supplied or available as options for some devices intended to be authorized for body-worn use. In this case, a test configuration where a separation distance between the back of the device and the flat phantom is used. All test position spacings are documented.
Transmitters that are designed to operate in front of a person’s face, as in push-to-talk configurations, are tested for SAR compliance with the front of the device positioned to face the flat phantom. For devices that are carried next to the body such as a shoulder, waist or chest-worn transmitters, SAR compliance is tested with the accessory(ies), including headsets and microphones, attached to the device and positioned against a flat phantom in a normal use configuration.
In all cases SAR measurements are performed to investigate the worst-case positioning. Worst-case positioning is then documented and used to perform Body SAR testing.
In order for users to be aware of the body-worn operating requirements for meeting RF exposure compliance, operating instructions and cautions statements are included in the user’s manual.
7.
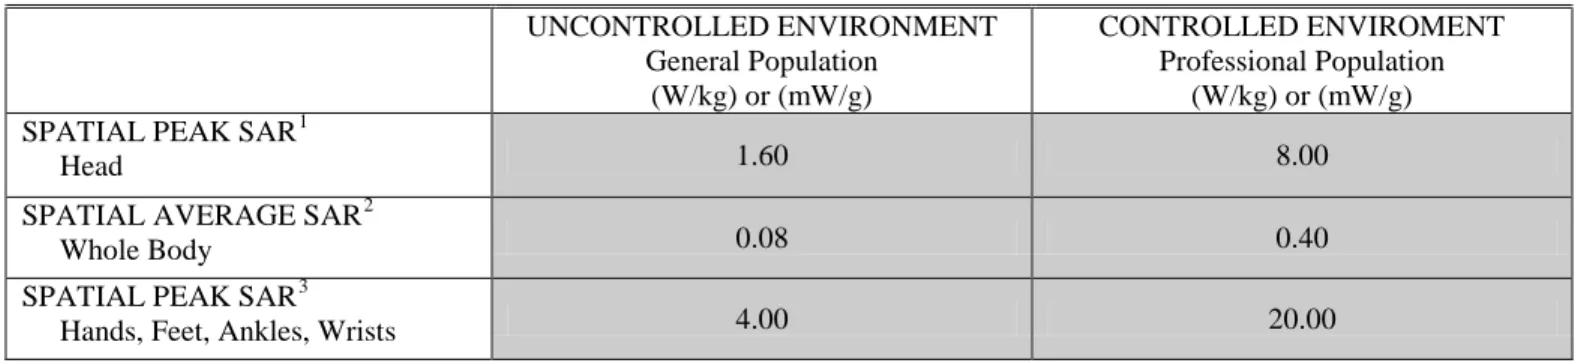
ANSI/IEEE C95.1 – 1992 RF Exposure Limits [2]
Uncontrolled Environment
Uncontrolled Environments are defined as locations where there is the exposure of individuals who have no knowledge or control of their exposure. The general population/uncontrolled exposure limits are applicable to situations in which the general public may be exposed or in which persons who are exposed as a consequence of their employment may not be made fully aware of the potential for exposure or cannot exercise control over their exposure. Members of the general public would come under this category when exposure is not employment-related; for example, in the case of a wireless transmitter that exposes persons in its vicinity.
Controlled Environment
Controlled Environments are defined as locations where there is exposure that may be incurred by persons who are aware of the potential for exposure, (i.e. as a result of employment or occupation). In general, occupational/controlled exposure limits are applicable to situations in which persons are exposed as a consequence of their employment, who have been made fully aware of the potential for exposure and can exercise control over their exposure. This exposure category is also applicable when the exposure is of a transient nature due to incidental passage through a location where the exposure levels may be higher than the general population/uncontrolled limits, but the exposed person is fully aware of the potential for exposure and can exercise control over his or her exposure by leaving the area or by some other appropriate means.
Table 5.1 Human Exposure Limits
UNCONTROLLED ENVIRONMENT General Population (W/kg) or (mW/g) CONTROLLED ENVIROMENT Professional Population (W/kg) or (mW/g)
SPATIAL PEAK SAR1
Head 1.60 8.00
SPATIAL AVERAGE SAR2
Whole Body 0.08 0.40
SPATIAL PEAK SAR3
Hands, Feet, Ankles, Wrists 4.00 20.00
1
The Spatial Peak value of the SAR averaged over any 1 gram of tissue (defined as a tissue volume in the shape of a cube) and over the appropriate averaging time.
2
The Spatial Average value of the SAR averaged over the whole body. 3
The Spatial Peak value of the SAR averaged over any 10 grams of tissue (defined as a tissue volume in the shape of a cube) and over the appropriate averaging time.
8.
Measurement Uncertainty
Exposure Assessment Measurement Uncertainty
Source of Uncertainty Tolerance Value Probability Distribution Divisor ci 1 (1-g) ci 1 (10-g) Standard Uncertainty (1-g) % Standard Uncertai nty (10-g) % vi Measurement System
Probe Calibration 3.5 normal 1 1 1 3.5 3.5 ∞
Axial Isotropy 3.7 rectangular √3 0.7 0.7 1.5 1.5 ∞
Hemispherical Isotropy
10.9 rectangular √3 0.7 0.7 4.4 4.4 ∞
Boundary Effect 1.0 rectangular √3 1 1 0.6 0.6 ∞
Linearity 4.7 rectangular √3 1 1 2.7 2.7 ∞
Detection Limit 1.0 rectangular √3 1 1 0.6 0.6 ∞
Readout Electronics 1.0 normal 1 1 1 1.0 1.0 ∞
Response Time 0.8 rectangular √3 1 1 0.5 0.5 ∞
Integration Time 1.7 rectangular √3 1 1 1.0 1.0 ∞
RF Ambient Condition 3.0 rectangular √3 1 1 1.7 1.7 ∞
Probe Positioner Mech. Restriction 0.4 rectangular √3 1 1 0.2 0.2 ∞ Probe Positioning with respect to Phantom Shell 2.9 rectangular √3 1 1 1.7 1.7 ∞ Extrapolation and Integration 3.7 rectangular √3 1 1 2.1 2.1 ∞ Test Sample Positioning 4.0 normal 1 1 1 4.0 4.0 7 Device Holder Uncertainty 2.0 normal 1 1 1 2.0 2.0 2 Drift of Output Power 4.2 rectangular √3 1 1 2.4 2.4 ∞
Phantom and Setup Phantom Uncertainty(shape & thickness tolerance) 3.4 rectangular √3 1 1 2.0 2.0 ∞ Liquid Conductivity(target) 5.0 rectangular √3 0.7 0.5 2.0 1.4 ∞ Liquid Conductivity(meas.) 0.5 normal 1 0.7 0.5 0.4 0.3 5 Liquid Permittivity(target) 5.0 rectangular √3 0.6 0.5 1.7 1.4 ∞ Liquid Permittivity(meas.) 1.0 normal 1 0.6 0.5 0.6 0.5 5 Combined Uncertainty RSS 9.6 9.4 >500 Combined Uncertainty (coverage factor=2) Normal(k=2) 19.1 18.8 >500
9.
System Validation
Tissue Verification
Table 9.1 Measured Tissue Parameters
835 MHz Head 835 MHz Body
Date(s) Feb. 5, 2013 Feb. 6, 2013
Liquid Temperature (˚C) 20.0 Target Measured Target Measured
Dielectric Constant: ε 41.50 41.33 55.20 55.91
Conductivity: σ 0.90 0.935 0.97 0.99
10. SAR Test Data Summary
See Measurement Result Data Pages
See Appendix B for SAR Test Data Plots.See Appendix C for SAR Test Setup Photos.
Procedures Used To Establish Test Signal
The device was either placed into simulated transmit mode using the manufacturer’s test codes or the actual transmission is activated through a base station simulator or similar equipment. See data pages for actual procedure used in measurement.
Device Test Condition
In order to verify that the device was tested at full power, conducted output power measurements were performed before and after each SAR measurement to confirm the output power unless otherwise noted. If a conducted power deviation of more than 5% occurred, the test was repeated. The power drift of each test is measured at the start of the test and again at the end of the test. The drift percentage is calculated by the formula ((end/start)-1)*100 and rounded to three decimal places. The drift percentage is calculated into the resultant SAR value on the data sheet for each test.
The iPad was tested on the middle channel in CDMA mode in the touch position on the flat phantom. The Bodywell Chip Standard was then applied on the iPad and the measurement was repeated. The difference in SAR is listed in the table on page 20.
SAR Data Summary – Body SAR
MEASUREMENT RESULTS
Gap Device Chip
Used Frequency Modulation Baseline SAR (W/kg) SAR (W/kg) Percentage SAR Change MHz Ch.
0 mm iPad Standard 836.52 384 CDMA 1.15 0.75 - 34.8%
Head 1.6 W/kg (mW/g)
averaged over 1 gram
1.
SAR Measurement
Phantom Configuration
Left Head
Eli4
Right Head
SAR Configuration
Head
Body
2.
Test Signal Call Mode
Test Code
Base Station Simulator
3.
Test Configuration
With Belt Clip
Without Belt Clip
N/A
4.
Tissue Depth is at least 15.0 cm
Jay M. Moulton Vice President
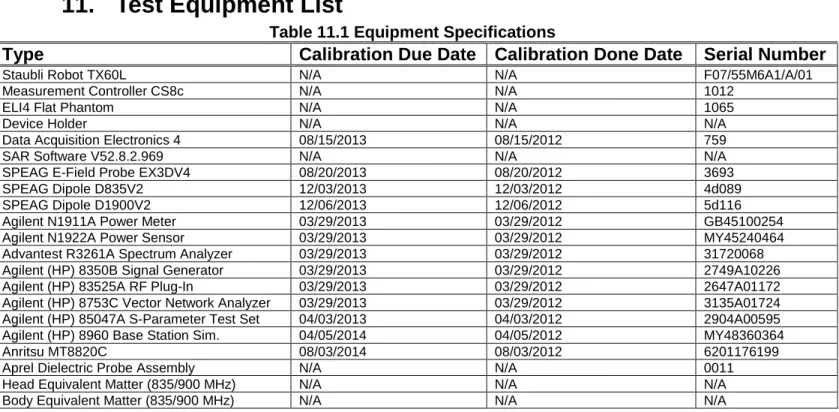
11. Test Equipment List
Table 11.1 Equipment Specifications
Type
Calibration Due Date Calibration Done Date Serial Number
Staubli Robot TX60L N/A N/A F07/55M6A1/A/01
Measurement Controller CS8c N/A N/A 1012
ELI4 Flat Phantom N/A N/A 1065
Device Holder N/A N/A N/A
Data Acquisition Electronics 4 08/15/2013 08/15/2012 759
SAR Software V52.8.2.969 N/A N/A N/A
SPEAG E-Field Probe EX3DV4 08/20/2013 08/20/2012 3693
SPEAG Dipole D835V2 12/03/2013 12/03/2012 4d089
SPEAG Dipole D1900V2 12/06/2013 12/06/2012 5d116
Agilent N1911A Power Meter 03/29/2013 03/29/2012 GB45100254 Agilent N1922A Power Sensor 03/29/2013 03/29/2012 MY45240464 Advantest R3261A Spectrum Analyzer 03/29/2013 03/29/2012 31720068 Agilent (HP) 8350B Signal Generator 03/29/2013 03/29/2012 2749A10226 Agilent (HP) 83525A RF Plug-In 03/29/2013 03/29/2012 2647A01172 Agilent (HP) 8753C Vector Network Analyzer 03/29/2013 03/29/2012 3135A01724 Agilent (HP) 85047A S-Parameter Test Set 04/03/2013 04/03/2012 2904A00595 Agilent (HP) 8960 Base Station Sim. 04/05/2014 04/05/2012 MY48360364
Anritsu MT8820C 08/03/2014 08/03/2012 6201176199
Aprel Dielectric Probe Assembly N/A N/A 0011
Head Equivalent Matter (835/900 MHz) N/A N/A N/A
12.
Conclusion
The SAR measurement indicates that the EUT complies with the RF radiation exposure limits of the FCC. These measurements are taken to simulate the RF effects exposure under worst-case conditions. Precise laboratory measures were taken to assure repeatability of the tests. The tested device complies with the requirements in respect to all parameters subject to the test. The test results and statements relate only to the item(s) tested.
Please note that the absorption and distribution of electromagnetic energy in the body is a very complex phenomena that depends on the mass, shape, and size of the body; the orientation of the body with respect to the field vectors; and, the electrical properties of both the body and the environment. Other variables that may play a substantial role in possible biological effects are those that characterize the environment (e.g. ambient temperature, air velocity, relative humidity, and body insulation) and those that characterize the individual (e.g. age, gender, activity level, debilitation, or disease). Because innumerable factors may interact to determine the specific biological outcome of an exposure to electromagnetic fields, any protection guide shall consider maximal amplification of biological effects as a result of field-body interactions, environmental conditions, and physiological variables.
13.
References
[1] Federal Communications Commission, ET Docket 93-62, Guidelines for
Evaluating the Environmental Effects of Radio Frequency Radiation, August 1996
[2] ANSI/IEEE C95.1 – 1992, American National Standard Safety Levels with
respect to Human Exposure to Radio Frequency Electromagnetic Fields, 300kHz to 100GHz, New York: IEEE, 1992.
[3] ANSI/IEEE C95.3 – 1992, IEEE Recommended Practice for the Measurement of
Potentially Hazardous Electromagnetic Fields – RF and Microwave, New York: IEEE, 1992.
[4] Federal Communications Commission, OET Bulletin 65 (Edition 97-01),
Supplement C (Edition 01-01), Evaluating Compliance with FCC Guidelines for Human Exposure to Radio Frequency Electromagnetic Fields, June 2001.
[5] IEEE Standard 1528 – 2003, IEEE Recommended Practice for Determining the
Peak-Spatial Average Specific Absorption Rate (SAR) in the Human Head from Wireless Communication Devices: Measurement Techniques, October 2003.
[6] Industry Canada, RSS – 102e, Radio Frequency Exposure Compliance of
Radiocommunication Apparatus (All Frequency Bands), March 2010.
[7] Health Canada, Safety Code 6, Limits of Human Exposure to Radiofrequency
Appendix A – System Validation Plots and Data
************************************************************ Test Result for UIM Dielectric Parameter
Tue 05/Feb/2013 07:09:34 Freq Frequency(GHz)
FCC_eH FCC OET 65 Supplement C (June 2001) Limits for Head Epsilon FCC_sH FCC OET 65 Supplement C (June 2001) Limits for Head Sigma Test_e Epsilon of UIM
Test_s Sigma of UIM
************************************************************
Freq FCC_eH FCC_sH Test_e Test_s
0.8000 41.68 0.90 41.51 0.91 0.8100 41.63 0.90 41.46 0.92 0.8200 41.58 0.90 41.40 0.92 0.8300 41.53 0.90 41.35 0.93 0.8350 41.515 0.905 41.33 0.935* 0.8400 41.50 0.91 41.31 0.94 0.8500 41.50 0.92 41.28 0.95 0.8600 41.50 0.93 41.25 0.96 0.8700 41.50 0.94 41.23 0.98 * value interpolated ************************************************************ Test Result for UIM Dielectric Parameter
Wed 06/Feb/2013 07:18:38 Freq Frequency(GHz)
FCC_eH FCC Bulletin 65 Supplement C ( June 2001) Limits for Head Epsilon FCC_sH FCC Bulletin 65 Supplement C (June 2001) Limits for Head Sigma FCC_eB FCC Limits for Body Epsilon
FCC_sB FCC Limits for Body Sigma Test_e Epsilon of UIM
Test_s Sigma of UIM
************************************************************
Freq FCC_eB FCC_sB Test_e Test_s
0.8050 55.32 0.97 56.05 0.96 0.8150 55.28 0.97 56.00 0.98 0.8250 55.24 0.97 55.95 0.98 0.8350 55.20 0.97 55.91 0.99 0.8450 55.17 0.98 55.86 0.99 0.8550 55.14 0.99 55.84 1.00 0.8650 55.11 1.01 55.80 1.01 0.8750 55.08 1.02 55.78 1.03 0.8850 55.05 1.03 55.73 1.03 0.8950 55.02 1.04 55.70 1.04
RF Exposure Lab
DUT: Dipole 835 MHz D835V2; Type: D835V2; Serial: D835V2 - SN:4d089
Communication System: CW; Frequency: 835 MHz; Duty Cycle: 1:1
Medium: HSL835; Medium parameters used (interpolated): f = 835 MHz; σ = 0.935 mho/m; εr = 41.33; ρ = 1000 kg/m3
Phantom section: Flat Section
Test Date: Date: 2/5/2013; Ambient Temp: 23 °C; Tissue Temp: 21 °C
Probe: EX3DV4 - SN3693; ConvF(8.55, 8.55, 8.55); Calibrated: 8/20/2012;
Sensor-Surface: 4mm (Mechanical Surface Detection), Sensor-Surface: 1.4mm (Mechanical Surface Detection) Electronics: DAE4 Sn759; Calibrated: 8/15/2012
Phantom: SAM with CRP; Type: SAM; Serial: TP - 1416
Measurement SW: DASY52, Version 52.8 (2); SEMCAD X Version 14.6.6 (6824)
Procedure Notes:
835 MHz Verification/Head/Area Scan (61x101x1): Interpolated grid: dx=1.500 mm, dy=1.500 mm
Info: Interpolated medium parameters used for SAR evaluation.
Maximum value of SAR (interpolated) = 0.989 W/kg
835 MHz Verification/Head/Zoom Scan (5x5x7)/Cube 0: Measurement grid: dx=8mm, dy=8mm, dz=5mm Reference Value = 55.421 V/m; Power Drift = -0.02 dB
Peak SAR (extrapolated) = 1.449 mW/g
SAR(1 g) = 0.936 mW/g; SAR(10 g) = 0.612 mW/g
Info: Interpolated medium parameters used for SAR evaluation.
Maximum value of SAR (measured) = 1.29 W/kg
RF Exposure Lab
DUT: Dipole 835 MHz D835V2; Type: D835V2; Serial: D835V2 - SN:4d089
Communication System: CW; Frequency: 835 MHz; Duty Cycle: 1:1
Medium: MSL835; Medium parameters used: f = 835 MHz; σ = 0.99 mho/m; εr= 55.91; ρ = 1000 kg/m3
Phantom section: Flat Section
Test Date: Date: 2/6/2013; Ambient Temp: 23 °C; Tissue Temp: 21 °C
Probe: EX3DV4 - SN3693; ConvF(8.87, 8.87, 8.87); Calibrated: 8/20/2012; Sensor-Surface: 4mm (Mechanical Surface Detection)
Electronics: DAE4 Sn759; Calibrated: 8/15/2012 Phantom: ELI 4.0; Type: QDOVA001BA; Serial: 1065
Measurement SW: DASY52, Version 52.8 (2); SEMCAD X Version 14.6.6 (6824)
Procedure Notes:
835 MHz Validation/835 MHz Validation/Area Scan (41x81x1): Interpolated grid: dx=1.500 mm, dy=1.500 mm
Maximum value of SAR (interpolated) = 1.06 W/kg
835 MHz Validation/835 MHz Validation/Zoom Scan (5x5x7)/Cube 0: Measurement grid: dx=8mm, dy=8mm, dz=5mm
Reference Value = 32.801 V/m; Power Drift = -0.02 dB Peak SAR (extrapolated) = 1.460 mW/g
SAR(1 g) = 0.987 mW/g; SAR(10 g) = 0.650 mW/g
Maximum value of SAR (measured) = 1.06 W/kg
RF Exposure Lab
DUT: Apple iPad; Type: Tablet; Serial:
Not Specified
Communication System: CDMA2000 (1xRTT); Frequency: 836.52 MHz; Duty Cycle: 1:1
Medium: MSL835; Medium parameters used (interpolated): f = 836.52 MHz; σ = 0.99 S/m; εr = 55.902; ρ = 1000 kg/m3
Phantom section: Flat Section
Test Date: Date: 2/6/2013; Ambient Temp: 23 °C; Tissue Temp: 21 °C
Probe: EX3DV4 - SN3693; ConvF(8.87, 8.87, 8.87); Calibrated: 8/20/2012; Sensor-Surface: 4mm (Mechanical Surface Detection)
Electronics: DAE4 Sn759; Calibrated: 8/15/2012 Phantom: ELI 4.0; Type: QDOVA001BA; Serial: 1065
Measurement SW: DASY52, Version 52.8 (4); SEMCAD X Version 14.6.8 (7028)
Procedure Notes:
Back CDMA Baseline Mid/Area Scan (151x61x1): Interpolated grid: dx=1.000 mm, dy=1.000 mm
Info: Interpolated medium parameters used for SAR evaluation.
Maximum value of SAR (interpolated) = 1.26 W/kg
Back CDMA Baseline Mid/Zoom Scan (5x5x7)/Cube 0: Measurement grid: dx=8mm, dy=8mm, dz=5mm Reference Value = 19.580 V/m; Power Drift = -0.24 dB
Peak SAR (extrapolated) = 2.17 W/kg
SAR(1 g) = 1.15 W/kg; SAR(10 g) = 0.641 W/kg
Info: Interpolated medium parameters used for SAR evaluation.
Maximum value of SAR (measured) = 1.28 W/kg
RF Exposure Lab
DUT: Apple iPad; Type: Tablet; Serial:
Not Specified
Communication System: CDMA2000 (1xRTT); Frequency: 836.52 MHz; Duty Cycle: 1:1
Medium: MSL835; Medium parameters used (interpolated): f = 836.52 MHz; σ = 0.99 S/m; εr = 55.902; ρ = 1000 kg/m 3
Phantom section: Flat Section
Test Date: Date: 2/6/2013; Ambient Temp: 23 °C; Tissue Temp: 21 °C
Probe: EX3DV4 - SN3693; ConvF(8.87, 8.87, 8.87); Calibrated: 8/20/2012; Sensor-Surface: 4mm (Mechanical Surface Detection)
Electronics: DAE4 Sn759; Calibrated: 8/15/2012 Phantom: ELI 4.0; Type: QDOVA001BA; Serial: 1065
Measurement SW: DASY52, Version 52.8 (4); SEMCAD X Version 14.6.8 (7028)
Procedure Notes:
Back CDMA Bodywell Std Mid/Area Scan (151x61x1): Interpolated grid: dx=1.000 mm, dy=1.000 mm
Info: Interpolated medium parameters used for SAR evaluation.
Maximum value of SAR (interpolated) = 0.827 W/kg
Back CDMA Bodywell Std Mid/Zoom Scan (5x5x7)/Cube 0: Measurement grid: dx=8mm, dy=8mm, dz=5mm Reference Value = 14.532 V/m; Power Drift = 0.16 dB
Peak SAR (extrapolated) = 1.39 W/kg
SAR(1 g) = 0.750 W/kg; SAR(10 g) = 0.425 W/kg
Info: Interpolated medium parameters used for SAR evaluation.
Maximum value of SAR (measured) = 0.832 W/kg
I
Zeughausstrasse 43, 8004 Zurich, Switzerland
Accredited by the Swiss Accreditation Service (SAS)
The Swiss Accreditation Service is one of the signatories to the EA Multilateral Agreement for the recognition of calibration certificates Client RF Exposure Lab
Swiss Calibration Service
Accreditation No.: SCS 108
Certificate No: EX3·3693_Aug 12
CALIBRATION CERTIFICATE
Object EX3DV4 - SI\J:3693
Calibration procedure(s) QA CAL-01.v8, QA CAL-14.v3, QA CAL-23.v4, QA CAL-25.v4 Calibration procedure for dosimetric E-field probes
Calibration date: August 20, 2012
This calibration certificate documents the traceability to national standards, which realize the physical units of measurements (SI). The measurements and the uncertainties with confidence probability are given on the following pages and are part of the certificate.
All calibrations have been conducted in the closed laboratory facility: environment temperature (22 ± 3)"C and humidity < 70%.
Calibration Equipment used (M&TE critical for calibration)
Primary Standards 10 Cal Date (Certificate No.) Scheduled Calibration
Power meter E4419B GB41293874 29-Mar-12 (No. 217-01508) Apr-13
PowersensorE4412A MY41498087 29-Mar-12 (No. 217-01508) Apr-13
Reference 3 dB Attenuator SN: S5054 (3c) 27-Mar-12 (No. 217-01531) Apr-13 Reference 20 dB Attenuator SN: S5086 (20b) 27-Mar-12 (No. 217-01529) Apr-13 Reference 30 dB Attenuator SN: S5129 (30b) 27-Mar-12 (No. 217-01532) Apr-13 Reference Probe ES3DV2 SN:3013 29-Dec-11 (No. ES3-3013 Dec 11) Dec-12
DAE4 SN: 660 20-Jun-12 (No. DAE4-660 Jun12) Jun-13
Secondary Standards 10 Check Date (in house) Scheduled Check
RF generator HP 8648C US3642U01700 4-Aug-99 (in house check Apr-11) In house check: Apr-13 Network Analyzer HP 8753E US37390585 18-0ct-01 (in house check Oct-11) In house check: Oct-12
Name Function Signatjre ; / /
Calibrated by: Jeton Kastrati
labornto'Y T"ho'''"
c~~~
Approved by: Katja Pokovic T"ho<.IMam,,,'"
~ ~
_Issued: August 20, 2012 This calibration certificate shall not be reproduced except in full without written approval of the laboratory.
Schmid & Partner Service suisse d'etalonnage
C
Servizio svizzero di taratura
Engineering AG
S
Zeughausstrasse 43, 8004 Zurich, Switzerland Swiss Calibration Service
Accredited by the Swiss Accreditation Service (SAS) Accreditation No.: SCS 108 . The Swiss Accreditation Service is one of the signatories to the EA
Multilateral Agreement for the recognition of calibration certificates
Glossary:
TSL tissue simulating liquid
NORMx,y,z sensitivity in free space
ConvF sensitivity in TSL / NORMx,y,z
DCP diode compression point
CF crest factor (1/duty-cycle) of the RF signal
A,B,C modulation dependent linearization parameters
Polarization cp cp rotation around probe axis
Polarization & & rotation around an axis that is in the plane normal to probe axis (at measurement center),
i.e., &
=
0 is normal to probe axisCalibration is Performed According to the Following Standards:
a) IEEE Std 1528-2003, "IEEE Recommended Practice for Determining the Peak Spatial-Averaged Specific Absorption Rate (SAR) in the Human Head from Wireless Communications Devices: Measurement Techniques", December 2003
b) IEC 62209-1, "Procedure to measure the Specific Absorption Rate (SAR) for hand-held devices used in close proximity to the ear (frequency range of 300 IVIHz to 3 GHz)", February 2005
Methods Applied and Interpretation of Parameters:
• NORMx,y,z: Assessed for E-field polarization &
=
0 (f::;; 900 MHz in TEM-cell; f> 1800 MHz: R22 waveguide).NORMx,y,z are only intermediate values, i.e., the uncertainties of NORMx,y,z does not affect the E2-field
uncertainty inside TSL (see below ConvF).
• NORM(f)x,y,z
=
NORMx,y,z * frequencYJesponse (see Frequency Response Chart). This linearization isimplemented in DASY4 software versions later than 4.2. The uncertainty of the frequency response is included in the stated uncertainty of ConvF.
• DCPx,y,z: DCP are numerical linearization parameters assessed based on the data of power sweep with CW
signal (no uncertainty required). DCP does not depend on frequency nor media.
• PAR: PAR is the Peak to Average Ratio that is not calibrated but determined based on the signal
characteristics
• Ax,y,z; Bx,y,z; Cx,y,z, VRx,y,z: A, B, C are numerical linearization parameters assessed based on the data of
power sweep for specific modulation signal. The parameters do not depend on frequency nor media. VR is the maximum calibration range expressed in RMS voltage across the diode.
• ConvF and Boundary Effect Parameters: Assessed in flat phantom using E-field (or Temperature Transfer
Standard for f ::;; 800 MHz) and inside waveguide using analytical field distributions based on power measurements for f > 800 MHz. The same setups are used for assessment of the parameters applied for boundary compensation (alpha, depth) of which typical uncertainty values are given. These parameters are used in DASY4 software to improve probe accuracy close to the boundary. The sensitivity in TSL corresponds to NORMx,y,z * ConvF whereby the uncertainty corresponds to that given for ConvF. A frequency dependent
ConvF is used in DASY version 4.4 and higher which allows extending the validity from ± 50 MHz to ± 100
MHz.
• Spherical isotropy (3D deviation from isotropy): in a field of low gradients realized using a flat phantom
exposed by a patch antenna.
• Sensor Offset: The sensor offset corresponds to the offset of virtual measurement center from the probe tip
(on probe axis). No tolerance required.
Probe
EX3DV4
SN:3693
Manufactured:
Apri I 22, 2009
Calibrated:
August 20, 2012
Calibrated for DASY/EASY Systems
DASY/EASY - Parameters of Probe: EX3DV4 - SN:3693
Basic Calibration ParametersSensorX SensorY SensorZ Unc (k=2)
Norm (',lV/(V/m)2)A 0.49 0.48 0.46 ± 10.1 %
DCP (mV)" 98.3 100.5 98.2
Modulation Calibration Parameters
UID Communication System Name PAR A
dB B dB C dB VR mV Unc" (k=2) 0 CW 0.00 X 0.00 0.00 1.00 161.4 ±3.0 % Y 0.00 0.00 1.00 154.4 Z 0.00 0.00 1.00 158.9
The reported uncertainty of measurement is stated as the standard uncertainty of measurement multiplied by the coverage factor k=2, which for a normal distribution corresponds to a coverage
probability of approximately 95%.
A The uncertainties of NormX,Y,Z do not affect the E2-field uncertainty inside TSL (see Pages 5 and 6). B Numerical linearization parameter: uncertainty not required.
E Uncertainty is determined using the max. deviation from linear response applying rectangular distribution and is expressed for the square of the
field value.
DASY/EASY - Parameters of Probe: EX3DV4 - SN:3693
Calibration Parameter Determined in Head Tissue Simulating Mediaf (MHz) c
Relative Permittivity F
Conductivity
(81m) F ConvFX ConvF Y ConvF Z Alpha
Depth (mm) Unct. (k=2) 750 41.9 0.89 8.99 8.99 8.99 0.23 1.20 ± 12.0 % 835 41.5 0.90 8.55 8.55 8.55 0.18 1.56 ± 12.0 % 1750 40.1 1.37 8.00 8.00 8.00 0.51 0.76 ± 12.0 % 1900 40.0 1.40 7.67 7.67 7.67 0.75 0.63 ± 12.0 % 2450 39.2 1.80 6.72 6.72 6.72 0.29 1.09 ± 12.0 % 2550 39.1 1.91 6.55 6.55 6.55 0.39 0.93 ± 12.0 % 5200 36.0 4.66 4.97 4.97 4.97 0.30 1.80 ± 13.1 % I 5300 35.9 4.76 4.78 4.78 4.78 0.30 1.80 ± 13.1 % 5600 35.5 5.07 4.22 4.22 4.22 0.40 1.80 ± 13.1 % 5800 35.3 5.27 4.34 4.34 4.34 0.40 1.80 ± 13.1 %
C Frequency validity of ± 100 MHz only applies for DASY v4.4 and higher (see Page 2), else it is restricted to ± 50 MHz. The uncertainty is the RSS
of the ConvF uncertainty at calibration frequency and the uncertainty for the indicated frequency band.
FAt frequencies below 3 GHz, the validity of tissue parameters (E and IT) can be relaxed to ± 10% if liquid compensation formula is applied to measured SAR values. At frequencies above 3 GHz, the validity of tissue parameters (E and cr) is restricted to ± 5%. The uncertainty is the RSS of the ConvF uncertainty for indicated target tissue parameters.
DASY/EASY - Parameters of Probe: EX3DV4 - SN:3693
Calibration Parameter Determined in Body Tissue Simulating Mediaf (MHz) c
Relative Permittivity F
Conductivity
(81m) F ConvF X ConvF Y ConvF Z Alpha
Depth (mm) Unct. (k=2) 750 55.5 0.96 8.84 8.84 8.84 0.29 1.09 ± 12.0 % 835 55.2 0.97 8.87 8.87 8.87 0.60 0.71 ± 12.0 % 1750 53.4 1.49 7.43 7.43 7.43 0.41 0.85 ± 12.0 % 1900 53.3 1.52 7.13 7.13 7.13 0.41 0.82 ± 12.0 % 2450 52.7 1.95 6.76 6.76 6.76 0.80 0.50 ± 12.0 % I 2550 52.6 2.09 6.75 6.75 6.75 0.80 0.50 ± 12.0 % 5200 49.0 5.30 4.31 4.31 4.31 0.45 1.90 ± 13.1 % 5300 48.9 5.42 4.24 4.24 4.24 0.40 1.90 ± 13.1 % 5600 48.5 5.77 3.76 3.76 3.76 0.45 1.90 ± 13.1 % 5800 48.2 6.00 4.08 4.08 4.08 0.50 1.90 ± 13.1 %
C Frequency validity of ± 100 MHz only applies for DASY v4.4 and higher (see Page 2), else it is restricted to ± 50 MHz. The uncertainty is the RSS
of the ConvF uncertainty at calibration frequency and the uncertainty for the indicated frequency band.
FAt frequencies below 3 GHz, the validity of tissue parameters (0 and IT) can be relaxed to ± 10% if liquid compensation formula is applied to measured SAR values. At frequencies above 3 GHz, the validity of tissue parameters (8 and IT) is restricted to ± 5%. The uncertainty is the RSS of the ConvF uncertainty for indicated target tissue parameters.
(TEM-Cell:ifi110 EXX, Waveguide: R22) 1.5---r---,---,---,---,---, , , 1.4 , [ -.--.--- - ; - - , . ~ 1.3-:····-···r···-···+··· - - : -.- [
-.-.--···1···-···1···
Q) I I I I I .~ : : : : : ~ 1.2- - - -.- ..j···1..---.. -- -.-.--- [... ,
-."j'-..-
S 1.1 '---;--- --- . ----·1---·---· i··---·--·---~--- ---.:---. ----+-- _:c~
1.0~---
-- ---. -- --..- -. ---. ---. --J---
__ .:,--,.,~,.,.,
...'. ... - ...J... ._
;
o . -.... -- .. ,---.-.--.:~---.~---0..i=
! ! ! ! I (/) f- I I : I , I ~ 0.9 ~ -- --.-- -- -- .. -.~ --- --- ----T'-- ----.----.. -.
--.--.j -- ----.-- -- -- -.[.--.-.. -- --
+----'---
'--1-
C I : I I ~ 0_8 - ------·---f ---. -- --.---- --
--.1---- -- ----.----. ----.-j - --- ---- ---. ----i--- ---.
+--..-.---.---.;. ----.
u , . ~ ..
LL 0_7 - -- -.__ ._ _. __ l.. ----.-- --.--- .._.L.
__ __ .: .. _. __
__. ._ .__
l__ __.. ._ .---.~-.-- ---- -- . ~._. __ . I- I I I 0_6-· I ' I ' I I , , I , , , I I I I I I : " ' , I I , I : ,05_ +--'---'---L..-.L----j-r---'---'---'---'----r-I~~---'---'--+-,L...C----L-...J...._-i----"I---'---L---L.-r---"----L-...J....~-Ir---'--"
o
500 1000 1500 2000 2500 3000f [MHz]
'.=J
TEM
=
R22Receiving Pattern
(<j)),
3
=
0
0f=600 MHz,TEM
f= 1800 MHz, R22
90 9C 135 45 135 45.
..
.
'.
~ "18C :~ 0·2 04 06 08 ~, 02 04 06 08 ... ~." ." 225 315 225 315 :270•
y•
•
y•
Tot x z Tot x z 0,5en
~E
00w
- ,O.=:; , , , , , , , , ,. ___ . " I1 • , ~__ . ~ . J ~ •L. ~_. , J • .~8_ _ ' . ' J. ~.M ' J ~__ I , , , , I I , , , , , , , , , " " , ,-
~~~i=--=---.-_- -, -- -, --
,-~--..;=-.~;.~~c_si..::~.:.:..-;~=-~=Pv:T---.--"':"c~-~r->~: : ----
:
--oz---.s--._'_-=--.:.:.
c-,?--;,,;-~_---"'-"o::~,, , , , , , , , , , , , , , , , I , I • I , • ... L ~ I , , - - - ' - - - --- ---:--- !---'---j---r--- ---- , , : I : -150 rIJ 100 MHz -Ibo -50 [!J 600 MHz 0 Rolin 5 1 0 ---.J 1800 MHz 160 1~0 ---.J 2500 MHz
Uncertainty of Axial Isotropy Assessment: ± 0.5% (k=2)
Dynamic Range f(SAR
head) (TEM cell, f=
900 MHz) ... ::::l D. C ---. . :/ ,nC j ' ' u • " : , ,0"',:)' : 104 : : .. .... / . e .. : . :'/
.. ' 10" . . / ._ .. : :/ /
: , .. 103 SAR [mW/cm3].=J
leinot compensated com pensated
..., ~ 1 .... . , • •• , , : • '. .
,.
: . ,. ': ,.'.
~, -. '... .... ' .",
, ,!
• • .. ' :' . : ,"
, ! i ,g
w 1 : : SAR [mW/cm3] ~ce-'I
not compensated compensated
Conversion Factor Assessment
f=
835 MHz,WGLS R9 (H_convF) f:: 1900 MHz,WGLS R22 (H_convF) 30 1 S " 0 0.5· 00· o 10 20 30 40 50 t3D 10 15 :;:'0 25 30 35 40 z [rTlm! i::[mml S;' i .-'cJ _".-1 anal;1i~31 rn::asure-d ana~'ilCalDeviation from Isotropy in Liquid
Error (cP, ,9.), f
=
900 MHz 1.0 0.8 0.6 c 0.4 o ~ 0.2 ~ 0.0 0-0.2 -0.4 -0.6 -0.8 -1.0 o 45 90 135 .f-/Q;( 180 $.9/ 225 270 315 60o
-1.0 -0.8 -0.6 -0.4 -0.2 0.0 0.2 0.4 0.6 0.8 1.0Uncertainty of Spherical Isotropy Assessment: ± 2.6% (k=2)
DASY/EASY - Parameters of Probe: EX3DV4 - SN:3693
Other Probe Parameters
Sensor Arrangement Triangular
Connector Angle
n
155.3Mechanical Surface Detection Mode enabled
Optical Surface Detection Mode disabled
Probe Overall Length 337 mm
Probe Body Diameter 10 mm
Tip Length 9mm
Tip Diameter 2.5mm
Probe Tip to Sensor X Calibration Point 1 mm
Probe Tip to Sensor Y Calibration Point 1 mm
Probe Tip to Sensor Z Calibration Point 1 mm
I
Zeughausstrasse 43, 8004 Zurich, Switzerland
Accredited by the Swiss Accreditation Service (SAS)
The Swiss Accreditation Service is one of the signatories to the EA Multilateral Agreement for the recognition of calibration certificates
Client RF Exposure Lab
S
Swiss Calibration ServiceAccreditation No.: SCS 108
Certificate No: D835V2-4d089_Dec12
ICALIBRATION CERTIFICATE
Object D835V2 - SN: 4d089
Calibration procedure(s) QA CAL-05.v8
Calibration procedure for dipole validation kits above 700 MHz
Calibration date: December 03, 2012
This calibration certificate documents the traceability to national standards, which realize the physical units of measurements (SI). The measurements and the uncertainties with confidence probability are given on the following pages and are part of the certificate.
All calibrations have been conducted in the closed laboratory facility: environment temperature (22 ± 3rC and humidity < 70%. Calibration Equipment used (M&TE critical for calibration)
Primary Standards Power meter EPM-442A Power sensor HP 8481A Reference 20 dB Attenuator Type-N mismatch combination Reference Probe ES3DV3 DAE4
Secondary Standards Power sensor HP 8481A RF generator R&S SMT-06 Network Analyzer HP 8753E
Calibrated by:
Approved by:
ID# Cal Date (Certificate No.) Scheduled Calibration
GB37480704 01-Nov-12 (No. 217-01640) Oct-13
US37292783 01-Nov-12 (No. 217-01640) Oct-13
SN: 5058 (20k) 27-Mar-12 (No. 217-01530) Apr-13
SN: 5047.3/06327 27-Mar-12 (No. 217-01533) Apr-13
SN: 3205 30-Dec-11 (No. ES3-3205_Dec11) Dec-12
SN: 601 27-Jun-12 (No. DAE4-601_Jun12) Jun-13
ID# Check Date (in house) Scheduled Check
MY41092317 18-0ct-02 (in house check Oct-11) In house check: Oct-13
100005 04-Aug-99 (in house check Oct-11) In house check: Oct-13
US37390585 S4206 18-0ct-01 (in house check Oct-12) In house check: Oct-13
Name Function
Israe EI-Naouq Laboratory Technician
Katja Pokovic Technical Manager
Schmid & Partner Service suisse d'etalonnage
Engineering AG
C
Servizio svizzero di taraturaZeughausstrasse 43, 8004 Zurich, Switzerland
S
Swiss Calibration ServiceAccredited by the Swiss Accreditation Service (SAS) Accreditation No.: SCS 108
The Swiss Accreditation Service is one of the signatories to the EA Multilateral Agreement for the recognition of calibration certificates
Glossary:
TSL tissue simulating liquid
ConvF sensitivity in TSL
1
NORM x,y,zNIA not applicable or not measured
Calibration is Performed According to the Following Standards:
a) IEEE Std 1528-2003, "IEEE Recommended Practice for Determining the Peak Spatial Averaged Specific Absorption Rate (SAR) in the Human Head from Wireless
Communications Devices: Measurement Techniques", December 2003
b) IEC 62209-1, "Procedure to measure the Specific Absorption Rate (SAR) for hand-held devices used in close proximity to the ear (frequency range of 300 MHz to 3 GHz)", February 2005
c) Federal Communications Commission Office of Engineering & Technology (FCC OET), "Evaluating Compliance with FCC Guidelines for Human Exposure to Radiofrequency Electromagnetic Fields; Additional Information for Evaluating Compliance of Mobile and Portable Devices with FCC Limits for Human Exposure to Radiofrequency Emissions", Supplement C (Edition 01-01) to Bulletin 65
Additional Documentation:
d) DASY
4/5
System HandbookMethods Applied and Interpretation of Parameters:
• Measurement Conditions: Further details are available from the Validation Report at the end of the certificate. All figures stated in the certificate are valid at the frequency indicated.
• Antenna Parameters with TSL: The dipole is mounted with the spacer to position its feed point exactly below the center marking of the nat phantom section, with the arms oriented parallel to the body axis.
• Feed Point Impedance and Return Loss: These parameters are measured with the dipole positioned under the liquid filled phantom. The impedance stated is transformed 'from the measurement at the SMA connector to the feed point. The Return Loss ensures low reflected power. No uncertainty required.
• Electrical Delay: One-way delay between the SMA connector and the antenna feed point. No uncertainty required.
• SAR measured: SAR measured at the stated antenna input power.
• SAR normalized: SAR as measured, normalized to an input power of 1 W at the antenna connector.
• SAR for nominal TSL parameters: The measured TSL parameters are used to calculate the nominal SAR result.
The reported uncertainty of measurement is stated as the standard uncertainty of measurement multiplied by the coverage factor k=2, which for a normal distribution corresponds to a coverage probability of approximately 95%.
Extrapolation Advanced Extrapolation
Phantom Modular Flat Phantom
Distance Dipole Center - TSl 15 mm with Spacer
Zoom Scan Resolution dx, dy, dz = 5 mm
Frequency 835 MHz ± 1 MHz
Head TSL parameters
The following parameters and calculations were applied.
Temperature Permittivity Conductivity
Nominal Head TSl parameters 22.0 DC 41.5 0.90 mho/m
Measured Head TSl parameters (22.0 ± 0.2) DC 41.4±6% 0.92 mho/m ± 6 %
Head TSl temperature change during test < 0.5 DC ---~ ---
SAR result with Head TSL
SAR averaged over 1 cm 3 (1 g) of Head TSl Condition
SAR measured 250 mW input power 2.38 W/kg
SAR for nominal Head TSL parameters normalized to 1W 9.36 W/kg ± 17.0 % (k=2)
SAR averaged over 10 cm 3 (10 g) of Head TSl condition
SAR measured 250 mW input power 1.55 W/kg
SAR for nominal Head TSL parameters normalized to 1W 6.12 W/kg ± 16.5 % (k=2)
Body TSL parameters
The following parameters and calculations were applied
Temperature Permittivity Conductivity
Nominal Body TSl parameters 22.0 DC 55.2 0.97 mho/m
Measured Body TSl parameters (22.0 ± 0.2) DC 54.5 ±6 % 0.99 mho/m ± 6 %
Body TSl temperature change during test < 0.5 DC ---
---
SAR result with Body TSL
SAR averaged over 1 cm 3 (1 g) of Body TSl Condition
SAR measured 250 mW input power 2.42 W/kg
SAR for nominal Body TSL parameters normalized to 1W 9.51 W/kg ± 17.0 % (k=2)
SAR averaged over 10 cm3 (10 g) of Body TSl condition
SAR measured 250 mW input power 1.59 W/kg
Antenna Parameters with Head TSL
Impedance, transformed to feed point 51.7Q -2.5jQ
Return Loss - 30.5 dB
Antenna Parameters with Body TSL
Impedance, transformed to feed point 47.4Q -4.8jQ
Return Loss - 25.0 dB
General Antenna Parameters and Design
Electrical Delay (one direction) 1.391 ns
After long term use with 100W radiated power, only a slight warming of the dipole near the feed point can be measured. The dipole is made of standard semirigid coaxial cable. The center conductor of the feeding line is directly connected to the second arm of the dipole. The antenna is therefore short-circuited for DC-signals. On some of the dipoles, small end caps are added to the dipole arms in order to improve matching when loaded according to the position as explained in the "Measurement Conditions" paragraph. The SAR data are not affected by this change. The overall dipole length is still according to the Standard.
No excessive force must be applied to the dipole arms, because they might bend or the soldered connections near the feedpoint may be damaged.
Additional EUT Data
SPEAG Manufactured by
October 17, 2008 Manufactured on
Test Laboratory: SPEAG, Zurich, Switzerland
DDT: Dipole 835 MHz; Type: D835V2; Serial: D835V2 - SN: 4d089 Communication System: CW; Frequency: 835 MHz
Medium parameters used: f = 835 MHz; (J = 0.92 mho/m; Er = 41.4; P = 1000 kg/m3
Phantom section: Flat Section
Measurement Standard: DASY5 (IEEE/IEC/ANSI C63.19-2007) DASY52 Configuration:
• Probe: ES3DV3 - SN3205; ConvF(6.07, 6.07, 6.07); Calibrated: 30.12.2011;
• Sensor-Surface: 3mm (Mechanical Surface Detection)
• Electronics: DAE4 Sn601; Calibrated: 27.06.2012
• Phantom: Flat Phantom 4.9L; Type: QDOOOP49AA; Serial: 1001
• DASY52 52.8.3(988); SEMCAD X 14.6.7(6848)
Dipole Calibration for Head TissueIPin=250 mW, d=15mmlZoom Scan (7x7x7)/Cube 0:
Measurement grid: dx=5mm, dy=5mm, dz=5mm Reference Value = 56.782 Vim; Power Drift = -0.01 dB Peak SAR (extrapolated) = 3.58 W/kg
SAR(l g)
=
2.38 Wlkg; SAR(lO g)=
1.55 WlkgMaximum value of SAR (measured) = 2.79 W/kg
dB o -2.40 -4.80 -7.20 -9.60 -12.00
o
dB = 2.79 W/kg = 4.46 dBW/kg3 Dec 2012 14:31:39 1 U FS 1: 51.703,~ -2.49E.1~' 75.351 pF 835.000000 t'lHz De 1
....---..
r ,""'"
\ ..\ ..-....:._----/. Hld CH2 S).l LOG f 5 dB/R~F -2091:: COt' AV9 15 . 4· ,•. Hld START 535.000 000 .. ~lHz STOP 1 100.000 000 ~lHzTest Laboratory: SPEAG, Zurich, Switzerland
DDT: Dipole 835 MHz; Type: D835V2; Serial: D835V2 - SN: 4d089 Communication System: CW; Frequency: 835 MHz
Medium parameters used: f = 835 MHz; (J = 0.99 mho/m; Sf = 54.5; P= 1000 kg/m3
Phantom section: Flat Section
Measurement Standard: DASY5 (IEEE/IEC/ANSI C63.l9-2007) DASY52 Configuration:
• Probe: ES3DV3 - SN3205; ConvF(6.02, 6.02, 6.02); Calibrated: 30.12.2011;
• Sensor-Surface: 3mm (Mechanical Surface Detection)
• Electronics: DAE4 Sn60l; Calibrated: 27.06.2012
• Phantom: Flat Phantom 4.9L; Type: QDOOOP49AA; Serial: 1001
• DASY52 52.8.3(988); SEMCAD X 14.6.7(6848)
Dipole Calibration for Body TissuelPin=250 mW, d=15mmlZoom Scan (7x7x7)/Cube 0:
Measurement grid: dx=5mm, dy=5mm, dz=5mm Reference Value = 55.384 VIm; Power Drift = -0.01 dB Peak SAR (extrapolated) = 3.54 W/kg
SAR(l g)
=
2.42 W/kg; SAR(lO g)=
1.59 W/kgMaximum value of SAR (measured) = 2.82 W/kg
dB o -2.40 -4.80 -7.20 -9.60 -12.00
o
dB = 2.82 W/kg = 4.50 dBWlkg3 Dec 2012 10:26:14 1 U FS 1: 47.379~' -4.8359 (l 39.414 pF 835.000000 t'lHz De I HId CH2 S:1.1 Cor-HId
:3TART E,35.000 000 t1Hz STOP 1100.000 ~)00t1Hz
Zeughausstrasse 43, 8004 Zurich, Switzerland Phone +41 44 245 9700, Fax +41 44 245 9779 [email protected], httpJ/www.speag.com
Certificate of Conformity I First Article Inspection
Item Oval Flat Phantom ELI 4.0
Type No QD OVA 001 B
Series No 1003 and higher
Manufacturer Untersee Composites
Knebelstrasse 8
CH-8268 Mannenbach, Switzerland Tests
Complete tests were made on the prototype units QD OVA 001 AA 1001, QD OVA 001 AB 1002,
pre-series units QD OVA 001 BA 1003-1005 as well as on the series units QD OVA 001 BB, 1006 ft.
Test Requirement Details Units tested
Material thickness
Compliant with the standard requirements Bottom plate: 2.0mm +/- 0.2mm all Material parameters
Dielectric parameters for required freauencies < 6 GHz: ReI. permittivity
=
4 +/-1, Loss tangent s 0.05 Material sample Material resistivityThe material has been tested to be compatible with the liquids defined in the standards if handled and cleaned according to the instructions.
DGBE based simUlating liquids.
Observe Technical Note for material compatibilitv.
Equivalent phantoms, Material sample
Shape Thickness of bottom material,
Internal dimensions, Sagging
compatible with standards from minimum frequency
Bottom elliptical 600 x 400 mm Depth 190 mm,
Shape is within tolerance for filling height up to 155 mm, Eventual sagging is reduced or eliminated by support via DUT
Prototypes, Sample testing
Standards
[1] CENELEC EN 50361-2001, « Basic standard for the measurement of the Specific Absorption Rate related to human exposure to electromagnetic fields from mobile phones (300 MHz - 3 GHz) », July 2001
[2] IEEE 1528-2003, "Recommended Practice for Determining the Peak Spatial-Average Specific Absorption Rate (SAR) in the Human Head from Wireless Communications Devices: Measurement Techniques, December 2003
[3] IEC 62209 - 1, "Specific Absorption Rate (SAR) in the frequency range of 300 MHz to 3 GHz Measurement Procedure, Part 1: Hand-held mobile wireless communication devices", February 2005
[4] IEC 62209 - 2, Draft, "Human Exposure to Radio Frequency Fields from Handheld and Body Mounted Wireless Communication Devices - Human models, Instrumentation and Procedures Part 2: Procedure to determine the Specific Absorption Rate (SAR) in the head and body for 30 MHz to 6 GHz Handheld and Body-Mounted Devices used in close proximity to the Body.", February 2005
[5] OET Bulletin 65, Supplement C, "Evaluating Compliance with FCC Guidelines for Human Exposure to Radiofrequency Electromagnetic Fields", Edition January 2001
Based on the tests above, we certify that this item is in compliance with the standards [1] to [5] if operated according to the specific requirements and considering the thickness. The dimensions are fully compliant with [4] from 30 MHz to 6 GHz. For the other standards, the minimum lower frequency limit is limited due to the dimensional requirements ([1]: 450 MHz, [2]: 300 MHZ!3]: 800 MHz, [5]: 375 MHz)
and possibly further by the dimensions of the DUT. .;;s;"...jpl,;;,.._e.;;...;a~~fl'-
_ _
~_
Schmid & Partner Engineering AG
Date 28.4.2008 Signature I Stamp Zeughauptrasse 43,-8004 Zurich, Switzerland
Phone ttlt 44245 9/00. FjllY+41)t4~45977.9 info@ipeag,com; http://www.speag.com