Article
Food allergen knowledge, attitude and practices among
UK consumers: A structural modelling approach
Soon, Jan Mei
Available at http://clok.uclan.ac.uk/26408/
Soon, Jan Mei ORCID: 0000000304881434 (2019) Food allergen knowledge, attitude and
practices among UK consumers: A structural modelling approach. Food Research International,
120 . pp. 375381. ISSN 09639969
It is advisable to refer to the publisher’s version if you intend to cite from the work.
http://dx.doi.org/10.1016/j.foodres.2019.03.008For more information about UCLan’s research in this area go to
http://www.uclan.ac.uk/researchgroups/
and search for <name of research Group>.
For information about Research generally at UCLan please go to
http://www.uclan.ac.uk/research/
All outputs in CLoK are protected by Intellectual Property Rights law, including
Copyright law. Copyright, IPR and Moral Rights for the works on this site are retained
by the individual authors and/or other copyright owners. Terms and conditions for use
of this material are defined in the
http://clok.uclan.ac.uk/policies/
CLoK
Central Lancashire online Knowledge
1
Food allergen knowledge, attitude and practices among UK consumers: A structural
1
modelling approach
2
Jan Mei Soon1 3
Faculty of Health and Wellbeing, University of Central Lancashire, Preston PR1 2HE, UK
4
Abstract
5
Food allergies are becoming more prevalent and affect up to 1 – 2% of adults and 5- 8% of children
6
in the UK. This study investigated the food allergen knowledge, attitude towards food allergens and
7
food allergy management practices among food allergic and intolerant consumers and / or their
8
family members and carers. Questionnaires were distributed at three major Free From events in the
9
UK in 2017 and 2018. Structural Equation Modelling (SEM) was used as a confirmatory technique to
10
determine the model’s validity. Cereals containing gluten, milk and eggs were the most common
11
triggers reported by the consumers. Other trigger foods such as chocolate, garlic, maize, onions, red
12
and white meat, spices, and fruits such as apples and cherries were also reported. Consumers
13
demonstrated very good understanding on the severity of allergic reactions, prevention method and
14
hidden egg ingredients. Overall, consumers were relatively good in the knowledge section. The
15
participants were motivated in their personal allergen avoidance towards food allergens especially in
16
checking food labels, preference for more free from product choices and handwashing. Consumers
17
did not rely on dietary apps or social media to find out about allergen-free food products. Both
18
knowledge and attitude did not translate into food allergy management practices. Significant
19
correlation between knowledge and attitude was identified suggesting that as knowledge decreases,
20
so will their attitude scores. This study suggests that targeted and systematic food allergy
21
management topics and peer support could be used to improve consumers’ knowledge and attitude
22
to positively impact food allergen handling practices.
23 24
Highlights
25
Consumers demonsrate relatively good knowledge in food allergens
26
Food allergen knowledge and attitude did not directly affect food allergen handling practices
27
A significant relationship between knowledge and attitude was identified
28 29
Keywords: food allergy; intolerance; prevention; Structural Equation Modelling
30 31
Introduction
32
The prevalence of food allergy in infancy has increased to 10% particularly in westernised regions
33
and is more common among children compared to adults (Osborne et al., 2011; Sicherer & Sampson,
34
2018). Food allergy is an adverse immune reaction that occurs upon exposure to specific food
35
(Moore, Stewart, & de Shazo, 2017) and symptoms range from mild skin reactions to severe
36
2
anaphylactic reactions. At the global level, Codex stated that the eight common food allergens
37
(cereals containing gluten, egg, milk, soy, peanuts, tree nuts, fish and shellfish) shall be declared
38
(Codex, 1985). These eight main food allergens contribute 90% of food allergic reactions (Bush &
39
Hefle, 1996). In the UK, food businesses are regulated by the EU Food Information for Consumer
40
Regulation No. 1169/2011 (EU FIC). Food businesses are required to present allergen information
41
clearly (emphasis by font, style or background colour) for prepacked foods in the list of ingredients.
42
Food businesses such as food services providing and selling non-prepacked foods are required to
43
provide allergen information for the inclusion of any of the 14 specified food allergens (celery, cereals
44
containing gluten, crustaceans, egg, fish, lupin, milk, molluscs, mustard, peanuts, sesame seeds,
45
soya, sulphur dioxide and tree nuts) (Regulation EU No. 1169/2011).
46 47
Peanuts, tree nuts and fish are the most common cause of food allergic reactions among adults in the
48
UK while children are commonly affected by milk, eggs and peanuts (NHS, 2016). Strict avoidance of
49
food allergens is the main preventative and management of food allergic reactions. However,
50
adherence to an allergen-free diet could be challenging particularly when consumers are dining out or
51
purchasing ready meals (Begen et al., 2018). According to Versluis et al. (2014), between 21 – 31%
52
of accidental consumption of allergens occurred while eating in restaurants and 13 – 23% occurred at
53
workplace or school canteens. Each year in the UK, 10 patients die from food-induced anaphylaxis
54
due to undeclared allergenic ingredients (FSA, n.d.). Recent fatalities due to presence of food
55
allergens in takeaway meals and sandwiches underscore the importance of food allergen
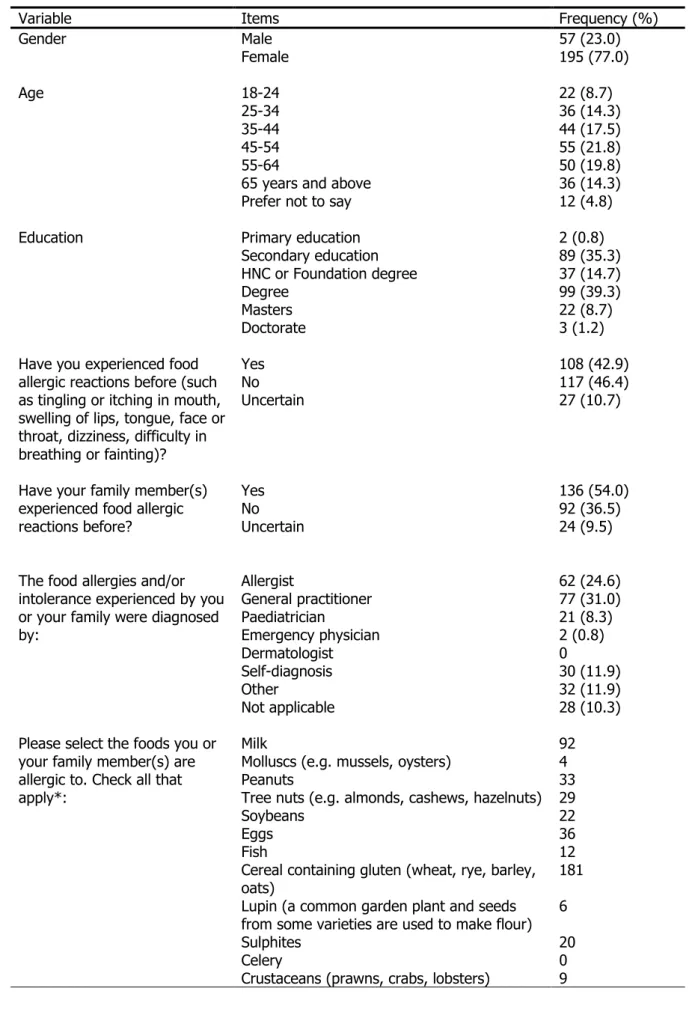
56
management, food allergen labelling and allergy awareness among catering staff (BBC News, 2018a,
57
b; Soon, 2018a).
58 59
A number of food allergen management studies had been carried out among food service workers
60
(Ajala et al., 2010; Dupuis et al., 2016; Soon, 2018a; Wham & Sharma, 2014). Food service staff
61
often receive food allergy training and such training had proven positive in Bailey, Kindratt, Smith, &
62
Reading (2014) where restaurant employees were able to answer food allergy questions, better
63
management of food allergens (e.g. review ingredient lists) and improved communication with
64
customers. Food service staff are provided with the essential training and knowledge of food allergen
65
management (Lee & Sozen, 2016). On the other hand, individuals with food allergic reactions and/or
66
intolerance often rely on their own initiatives to learn and manage their conditions and associated
67
risks. Children and vulnerable individuals manage their conditions with support from family members,
68
carers or healthcare providers. A number of consumer studies are associated with eating out practices
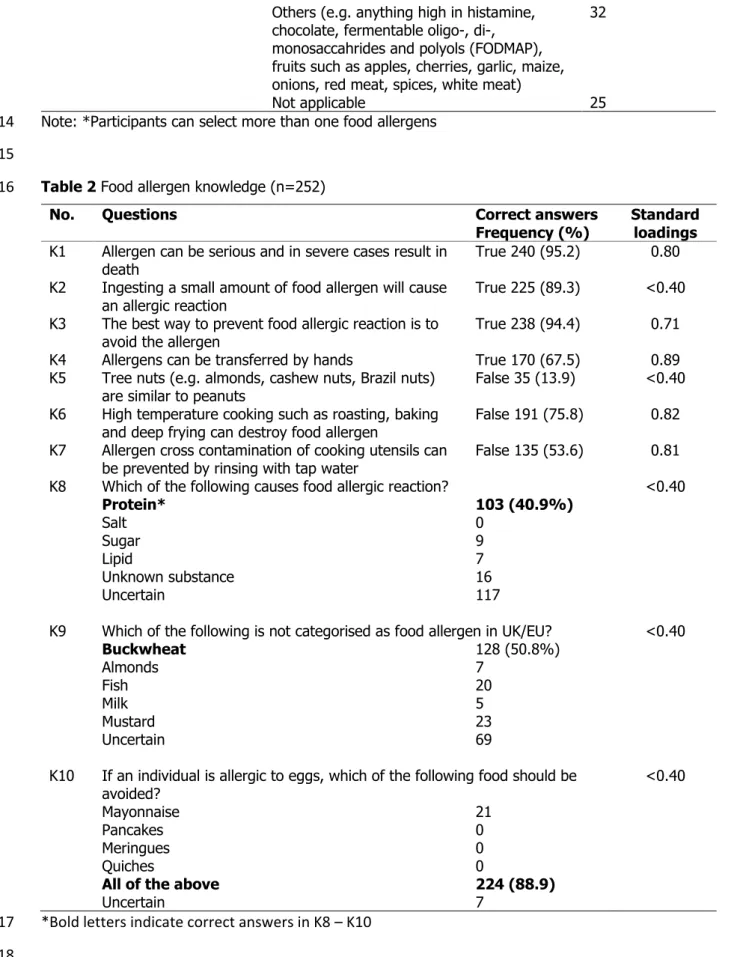
69
(Begen et al., 2018; Leftiwch et al., 2011) and food allergen labelling and purchasing habits (Barnett
70
et al., 2011; Marchisotto et al., 2017). Food allergy management deals with food allergen avoidance,
71
managing symptoms, treatment of allergic reactions as a result of accidental exposure and
72
communicating food allergic consumers’ needs (Davis & Kelso, 2018; Venter, Sicherer, & Greenhawt,
73
2019). There remain limited studies on knowledge of food allergic consumers and/or their family
3
members and carers’, their attitude and practices towards food allergens. This study investigates the
75
food allergen knowledge, attitude towards food allergens and food allergy management practices
76
among food allergic and/or intolerant consumers and / or their family members and carers. Food
77
allergen knowledge refers to the understanding of or information about food allergen acquired
78
through experience or education while attitude is a feeling or opinion about food allergies and
79
practice refers to the action or application of food allergy management (Cambridge Dictionary, 2019a,
80
b, c). Structural equation modelling (SEM) method was used as a confirmatory technique to
81
determine the proposed model validity. SEM had been used in a number of food safety studies
82
(Baser, Ture, Abubakirova, Sanlier, & Cil, 2017; Chen, 2017; Lim, Chye, Sulaiman, Mohd Suki & Lee,
83
2016) and only one study had utilised SEM in food allergy study (Soon, 2018b). In this study, the
84
author postulates the following hypotheses based on Baser et al. (2017), Lim et al. (2017), Schwartz
85
(1975), Shafie and Azman (2015) and Soon (2018b). The following hypotheses are proposed:
86 87
H1: Food allergen knowledge does not directly affect food allergen handling practices
88
H2: Attitude towards food allergen directly affects food allergen handling practices
89
H3: Food allergen knowledge and attitude are correlated
90 91 Methodology 92 Questionnaire development 93
The questionnaire was constructed and divided into five sections: (i) demographics; (ii) epidemiology;
94
(iii) knowledge (10 questions); (iv) attitude (10 questions); and (v) practices (10 questions). The
95
questions were developed based on previous studies (Choi & Choi, 2016; Marchisotto et al., 2016;
96
Shafie & Azman, 2015; Soon, 2018b). In the food allergen knowledge section, participants were
97
given options e.g. “yes”, “no” or “uncertain” to prevent participants from selecting the correct answer
98
by chance. In the attitude and practices section, participants were asked to rate based on a Likert
99
scale of 1 (strongly disagree / never) to 5 (strongly agree / always). A pilot study was conducted
100
among 20 participants (excluded from the actual study) to ensure the clarity and suitability of
101 wordings. 102 103 Data collection 104
The author visited two main Free From events in Liverpool (3 – 4 Nov 2017 and 3 – 4 2018) and
105
London (7 – 9 July 2017). Another Free From event scheduled in Glasgow in 3 – 4 March 2018 was
106
cancelled. The Free From event caters to consumers with allergies and intolerance needs and exhibits
107
a number of free from food, cosmetics and household items. It draws 12,000 number of visitors in
108
2017 (ACC Liverpool Group, 2018). Consumers experiencing food allergies or intolerance, or those
109
who are carers to individuals with food allergies / intolerance and those interested in free from food
110
products were invited to participate in the study. The reason why family members were included in
111
the survey was because third party allergen avoidance is also practiced by family members and carers
4
and they require the skills and experience to manage food allergens at home and interpret food
113
allergen information (Gowland, 2015). The study was explained to them using an information sheet
114
and consent was obtained prior to completing the survey. The author utilised a face to face approach
115
during such events as it returns a higher response rate as consumers are interested in the topic.
116 117
Statistical analysis
118
Descriptive and Exploratory Factor Analysis (EFA) was conducted using SPSS 24.0. EFA was
119
performed to extract items from knowledge, attitude and practices based on factor loadings greater
120
than 0.4 (Baser et al., 2017; Soon, 2018b). Based on the extracted items, SEM was conducted using
121
Analysis of Moment Structures (AMOS) and confidence level was set at 95%.
122 123
Results and Discussion
124
A total of 254 questionnaires were returned of which 252 were valid. All the consumers approached
125
and invited by the author agreed to participate in the study, resulting in a 100% response rate. Most
126
of the respondents were females, with the highest representative from the 45 – 54 and 55 – 64 year
127
old categories. This is similar to previous surveys in the UK where female respondents dominated the
128
samples (Cole, Peek, & Cowe, 2018; Gadema & Oglethorpe, 2011). Females also tend to be the main
129
decision maker in food purchasing decisions (Cole et al., 2018) and main caregivers (DunnGalvin et
130
al., 2006; Swinkels, van Tilburg, VerbakeL, & van Groenou, 2017). Almost 40% of the respondents
131
graduated with a degree and about 10% have a postgraduate degree reflecting a highly educated
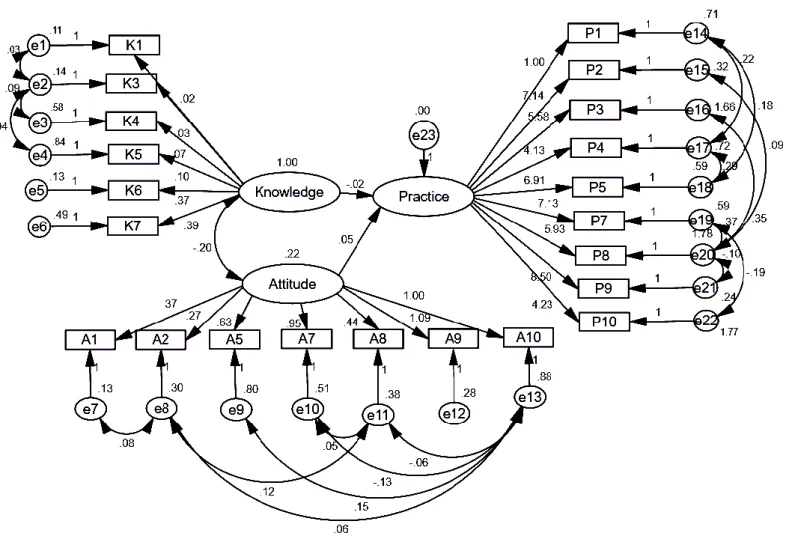
132
group of consumers. More than 45% of the consumers and about 37% of the consumers’ family
133
members have had not experienced food allergic reactions before but this could be due to the fact
134
that consumers with food intolerance, coeliac disease (CD) patients or those with personal lifestyle
135
choices also participated in the study. Participants were mostly diagnosed by general practitioners,
136
allergists and other healthcare practitioners (e.g. consultants, gastroenterologists and dietitians). It is
137
interesting to note that 30 respondents self-diagnosed their food allergies / intolerance. Cereals
138
containing gluten (35%), milk (17.8%), eggs (6.9%) and peanuts (6.4%) were the most common
139
causative agents reported by the participants (Table 1). Cow’s milk, wheat, egg, soy, peanut, tree
140
nuts, fish and shellfish results in the majority of food allergic reactions in Europe (Nwaru et al., 2014).
141
In the UK, food allergy affects about 1 – 2% of adults and 5- 8% of children (Buck, Hattersley, &
142
Kimber, 2010). Coeliac disease patients selected cereals containing gluten as the main causative
143
ingredients that aggravate their autoimmune disease. About 1 – 2% of the global population are
144
affected by CD (Collin, Vilppula, Luostarinen, Holmes, & Kaukinen, 2018). The incidence rate of CD
145
was 19.1 per 100,000 person in the UK (West, Fleming, Tata, Card, & Crooks, 2014).
146 147
Insert Table 1 here
148 149
5
More than 90% of the respondents were aware of the danger of food allergens and the best way to
150
avoid an allergic reaction is to avoid the causative agent. There was less certainty when it comes to
151
the potential for cross contact of allergens via hands as 15.9% and 16.7% answered incorrectly or
152
were uncertain about the statement. 38.1% believed that tree nuts are similar to peanuts while 48%
153
were uncertain about this statement. A third of the respondents knew that high temperature cooking
154
does not destroy food allergen and more than half recognised that rinsing cooking utensils with water
155
only is insufficient. 46.4% were uncertain that most food allergens are protein-based products. More
156
than half of the respondents knew that buckwheat is not listed as a food allergen in UK/EU and up to
157
89% of the respondents are aware of potential hidden egg ingredients in food products (Table 2).
158
Most of the respondents have good understanding of hidden allergenic ingredients in food products
159
and knew that consuming even a small amount of food allergen will cause an allergic reaction and in
160
severe cases, it can be fatal. Respondents scored 67% in the overall knowledge section and were
161
relatively good. This demonstrates that the respondents understood what is needed to control and
162
manage their food allergies and/or intolerance.
163 164
In Soon (2018a), one third of takeaway staff did not know that allergens can be transferred by
165
hands. Food allergens can be transferred from hands during food preparation (Sheehan et al., 2018).
166
Brough et al. (2013) revealed that peanut protein persisted on hands 3 hours after peanut
167
consumption. Thermal processing can influence allergenicity by modifying the allergenic protein via
168
protein denaturation, restructuring of disulfide bonds or formation of new intra/inter molecular bonds
169
(Ekezie, Cheng, & Sun, 2018). The changes that occur may influence allergenicity positively,
170
negatively or indifferently, e.g. the modified structure of proteins may introduce new allergy
171
generating sites or loses the original allergenicity (Vanga & Raghavan, 2017). It is true that most food
172
allergens are glycoproteins (oligosaccharide + protein) (Ekezie et al., 2018) but respondents may
173
associate food allergenicity with the type of food product rather than the composition and structure of
174
the food allergens. Foods with hidden allergens can be dangerous for food allergic patients. Anibarro,
175
Seoane and Mugica (2007) reported that 22.4% of 530 food reactions were considered to be due to
176
hidden allergens. Food allergy knowledge and awareness are critical to the safety of consumers with
177
food allergy. This is particularly important to family members and/or carers of food allergic individuals
178
as they are faced with the expectation to manage food allergies, recognise symptoms and treat food
179
allergic reactions and anaphylaxis. Equipped with food allergy knowledge can boost confidence and
180
improve food allergy prevention strategies and preparedness for anaphylaxis (Gupta et al., 2009;
181
Tsuang et al., 2019).
182 183
Insert Table 2 here
184 185
There were strong agreement among respondents concerning checking of food labels, preference for
186
more free from choices and that one should wash their hands after coming into contact with food
6
allergens. Respondents also felt that there should be more information provided about allergen-free
188
food when ordering food online and agreed that it is their responsibility to inform staff of their food
189
allergies if ordering via telephone. Consumers were less certain about purchasing of food with
190
allergenic ingredients even if other household members can consume the product with no adverse
191
health effects. Neither were consumers confident in being able to handle a food allergy emergency
192
situation (Table 3).
193 194
Studies had been conducted among food allergic consumers who disregard food labels especially
195
those bearing food allergen advisory statements (Robertson et al., 2013). Consumers are confused
196
with Precautionary Allergen Labelling (PAL) and the use of PAL often frustrate and restrict consumers’
197
food choices (Ong, 2008; Sharma, Pereira, & Williams, 2015). There’s a higher level of risk taking
198
among consumers because of ‘label fatigue’ among consumers which increase the tendency to
199
disregard advisory labels (Robertson et al., 2013). In Sheth et al. (2008) and Sheth et al. (2010), the
200
authors found 6.3% and 8.3% (n=695) of allergic individuals who ignored PAL went on to have a
201
resultant allergic reaction to material that was present in the food through cross contamination.
202
Edwards and Thomas (2018) recommended the triple check of food labels i.e. read the label at the
203
store, when unpacking the groceries and before serving. It is encouraging to note that respondents
204
felt very strongly about checking of food labels. Handwashing is key to prevent cross contact of food
205
allergens and Perry, Conover-Walker, Pomes, Chapman and Wood (2004) recommended that hands
206
should be washed with soap to remove protein residue. Perry et al. (2004) found that using plain
207
water and antibacterial hand sanitiser left detectable peanut on hands. When ordering food online in
208
the UK, consumers with food allergens are directed to contact the restaurants / takeaways directly to
209
determine if allergen-free meals could be prepared and delivered. At the moment, there are limited
210
information and studies in this area, and is definitely worth exploring. The uncertainty in dealing with
211
a food allergy emergency demonstrates the importance of competence in using an auto-injector and
212
calling the emergency helpline if someone is suffering from a food allergic reaction.
213 214
Insert Table 3 here
215 216
Consumers frequently read the food labels to check for allergenic ingredients and wash their hands
217
before preparing allergen-free meals. When dining out, consumers frequently inform staff about their
218
food allergies and would verify that their meals are indeed allergen-free when served. On the
219
contrary, the respondents seldom use dietary apps or Quick Response (QR) codes to find out if food
220
products contain any allergens. There were also less reliance on social media to find suitable eateries
221
when dining out. Not all respondents find the advisory labelling helpful though (Table 4).
222 223
Insert Table 4 here
224 225
7
According to Begen et al. (2016), consumers with food allergies / intolerances preferred to rely on
226
written information before and during their eating out experiences. This can be done by checking the
227
venue websites, checking the recipes on the internet and menus displayed in the restaurant window.
228
Verbal information from knowledgeable and perceptive staff increased consumers’ confidence in the
229
safety of their meals. Potentially, the reliance on written and verbal information provided by the
230
restaurants enable consumers to be confident in their meals. Most consumers did not use food allergy
231
apps to determine if a product is suitable or to find out more information about the ingredients. There
232
are multiple dietary apps provided to food allergy and intolerant users today such as the Foodmaestro
233
food app which helps to validate if a product is suitable and to look for alternative products across
234
major retailers in the UK (Foodmaestro, 2017). The Biteappy (2018) app helps to search for allergy
235
friendly restuarants worldwide. It is worth exploring the type and source of information used by food
236
allergic individuals (e.g. advice from healthcare practitioners, online allergy support group, media,
237
restaurant reviews) to make their decisions in food choices and allergy management. Precautionary
238
allergen labelling (PAL) remains an area of confusion. Walker, Hazel and Points (2018) proposed that
239
a target should be agreed on between government and retailers for a reduction in the variants of PAL
240
wordings within the next three years.
241 242
EFA was applied in factor analysis to extract the items for knowledge, attitude and practices. The
243
score of < 0.40 is used to select items (Baser et al. 2017). A total of four items from knowledge,
244
three items from attitude and one item from practices were removed. The Kaiser-Meyer-Olkin (KMO)
245
measure of sampling value for food allergen knowledge, attitude and practices were 0.614, 0.603 and
246
0.696 respectively. These values fulfil Hair, Black, Babin, Anderson, and Tatham (2010) who stated
247
that the criterion of validity should be > 0.60. Hair, Anderson, Tatham and Black (1998) also
248
recommended observing more than one indicator to evaluate the model fit (Table 5).
249 250
Insert Table 5 here
251 252
CFI measured 0.90 indicating a good model fit. GFI and NFI were slightly below the cut off value but
253
were comparable to Baser et al. (2017) and Wang et al. (2017). The RMSEA and RMR measured
254
below 0.08 (Hu & Bentler, 1999; MacCallum et al., 1996). Based on the indices and comparison with
255
other similar studies, the hypothesised model had an acceptable fit.
256 257
Insert Figure 1 here
258 259
Insert Table 6 here
260 261
Figure 1 and Table 6 explains the magnitude and relationship between food allergen knowledge,
262
attitude towards food allergen and food allergy management practices. Food allergen knowledge has
8
a negative and insignificant relationship (β1 =-0.02, p>0.05) with food allergy management practices
264
hence supporting H1. The theoretical interpretation from Figure 1 is that food allergy management
265
practices will decrease 0.02 unit with each incremental unit in knowledge. Although this does not
266
indicate a direct, linear relationship between knowledge and practices, but this finding reiterates that
267
having good food allergen knowledge may not translate into good practices. Previous studies by
268
Baser et al. (2017), Soon (2018b) and Ko (2013) support this finding.
269 270
Attitude towards food allergens were found to have a positive and insignificant relationship with
271
practices (β1 =0.05, p>0.05) hence rejecting H2. β1 indicates that food allergy management
272
practices increase by 0.05 unit with each unit increase in attitude. This contradicts previous findings
273
where Baser et al. (2017), Soon (2018) and Lim et al. (2016) reported significant relationship
274
between food safety attitude and practices. Although the respondents scored highly in most of the
275
attitude mean items, this does not translate into food allergy management practices. This could be
276
due to the fact that consumers seldom rely on apps or social media to check out suitable products or
277
restaurants. Okumus, Ali, Billgihan, & Ozturk (2018) suggested that consumers’ intention to use and
278
adoption of dietary apps can be increased by increasing the apps’ performance, ease of usage, social
279
inflluence and degree of user innovativeness. The consumers in this study also did not often
280
purchase, whole unprocessed ingredients to prepare their meals from scratch. In fact, they would like
281
to have more free-from choices, indicating that consumers would prefer to purchase ready meals or
282
semi-finished ingredients that do not contain the allergenic materials. Time saving in meal
283
preparation was identified as a key driver in food choices (Casini et al., 2019). The two key strategies
284
employed by the respondents in this study are handwashing before preparing allergen-free meal and
285
communicating their needs to food service staff when eating out. There is a significant and negative
286
relationship between food allergen knowledge and attitude in this study (β1 =-0.20, p<0.05),
287
supporting H3. This indicates that knowledge and attitude dependently affect practices. As knowledge
288
decreases, so will their attitude towards food allergens. Tan et al. (2013) found weak correlations
289
between knowledge and attitude among food handlers while Soon (2018b) found insignificant
290
relationship between both attributes among consumers.
291 292
The current best method to prevent food allergic reactions would be to adhere to a strict free-from
293
diet. However, researchers are working on oral immunotherapies to build up tolerance for food
294
allergens (Blumchem et al., 2018; Wasserman et al., 2018). The PALISADE Group of Clinical
295
Investigators (2018) revealed encouraging results where peanut oral immunotherapy resulted in
296
desensitisation among children and adolescents who were highly allergic to peanuts. Such trials can
297
potentially prevent food allergic reactions and life-threatening circumstances as consumers’ tolerance
298
levels are increased and could tolerate accidental consumption of food allergens. This coupled with
299
vigilant safe food handling and food allergy management practices can help to ensure the safety of
300
consumers with food allergies. Food safety is not synonymous with the total absence of risk (FAO,
9
WHO, 1997). Similarly, zero risk for food allergic individuals is not a realistic option. Consumers,
302
regulators, clinical researchers and food industry are working towards defining a tolerable level of risk
303
(Madsen et al., 2010). Madsen et al. (2012) reported that the guiding principle in defining acceptable
304
risk is the concept of minimising the overall risk and hence, the burden of disease caused by food
305
allergy. Begen et al. (2016, 2018) carried out in-depth interviews to gain understanding of
306
consumers’ preferences for food allergy and intolerance (FAI) information and impact of such
307
information when eating out while Begen et al. (2017) reported on the experiences of family
308
members and carers’ who eat out with children with FAI. In addition to quantitative surveys, it is
309
recommended that in-depth interviews be carried out with the consumers to explore their views and
310
food allergen handling practices especially the adoption of dietary apps in managing FAI.
311 312
Conclusion
313
Consumers demonstrated relatively good knowledge in food allergens and are motivated in their
314
personal allergen avoidance towards food allergy management. Most respondents however did not
315
resort to using dietary apps or social media to find out more information about food products.
316
Consumers also prefer to have more free-from choices and may not have time to prepare meals from
317
scratch. The structural equation modelling showed an acceptable fit on food allergen knowledge,
318
attitude and practices. Although knowledge and attitude did not directly affect their food allergy
319
management practices, a significant relationship was identified between knowledge and attitude. A
320
combination of knowledge and attitude can potentially modify food allergen handling practices. It is
321
suggested that targeted and specific food allergy management topics and online or peer group
322
support are provided to improve the knowledge-attitude relationships to positively influence their food
323
allergen handling practices.
324 325
References
326
ACC Liverpool Group (2018). Free from show winter. Available at:
327 https://www.exhibitioncentreliverpool.com/whats-on/the-allergy-free-from-show-north/ [Accessed 16 328 November 2018] 329 330
Ajala, A. R., Cruz, A. G., Faria, J. A., Walter, E. H., Granato, D., & Sant, A. S. (2010). Food allergens:
331
Knowledge and practices of food handlers in restaurants. Food Control, 21(10), 1318-1321.
332 333
Anibarro, B., Seoane, F. J., & Mugica, M. V. (2007). Involvement of hidden allergens in food allergic
334
reactions. Journal of Investigational Allergology and Clinical Immunology, 17(3), 168.
335 336
Bailey, S., Kindratt, T. B., Smith, H., Reading, D. (2014). Food allergy training event for restaurant
337
staff; a pilot evaluation. Clinical and Translational Allergy, 4, 26.
338 339
Barnett, J., Leftwich, J., Muncer, K., Grimshaw, K., Shepherd, R., Raats, M. M. et al. (2011). How do
340
peanut and nut-allergic consumers use information on the packaging to avoid allergens. Allergy,
341
66(7), 969-978.
342 343
Baser, F., Ture, H., Abubakirova, A., Sanlier, N., & Cil, B. (2017). Structural modelling of the
344
relationship among food safety knowledge, attitude and behaviour of hotel staff in Turkey. Food
345
Control, 73(B), 438-444.
10 347
BBC News (2018a). Pret a Manger to label products after allergy death. BBC News, 3 October 2018.
348
Available at: https://www.bbc.co.uk/news/business-45731201 [Accessed 10 November 2018]
349 350
BBC News (2018b). Megan Lee: Takeaway bosses jailed over allergy death. BBC News, 7 November
351
2018. Available at: https://www.bbc.co.uk/news/uk-england-lancashire-46123858 [Accessed 10
352
November 2018]
353 354
Begen, F. M., Barnett, J., Payne, R., Roy, D., Gowland, M. H., & Lucas, J. S. (2016). Consumer
355
preferences for written and oral information about allergens when eating out. PLOS One, 11(5),
356
e0156073.
357 358
Begen, F. M., Barnett, J., Barber, M., Payne, R., Gowland, M. H., Lucas, J. S. (2017). Parents’ and
359
caregivers’ experiences and behaviours when eating out with children with a food hypersensitivity.
360
BMC Public Health, 18, 38
361 362
Begen, F. M., Barnett, J., Payne, R., Gowland, H., DunnGalvin, A., & Lucas, J. S. (2018). Eating out
363
with a food allergy in the UK: Change in the eating out practices of consumers with food allergy
364
following introduction of allergen information legislation. Clinical & Experimental Allergy, 48(3),
317-365
324.
366 367
Bentler, P. M., & Bonnet, D. C. (1980). Significance tests and goodness of fit in the analysis of
368
covariance structures. Psychological Bulletin, 88(3), 588-606.
369 370
Biteappy (2018). Biteappy. Available at: https://www.biteappy.com/#!/home [Accessed 20 November
371
2018]
372 373
Blumchen, K., Trendelenburg, V., Ahrens, F., Gruebl, A., Hamelmann, E., Hansen, G. et al. (2018).
374
Efficacy, safety, and quality of life in a multi-center, randomized, placebo-controlled trial of low-dose
375
peanut oral immunotherapy in peanut allergic children. Journal of Allergy and Clinical Immunology: In
376
Practice, doi: 10.1016/j.jaip.2018.10.048
377 378
Brough, H. A., Makinson, K., Penagos, M., Maleki, S. J., Cheng, H., Douiri, A., Stephens, A. C.,
379
Turcanu, V., & Lack, G. (2013). Distribution of peanut protein in the home environment. Journal of
380
Allergy and Clinical Immunology, 132(3), 623-629.
381 382
Buck, J., Hattersley, S., & Kimber, I. (2010). Food allergy – science and policy needs – The UK Food
383
Standards Agency Research Programme. Toxicology, 278(3), 319-325.
384 385
Bush, R. K., & Hefle, S. L. (1996). Food allergens. Critical Reviews in Food Science and Nutrition, 36,
386
S119-S163.
387 388
Cambridge Dictionary (2019a). Knowledge. Cambridge University Press. Available at:
389
https://dictionary.cambridge.org/dictionary/english/knowledge [Accessed 17 December 2019]
390 391
Cambridge Dictionary (2019b). Attitude. Cambridge University Press. Available at:
392
https://dictionary.cambridge.org/dictionary/english/attitude [Accessed 17 December 2019]
393 394
Cambridge Dictionary (2019c). Practice. Cambridge University Press. Available at:
395
https://dictionary.cambridge.org/dictionary/english/practice [Accessed 17 December 2019]
396 397
Casini, L., Boncinelli, F., Contini, C., Gerini, F., Scozzafava, G., & Alfnes, F. (2019). Heterogenous
398
preferences with respect to food preparation time: Foodies and quickies. Food Quality and
399
Preference, 71, 233-241.
400 401
Chen, M.-F. (2017). Modeling an extended theory of planned behavior model to predict intention to
402
take precautions to avoid consuming food with additives. Food Quality and Preference, 58, 24-33.
11 404
Choi, J., & Choi, A. (2016). Perceptions of food labelling about allergens in food products in South
405
Korea. British Food Journal, 118(12), 2842-2854.
406 407
Codex (1985). Codex General Standard for the Labelling of Prepackaged Foods. CODEX STAN 1-1985
408
(Rev 1-1991). Available at: http://www.fao.org/docrep/005/Y2770E/y2770e02.htm#fn4 [Accessed 10
409
November 2018]
410 411
Cole, M., Peek, H. and Cowen, D. (2018). UK consumer perceptions of a novel till-receipt ‘traffic-light’
412
nutrition system. Health Promotion International, doi.org/10.1093/heapro/day007
413 414
Collin, P., Vilppula, A., Luostarinen, L., Holmes, G. K. T., & Kaukinen, K. (2018). Review article:
415
Coeliac disease in later life must not be missed. Alimentary Pharmacology and Therapeutics, 47,
563-416
572.
417 418
Davis, C. M., & Kelso, J. M. (2018). Food allergy management. Immunology and Allergy Clinics of
419
North America, 38(1), 53-64.
420 421
DunnGalvin, A., Hourihane, J. O’B., Frewer, L., Knibb, R. C., Elberink, J. N. G. O., & Klinge, I. (2006).
422
Incorporating a gender dimension in food allergy research: a review. European Journal of Allergy and
423
Clinical Immunology, 61(11), 1336-1343.
424 425
Dupuis, R., Meisel, Z., Grande, D., Strupp, E., Kounaves, S., Graves, A. et al. (2016). Food allergy
426
management among restaurant workers in a large U.S. city. Food Control, 63, 147-157.
427 428
Edwards, J. B. E., & Thomas, B. F. (2018). Putting THOUGHT into food allergens. 2018 Annual
429
Virginia Head Start Conference, 10 – 12 April 2018, Virgina. Available at:
430
https://www.headstartva.org/assets/Annual-Conference/2018-Conference/Workshop-431
Handouts/Putting%20Thought%20into%20Food%20Allergens_faedadal.pdf [Accessed 19 November
432
2018]
433 434
Ekezie, F.-G. C., Cheng, J.-H., & Sun, D.-W. (2018). Effects of nonthermal food processing
435
technologies on food allergens: A review of recent research advances. Trends in Food Science &
436
Technology, 74, 12-25.
437 438
FAO.WHO (1997). Risk management and food safety. Report of a Joint FAO.WHO consultation. Rome,
439
Italy, 27 to 31 January. FAO Food and Nutrition Paper, number 65. Available at:
440
http://www.fao.org/3/a-w4982e.pdf [Accessed 17 February 2019]
441 442
Foodmaestro (2018). Foodmaestro Food App. Available at:
443
http://www.foodmaestro.me/consumer.html [Accessed 20 November 2018]
444 445
FSA, Food Standards Agency (n.d.). Food allergy facts. Available at:
446
http://allergytraining.food.gov.uk/english/food-allergy-facts.aspx [Accessed 23 November 2018]
447 448
Gadema, Z., & Oglethorpe, D. (2011). The use and usefulness of carbon labelling food: A policy
449
perspective from a survey of UK supermarket shoppers. Food Policy, 36(6), 815-822.
450 451
Gowland, M. H. (2015). Chapter 7. Consumer attitudes to allergens in foods. Handbook of Food
452
Allergen Detection and Control. Woodhead Publishing Series in Food Science, Technology and
453
Nutrition, 133-160.
454 455
Gupta, R. S., Kim, J. S., Springston, E. E., Smith, B., Pongracic, J. A., Wang, X., & Holl, J. (2009).
456
Food allergy knowledge, attitudes, and beliefs in the United States. Annals of Allergy, Asthma &
457
Immunology, 103(1), 43-50.
458 459
12
Hair, J. R. Jr., Anderson, R. E., Tatham, R. L., & Black, W. C. (1998). Multivariate data analysis. 5th
460
Ed. New Jersey: Prentice-Hall.
461 462
Hair, J. F., Black, B., Babin, B., Anderson, R. E., & Tatham, R. I. (2010). Multivariate analysis: A
463
global perspective. New Jersey: Person Education Inc, Upper Saddle River.
464 465
Hooper, D., Coughlan, J., & Mullen, M. (2008). Structural equation modelling: Guidelines for
466
determining model fit. Electronic Journal of Business Research Methods, 6(1), 53-60.
467 468
Hu, L. T., & Bentler, P. M. (1999). Cutoff criteria for fit indexes in covariance structure analysis:
469
Conventional criteria versus new alternatives. Structural Equation Modeling 6(1), 1-55.
470 471
Kline, R. B. (1998). Principles and practice of structural equation modelling. Guilford Press, New York.
472 473
Ko, W.-H. (2013). The relationship among food safety knowledge, attitudes and self-reported HACCP
474
practices in restaurant employees. Food Control, 29, 192-197.
475 476
Lee, Y. M., & Sozen, E. (2016). Food allergy knowledge and training among restaurant employees.
477
International Journal of Hospitality Management, 57, 52-59.
478 479
Leftwich, J., Barnett, J., Muncer, K., Shepherd, R., Raats, M., Gowland, M. H. et al. (2011). The
480
challenges for nut-allergic consumers of eating out. Clinical & Experimental Allergy, 41(2), 243-249.
481 482
Lim, T.-P., Chye, F. Y., Sulaiman, M. R., Mohd Suki, N., & Lee, J. S. (2016). A structural modelling on
483
food safety knowledge, attitude, and behaviour among Bum Bum Island community of Semporna,
484
Sabah. Food Control, 60, 241-246.
485 486
MacCallum, R. C., Browne, M. W., & Sugawara, H. M. (1996). Power analysis and determination of
487
sample size for covariance structure modelling. Psychological Methods, 1(2), 130-149.
488 489
Madsen, C. B., Crevel, R., Chan, H. C., Dubois, A. E. J., DunnGalvin, A., Flokstra-de Blok, B. M. J. ET
490
AL. (2010). Food allergy: Stakeholder perspectives on acceptable risk. Regulatory Toxicology and
491
Pharmacology, 57(2-3), 256-265.
492 493
Madsen, C. B., Hattersley, S., Allen, K. J., Beyer, K., Chan, C. H., Godefroy, S. B. et al. (2012). Can
494
we define a tolerable level of risk in food allergy? Report from a Euro Prevall/UK Food Standards
495
Agency workshop. Clinical & Experimental Allergy 42(1), 30-37.
496 497
Marchisotto, M. J., Harada, L., Kamdar, O., Smith, B. M., aserman, S., Sicherer, S. et al. (2017). Food
498
allergen labelling and purchasing habits in the United States and Canada. Journal of Allergy and
499
Clinical Immunology: In Practice, 5(2), 345-351.
500 501
Moore, L. E., Stewart, P. H., & de Shazo, R. D. (2017). Food allergy: What we know now. The
502
American Journal of Medical Sciences, 353(4), 353-366.
503 504
NHS (2016). Food allergy. Available at: https://www.nhs.uk/conditions/food-allergy/ [Accessed 10
505
November 2018]
506 507
Nwaru, B. I., Hickstein, L., Panesar, S. S., Muraro, A., Werferl, T., Cardona, V. et al. (2014). The
508
epidemiology of food allergy in Europe: a systematic review and meta-analysis. European Journal of
509
Allergy and Clinical Immunology, 69(1), 62-75.
510 511
Okumus, B., Ali, F., Bilgihan, A., & Ozturk, A. B. (2018). Psychological factors influencing customers’
512
acceptance of smartphone diet apps when ordering food at restaurants. International Journal of
513
Hospitality Management, 72, 67-77.
514 515
13
Ong, P. Y. (2008). Are allergy advisory statements helpful to patients with food allergy? Journal of
516
Allergy and Clinical Immunology, 121(2), 536-537.
517 518
Osborne, N. J., Koplin, J. J., Martin, P. E., Gurrin, L. C., Lowe, A. J., Matheson, M. C. et al. (2011).
519
Prevalence of challenge-proven IgE-mediated food allergy using population-based sampling and
520
predetermined challenge criteria in infants. Journal of Allergy and Clinical Immunology, 127(3),
668-521
676.
522 523
Perry, T. T., Conover-Walker, M. K., Pomes, A., Chapman, M. D., & Wood, R. A. (2004). Distribution
524
of peanut allergen in the environment. Journal of Allergy and Clinical Immunology, 113(5), 973-976.
525 526
Regulation (EU) No. 1169/2011. Regulation EU No. 1169.2011 of the European parliament and of the
527
council of 25 October 2011. Official Journal of the European Union, L 304/18. Available at:
528 https://eur-lex.europa.eu/legal-content/EN/TXT/PDF/?uri=CELEX:32011R1169&from=en [Accessed 529 10 Nov 2018] 530 531
Robertson, O. N., Hourihane, J. O’B., Remington, B. C., Baumert, J. L., & Taylor, S. L. (2013). Survey
532
of peanut levels in selected Irish food products bearing peanut allergen advisory labels. Food
533
Additives and Contaminants: Part A, 30(9), 1467-1472.
534 535
Schwartz, N. E. (1975). Nutritional knowledge, attitudes, and practices of high school graduates.
536
Journal of the American Dietetic Association, 66(1), 28-31.
537 538
Shafie, A. A., & Azman, A. W. (2015). Assessment of knowledge, attitude and practice of food
539
allergies among food handlers in the state of Penang, Malaysia. Public Health, 129(9), 1278-1284.
540 541
Sharma G. M., Pereira, M., & Williams, K. M. (2015). Gluten detection in foods available in the United
542
States – A market survey. Food Chemistry, 169, 120-126.
543 544
Sheehan, W. J., Taylor, S. L., Phipatanakul, W., & Brough, H. A. (2018). Environmental food
545
exposure: What is the risk of clinical reactivity from cross-contact and what is the risk of sensitization.
546
Journal of Allergy and Clinical Immunology: In Practice, 6(6), 1825-1832.
547 548
Sheth, S. S., Waserman, S., Kagan. R. Alizadehfar, R., Primeau, M.-N., Elliot, S. et al. (2010). Role of
549
food labels in accidental exposures in food-allergic individuals in Canada. Annals of Allergy, Asthma &
550
Immunology, 104(1), 60-65.
551 552
Sheth, S. S., Waserman, S., Kagan, R., Alizadehfar, R., Primeau, M. et al. (2008). Improving food
553
labelling for the allergic consumer. Journal of Allergy and Clinical Immunology, 121(2), S183
554 555
Sicherer, S. H., & Sampson, H. A. (2018). Food allergy: A review and update on epidemiology,
556
pathogenesis, diagnosis, prevention, and management. Journal of Allergy and Clinical Immunology,
557
141(1), 41-58.
558 559
Soon, J. M. (2018a). ‘No nuts please’: Food allergen management in takeaways. Food Control, 91,
560
349-356.
561 562
Soon, J. M. (2018b). Structural modelling of food allergen knowledge, attitude and practices among
563
consumers in Malaysia. Food Research International, 111, 674-681.
564 565
Swinkels, J., van Tilburg, T., Verbakel, E., & van Groenou, M. B. (2017). Explaining the gender gap in
566
the caregiving burden of partner caregivers. Journal of Gerontology: Social Sciences,
567
doi.org/10.1093/geronb/gbx036
568 569
Tan, L. T., Bakar, F. A., Karim, M. S. A., Lee. H. Y., & Mahyuddin, H. Y. (2013). Hand hygiene
570
knowledge, attitudes and practices among food handlers at primary schools in Hulu Langat district,
571
Selangor (Malaysia). Food Control, 34, 428-435.
14 573
The PALISADE Group of Clinical Investigators (2018). AR101 oral immunotherapy for peanut allergy.
574
New England Journal of Medicine, doi: 10.1056/NEJMoa1812856
575 576
Tsuang, A., Atal, Z., Demain, H., Patrick, K., Pistiner, M., & Wang, J. (2019). Benefits of school nurse
577
training sessions for food allergy and anaphylaxis management. Journal of Allergy and Clinical
578
Immunology: In Practice, 7(1), 309-311.
579 580
Vanga, S. K., & Ranghavan, V. (2017). Processing effects on tree nut allergens: A review. Critical
581
Reviews in Food Science and Nutrition, 57(17), 3794-3806.
582 583
Venter, C., Sicherer, S. H., & Greenhawt, M. (2019). Management of peanut allergy. Journal of Allergy
584
and Clinical Immunology: In Practice, 7(2), 345-355.
585 586
Versluis, A., Knulst, A. C., Kruizinga, A. G., Michelsen, A., Houben, G. F., & Baumert, J. L. (2014).
587
Frequency, severity and causes of unexpected allergic reactions to food: a systematic literature
588
review. Clinical & Experimental Allergy, 45(2), 347-367.
589 590
Walker, M. J., Gowland, M. H. & Points, J. (2018). Managing food allergens in the U.K. Retail Supply
591
Chain. Journal of AOAC International, 101(1), 45-55.
592 593
Wang, J., Tao, J., Yang, C., Chu, M., & Lam, H. (2017). A general framework incorporating
594
knowledge, risk perception and practices to eliminate pesticide residues in food: A structural equation
595
modelling analysis based on survey data of 986 Chinese farmers. Food Control, 80, 143-150.
596 597
Wasserman, R. L., Hague, A. R., Pence, D. M., Sugerman, R. W., Silvers, S. K., Rolen, J. G., &
598
Herbert, M. (2018). Real-world experience with peanut oral immunotherapy: Lessons learned from
599
270 patients. Journal of Allergy and Clinical Immunology: In practice, doi: 10.1016/j.jaip.2018.05.023
600 601
West, J., Fleming, K. M., Tatam L. J., Card, T. R., & Crooks, C. J. (2014). Incidence and prevalence of
602
celiac disease and dermatitis herpetiformis in the UK over two decades: Population-based study.
603
Americal Journal of Gastroenterology, 109, 757-768.
604 605
Wham, C. A. and Sharma, K. M. (2014). Knowledge of café and restaurant managers to provide a
606
safe meal to food allergic consumers. Nutrition & Dietetics, 71(4), 265-269.
607 608 609
15 610
Figure 1 Structural Equation Modelling of food allergen knowledge, attitude and practices among UK consumers
16 612
Table 1 Demographic characteristics of participants (n=252)
613
Variable Items Frequency (%)
Gender Male 57 (23.0) Female 195 (77.0) Age 18-24 22 (8.7) 25-34 36 (14.3) 35-44 44 (17.5) 45-54 55 (21.8) 55-64 50 (19.8)
65 years and above 36 (14.3)
Prefer not to say 12 (4.8)
Education Primary education 2 (0.8)
Secondary education 89 (35.3)
HNC or Foundation degree 37 (14.7)
Degree 99 (39.3)
Masters 22 (8.7)
Doctorate 3 (1.2)
Have you experienced food allergic reactions before (such as tingling or itching in mouth, swelling of lips, tongue, face or throat, dizziness, difficulty in breathing or fainting)?
Yes 108 (42.9)
No 117 (46.4)
Uncertain 27 (10.7)
Have your family member(s) experienced food allergic reactions before?
Yes 136 (54.0)
No 92 (36.5)
Uncertain 24 (9.5)
The food allergies and/or intolerance experienced by you or your family were diagnosed by: Allergist 62 (24.6) General practitioner 77 (31.0) Paediatrician 21 (8.3) Emergency physician 2 (0.8) Dermatologist 0 Self-diagnosis 30 (11.9) Other 32 (11.9) Not applicable 28 (10.3)
Please select the foods you or your family member(s) are allergic to. Check all that apply*:
Milk 92
Molluscs (e.g. mussels, oysters) 4
Peanuts 33
Tree nuts (e.g. almonds, cashews, hazelnuts) 29
Soybeans 22
Eggs 36
Fish 12
Cereal containing gluten (wheat, rye, barley,
oats) 181
Lupin (a common garden plant and seeds
from some varieties are used to make flour) 6
Sulphites 20
Celery 0
17
Mustard 9
Sesame seed 8
Others (e.g. anything high in histamine, chocolate, fermentable oligo-, di-, monosaccahrides and polyols (FODMAP), fruits such as apples, cherries, garlic, maize, onions, red meat, spices, white meat)
32
Not applicable 25
Note: *Participants can select more than one food allergens
614 615
Table 2 Food allergen knowledge (n=252)
616
No. Questions Correct answers
Frequency (%) Standard loadings
K1 Allergen can be serious and in severe cases result in
death True 240 (95.2) 0.80
K2 Ingesting a small amount of food allergen will cause
an allergic reaction True 225 (89.3) <0.40
K3 The best way to prevent food allergic reaction is to
avoid the allergen True 238 (94.4) 0.71
K4 Allergens can be transferred by hands True 170 (67.5) 0.89 K5 Tree nuts (e.g. almonds, cashew nuts, Brazil nuts)
are similar to peanuts False 35 (13.9) <0.40
K6 High temperature cooking such as roasting, baking
and deep frying can destroy food allergen False 191 (75.8) 0.82 K7 Allergen cross contamination of cooking utensils can
be prevented by rinsing with tap water False 135 (53.6) 0.81 K8 Which of the following causes food allergic reaction? <0.40
Protein* 103 (40.9%) Salt 0 Sugar 9 Lipid 7 Unknown substance 16 Uncertain 117
K9 Which of the following is not categorised as food allergen in UK/EU? <0.40
Buckwheat 128 (50.8%) Almonds 7 Fish 20 Milk 5 Mustard 23 Uncertain 69
K10 If an individual is allergic to eggs, which of the following food should be
avoided? <0.40
Mayonnaise 21
Pancakes 0
Meringues 0
Quiches 0
All of the above 224 (88.9)
Uncertain 7
*Bold letters indicate correct answers in K8 – K10 617
618 619 620
18 621
Table 3 Mean scores of items in attitude towards food allergens (1: Strongly disagree to 5: Strongly
622
agree) (n=252)
623
Items Description Mean Standard
deviation Standard loadings
A1 When purchasing food, labels should be checked if it contains any ingredients that can cause food allergic reaction
4.82 0.41 0.67
A2 There should be more free from choices to choose
from 4.64 0.57 0.87
A3 I will not purchase food containing the food allergen (where I or a family member is allergic to) even though other household members are not allergic to it
3.25 1.32 <0.40
A4 Kitchen surfaces and cooking equipment are washed
with hot soapy water and rinse to remove allergens 4.33 0.71 <0.40 A5 It is easy to prepare allergen-free meals by
substituting with other types of ingredients (e.g. wheat can be substituted with quinoa)
4.06 0.95 0.71
A6 Hands should be washed thoroughly after coming into contact with allergenic products to avoid cross contact
4.64 0.49 <0.40 A7 It is my responsibility to inform food services if I
have any food allergies 4.46 0.84 0.61
A8 When ordering food online, there should be more
information provided about allergen free food 4.48 0.65 0.67 A9 When ordering food via telephone, it is my
responsibility to ask for allergen free food
4.49 0.74 0.66
A10 I believe I can handle a food allergy emergency
situation at home or when eating out 3.62 1.05 0.61
624 625
Table 4 Mean scores of items food allergen management practices (1: Never to 5: Always) (n=252)
626
Items Description Mean Standard
deviation Standard loadings
P1 I purchase whole, unprocessed foods 3.67 0.85 0.65 P2 During shopping, I read the food labelling to check
for allergenic ingredients 4.59 0.77 0.69
P3 I use apps or scan the QR code to find out if the
ingredients contain any allergens 2.29 1.35 0.46
P4 I prepare my meals from scratch 3.93 0.90 0.59
P5 I look for alternative ingredients to use in my meal
preparation or as food substitutes 3.90 0.92 0.74 P6 I wash my hands before preparing allergen-free
meal 4.60 0.75 <0.40
P7 When eating out, I frequent restaurants that cater
allergen-free meals 4.10 0.93 0.68
P8 I check social media to identify suitable restaurants 3.22 1.41 0.49 P9 I would inform the staff of my food allergies and
seek confirmation that my meal is allergen-free when served
4.56 0.79 0.71
P10 I find the precautionary allergen labelling ‘May
contain’ helpful 3.63 1.37 0.85
19 628
Table 5 Goodness of fit indices
629
Fit indices Model value Accepted value
ϰ2/df 1.98 < 31
Comparative Fit Index (CFI) 0.90 > 0.902
Goodness of Fit Index (GFI) 0.82 >0.903
Root Mean Square Error of Approximation (RMSEA) 0.06 <0.084
Normed Fit Index (NFI) 0.70 > 0.905
Root Mean Square Residual (RMR) 0.05 < 0.082 1Kline (1998)
630
2Hu and Bentler (1999)
631
3Hooper, Coughlan and Mullen (2008)
632
4MacCallum et al. (1996)
633
5Bentler and Bonnet (1980)
634 635
Table 6 Estimates of hypothesis paths for food allergen knowledge, attitude and practice
636
Hypothesis Paths Estimate C.R. P value
H1 Knowledge Practice -0.02 -1.09 0.28
H2 Attitude Practice 0.05 1.11 0.27
H3 Knowledge <--> Attitude -0.20 -3.40 < 0.05
637 638