Dec 1st, 12:00 AM
Nitrogen management for corn
Emerson Nafziger
University of Illinois
Follow this and additional works at:
https://lib.dr.iastate.edu/icm
Part of the
Agriculture Commons
, and the
Agronomy and Crop Sciences Commons
This Event is brought to you for free and open access by the Conferences and Symposia at Iowa State University Digital Repository. It has been accepted for inclusion in Proceedings of the Integrated Crop Management Conference by an authorized administrator of Iowa State University Digital Repository. For more information, please [email protected].
Nafziger, Emerson, "Nitrogen management for corn" (2017).Proceedings of the Integrated Crop Management Conference. 23. https://lib.dr.iastate.edu/icm/2017/proceedings/23
Nitrogen management for corn
Emerson Nafziger, professor, Crop Sciences, University of Illinois
As pressure continues to reduce production costs, to manage risks, and to reduce loss of N to the environment, managing nitrogen remains a major challenge to Corn Belt corn producers. Major
considerations include N rate, form of nitrogen, use of stabilizers, and method and timing of application.
Choosing nitrogen rates
While it’s easy to get caught up in questions of N timing and form, the first decision is on how much N to use. Recent years in much of Illinois and Iowa have brought favorable weather, good to outstanding corn yields, and, based on numerous N rate trials, the need for only modest rates of N. Data from 34 N response trials in Illinois in 2016 show an average yield of 225 bushels per acre and an optimum N rate (the N rate that pays for the last pound of N by increasing the yield by 1/10th of a bushel) of only 157 lb. N per acre (Figure 1). The corn crop needs to take up about 1 pound of N for each bushel it produces, so on average the crop got nearly 70 lb. of N from mineralization of soil organic N. Such data are added to the database that powers the N rate calculator (at http://cnrc.agron.iastate.edu/) to help improve future predictions. At the price ratio where 1 bushel of corn pays for 10 lb. of N, current corn and N prices, guideline rates for corn following soybean are 154, 172, and 179 lb. N per acre in northern, central, and southern Illinois, respectively, and 200, 200, and 189 lb. N per acre for corn following corn.
Figure 1. Yield responses in 34 N rate trials conducted in corn following soybean in central and northern Illinois in
2016. Yellow triangles indicate optimum N rate and yield for each response curve, and green circles show the N rate (MRTN) from the N rate calculator.
The calculator guideline rates (MRTN values) and the “profitable” N rate ranges found there represent the best starting point for determining N rate for corn. The MRTN can’t be expected to hit the exact rate needed for a field in a given year, but it’s more likely to be higher than the actual rate needed than it is to be lower; only 8 of the 34 response trials in Figure 1 actually needed more N than the MRTN rate. Choosing high rates in order to be “safe” carries both economic and environmental costs.
N timing
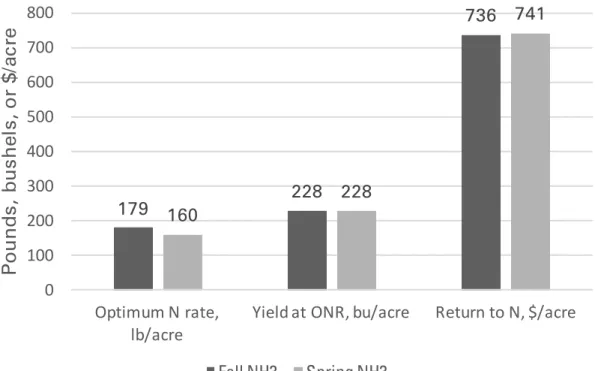
While applying ammonia in the fall after soil temperatures have dropped below 50 degrees and including a nitrification inhibitor has not been removed from the list of BMPs, fall-applied N is in the soil for some six months before N uptake by the next crop begins, and this increases the risk of N loss. Across eight on-farm N rate by timing trials over the last four years in Illinois, we found that waiting until spring to apply N as ammonia lowered the N requirement by about 19 pounds but had almost no effect on corn yield; with the lower N rate, net return over N cost was about $5 per acre higher for fall-applied N (Figure 2.) Tile line studies typically show loss of perhaps 10 pounds more N per acre from fall- versus spring-applied ammonia. So there is some advantage to spring-applied N, but advantages in timeliness and better soil conditions in the fall can outweigh the disadvantages, as long as care is taken to apply only after soils are cool enough, to use inhibitor (N-Serve®), and to apply carefully.
179
228
736
160
228
741
0
100
200
300
400
500
600
700
800
Optimum N rate,
lb/acre
Yield at ONR, bu/acre
Return to N, $/acre
Pounds
,
bus
he
ls
, or
$
/a
cr
e
Fall NH3
Spring NH3
Figure 2. Optimum N rates, yields, and return to N cost (at optimum N rates) averaged over eight on-farm
comparisons of fall- versus spring-applied N rates. Prices used to determine optimum N rates and returns are $3.50 per bushel and $0.35 per pound of N.
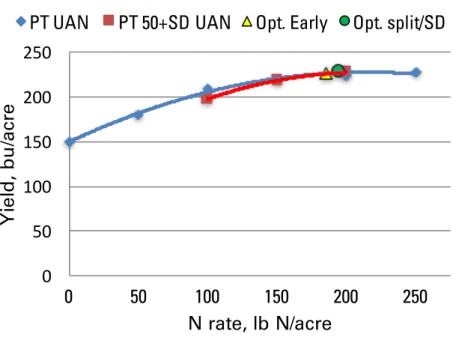
Another large questions regarding N timing is whether and how to split the N amounts in the spring, reserving some N for application during vegetative growth, including applications as late as tasseling time or even later. We have in general found less advantage to splitting N between planting-time and sidedress applications than we expected to find. Averaged over a series of trials comparing all of the N at planting versus 50 lb. N at planting and the rest as sidedress UAN, we found that sidedress produced 1.6 bushels more yield but requires about 9 lb. more N per acre. Sidedressing produced only about $2 per acre more than applying all of the N at planting, without including the cost of the sidedressing operation.
0
50
100
150
200
250
0
50
100
150
200
250
Y
ie
ld
, b
u
/a
cr
e
N rate, lb N/acre
PT UAN
PT 50+SD UAN
Opt. Early
Opt. split/SD
Figure 3. Yield responses averaged over ten Illinois N rate trials comparing application of all of the N as UAN at
planting (“PT”) versus 50 lb. N at planting and the remained at sidedress time.
Our finding that waiting – from fall to spring or from planting time to sidedress – to apply some or most of the N tends to show little advantage in yield or the amount of N required suggests that we may be losing less N than we have often imagined we are losing. That conclusion has been backed up by our work monitoring soil N during the spring in recent years. Fall-applied ammonia tends to be mostly nitrate by spring planting time, even when we use an inhibitor. Spring-applied ammonia nitrifies (converts from ammonium to nitrate) more slowly, but by early June when crop N uptake accelerates, most of it is nitrate. Even in 2015, when June was very wet, we did not see an unusually large decline in soil N during crop development. Soil N, of course, does decline by a lot between the V5 stage and tasseling, but most of the decline is related to crop uptake, not loss of N down and out of the root zone.
Another practice that has been marketed in recent years is the application of N late during vegetative growth, up to tasseling or even later. We have found very little benefit to delaying application of the last increment (50 lb.) of N until tasseling. In a representative example of one of about a dozen trials we have conducted, we found that application of all of the N at planting versus keeping back 50 lb. of N to dribble near the row at tasseling time produced identical N responses (Figure 4.) While N was equally effective applied either way, there was no benefit to the late-split N to pay for this extra application.
0 50 100 150 200 250 300
0
50
100
150
200
250
Yield, bu/acre
N rate, lb N/acre
Early
Early+50 lb late
Optimum E
Opt. E+L
Figure 4. Response to N rate, with N applied either all at planting or all but 50 lb. at planting and 50 lb. dribbled into
the row at tasseling. Data are for corn following soybean at Urbana in 2016.
N form and additives
We have over the past four years conducted large studies at a number of sites to compare different forms, application times, and the use of various N additives on corn yield. Each site includes an N response trial, and then a comparison of a number of treatments all at the 150-lb. rate of N.
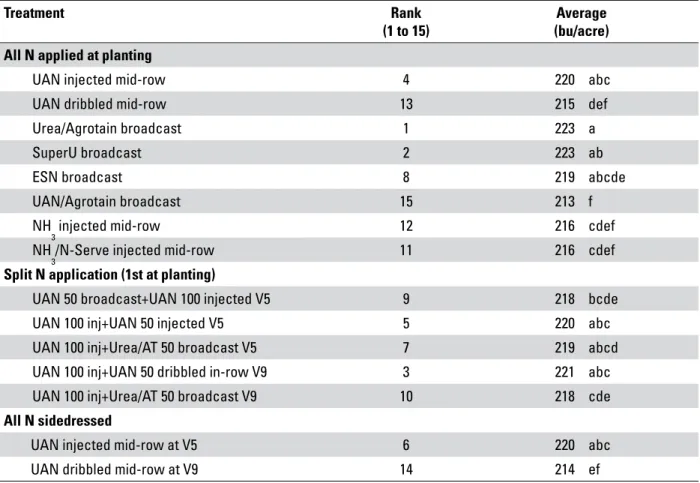
Among the 15 treatments over ten trials from 2014 through 2016, only 10 bushels per acre separate the highest from the lowest yields (Table 1). The two highest yields came from broadcasting dry urea with Agrotain® (urease inhibitor) or as SuperU® (which incorporates both urease and nitrification inhibitors)
at planting. We did not include urea without an inhibitor, so do not know how much the inhibitors contributed. Other treatments that yielded more than the average included UAN injected at planting (our “check” treatment), 100 lb. N at planting followed by 50 lb. UAN, either injected at V5 or dribbled mid-row at V9, and no N at planting with 150 lb. N as UAN injected at V5.
Table 1. Yields and yield ranks across 10 site-years, 2014 through 2016, for 15 different times and forms of N used to apply 150 lb. of N per acre. Sites included DeKalb, Monmouth, and Urbana in all three years, and Perry in 2016.
Treatment Rank
(1 to 15) (bu/acre)Average
All N applied at planting
UAN injected mid-row 4 220 abc
UAN dribbled mid-row 13 215 def
Urea/Agrotain broadcast 1 223 a
SuperU broadcast 2 223 ab
ESN broadcast 8 219 abcde
UAN/Agrotain broadcast 15 213 f
NH
3 injected mid-row 12 216 cdef
NH
3/N-Serve injected mid-row 11 216 cdef
Split N application (1st at planting)
UAN 50 broadcast+UAN 100 injected V5 9 218 bcde
UAN 100 inj+UAN 50 injected V5 5 220 abc
UAN 100 inj+Urea/AT 50 broadcast V5 7 219 abcd
UAN 100 inj+UAN 50 dribbled in-row V9 3 221 abc
UAN 100 inj+Urea/AT 50 broadcast V9 10 218 cde
All N sidedressed
UAN injected mid-row at V5 6 220 abc
UAN dribbled mid-row at V9 14 214 ef
Yield averages not followed by the same letter are significantly different; seven of the 15 treatments did not yield significantly less than the highest-yielding treatment, and five treatments did not yield statistically more than the lowest-yielding treatment. The lowest-yielding treatments included UAN with Agrotain broadcast at planting; UAN dribbled between rows at planting or at V9; and ammonia injected at or before planting, with or without N-Serve. Treatments with lower yields were those that included surface application of UAN or application of N in a way that likely meant some delay before plant roots could get access to the N. There may have been some loss of surface-applied N to volatilization, but N broadcast as UAN on the surface may also not have moved down to the roots quickly.
Summing up
Given all that can happen when we apply N fertilizer in a way that we think will produce high corn yields, it’s no big surprise that this research has not so far identified clear “winners” or “losers” among the different ways to manage N. based on our results, we can conclude that most ways to manage N are probably working reasonably well. Unexpected results included the good performance of broadcast urea (with inhibitors); treatments that did not perform as well as expected include UAN applied on top of the soil, whether all at planting or at other times, and anhydrous ammonia applied at or before planting.
These results overall seem to point to the benefit of having much of the N in the soil into which the roots grow, and to have it there relatively early in the season. Though we didn’t measure soil N in this study, most of the treatments that produced below-average yields were ones that supplied most of the N only
at or after the plants had grown for a month or more. Treatments such as UAN dribbled or ammonia injected between rows at planting might have placed the N out of reach of early root growth. In contrast, broadcasting urea or injecting UAN between rows at planting might have resulted in more N in the soil where the roots grew early.
Overall, our results to date show that most ways we manage N now, as long as we choose the best rates and pay attention to equipment and operations, are likely to produce good yields and to make efficient use of N. While we need to monitor the crop and soil conditions as the crop grows, increasing the complexity and costs of N management may do little to lower risks, and may not pay off in many fields in many years. Above all, we need to avoid the economic and environmental risks that come from the “more is better” approach to N management.