OPEN SPACE
ASSET MANAGEMENT PLAN
Document ID: 59_07_101209 nams plus_amp template v11 1
Rev No Date Revision Details Author Reviewer Approver
3 July 2008 Draft for Elected Members JV MB RD
4 Nov 2011 Update due to Re-Valuation IMcG PS SH
© Copyright 2007 – All rights reserved.
ABBREVIATIONS ... i
GLOSSARY ... ii
1. EXECUTIVE SUMMARY ... 1
What Council Provides ... 1
What does it Cost? ... 1
Plans for the Future ... 1
Measuring our Performance ... 1
The Next Steps ... 1
2. INTRODUCTION ... 1
2.1 Background ... 1
2.2 Goals and Objectives of Asset Management ... 2
2.3 Plan Framework... 3
2.4 Core and Advanced Asset Management ... 5
3. LEVELS OF SERVICE ... 5
3.1 Customer Research and Expectations ... 6
3.2 Legislative Requirements ... 6
3.3 Current Levels of Service ... 7
3.4 Desired Levels of Service ... 8
4. FUTURE DEMAND ... 11
4.1 Demand Forecast ... 11
4.2 Changes in Technology ... 12
4.3 Demand Management Plan ... 13
4.4 New Assets from Growth ... 14
5. LIFECYCLE MANAGEMENT PLAN ... 15
5.1 Background Data ... 15
5.1.1 Physical parameters ... 15
5.1.2 Asset capacity and performance ... 16
5.1.3 Asset condition ... 16
5.1.4 Asset valuations ... 17
5.2 Risk Management Plan ... 17
5.3 Routine Maintenance Plan ... 18
5.3.1 Maintenance plan... 18
5.3.2 Standards and specifications ... 19
5.3.3 Summary of future maintenance expenditures ... 19
5.4 Renewal/Replacement Plan ... 20
5.4.1 Renewal plan ... 20
5.4.2 Renewal standards ... 20
5.4.3 Summary of future renewal expenditure ... 20
5.5 Creation/Acquisition/Upgrade Plan ... 21
5.5.1 Selection criteria ... 21
5.5.2 Standards and specifications ... 26
5.5.3 Summary of future upgrade/new assets expenditure ... 26
5.6 Disposal Plan ... 26
6. FINANCIAL SUMMARY ... 27
6.1 Financial Statements and Projections ... 27
6.1.1 Sustainability of service delivery ... 27
6.2 Funding Strategy ... 30
6.3 Valuation Forecasts ... 30
6.4 Key Assumptions made in Financial Forecasts ... 32
7. ASSET MANAGEMENT PRACTICES ... 33
7.1 Accounting/Financial Systems ... 33
7.2 Asset Management Systems ... 34
7.3 Information Flow Requirements and Processes ... 34
7.4 Standards and Guidelines ... 35
8. PLAN IMPROVEMENT AND MONITORING ... 36
8.1 Performance Measures ... 36
8.2 Improvement Plan... 36
8.3 Monitoring and Review Procedures ... 37
REFERENCES ... 38
APPENDICES ... 39
Appendix A Maintenance Response Levels of Service ... 39
Appendix B Projected 20 year Capital Renewal Works Program... 39
ABBREVIATIONS
AAAC Average annual asset consumption
AMP Asset management plan
ARI Average recurrence interval
BOD Biochemical (biological) oxygen demand
CRC Current replacement cost
CWMS Community wastewater management systems
DA Depreciable amount
DoH Department of Health
EF Earthworks/formation
IRMP Infrastructure risk management plan
LCC Life Cycle cost
LCE Life cycle expenditure
MMS Maintenance management system
PCI Pavement condition index
RV Residual value
SS Suspended solids
GLOSSARY
Annual service cost (ASC)An estimate of the cost that would be tendered, per annum, if tenders were called for the supply of a service to a performance specification for a fixed term. The Annual Service Cost includes operating, maintenance, depreciation, finance/ opportunity and disposal costs, less revenue.
Asset class
Grouping of assets of a similar nature and use in an entity's operations (AASB 166.37).
Asset condition assessment
The process of continuous or periodic inspection, assessment, measurement and interpretation of the resultant data to indicate the condition of a specific asset so as to determine the need for some preventative or remedial action.
Asset management
The combination of management, financial, economic, engineering and other practices applied to physical assets with the objective of providing the required level of service in the most cost effective manner.
Assets
Future economic benefits controlled by the entity as a result of past transactions or other past events (AAS27.12).
Property, plant and equipment including infrastructure and other assets (such as furniture and fittings) with benefits expected to last more than 12 month.
Average annual asset consumption (AAAC)*
The amount of a local government’s asset base consumed during a year. This may be calculated by dividing the Depreciable Amount (DA) by the Useful Life and totalled for each and every asset OR by dividing the Fair Value (Depreciated Replacement Cost) by the Remaining Life and totalled for each and every asset in an asset category or class.
Brownfield asset values**
Asset (re)valuation values based on the cost to replace the asset including demolition and restoration costs.
Capital expansion expenditure
Expenditure that extends an existing asset, at the same standard as is currently enjoyed by residents, to a new group of users. It is discretional expenditure, which increases future operating, and maintenance costs, because it increases council’s asset base, but may be associated with additional revenue from the new user group, eg. extending a drainage or road network, the provision of an oval or park in a new suburb for new residents.
Capital expenditure
Relatively large (material) expenditure, which has benefits, expected to last for more than 12 months. Capital expenditure includes renewal, expansion and upgrade. Where capital projects involve a combination of renewal, expansion and/or upgrade expenditures, the total project cost needs to be allocated accordingly.
Capital funding
Funding to pay for capital expenditure.
Capital grants
Monies received generally tied to the specific projects for which they are granted, which are often upgrade and/or expansion or new investment proposals.
Capital investment expenditure
See capital expenditure definition
Capital new expenditure
Expenditure which creates a new asset providing a new service to the community that did not exist beforehand. As it increases service potential it may impact revenue and will increase future operating and maintenance expenditure.
Capital renewal expenditure
Expenditure on an existing asset, which returns the service potential or the life of the asset up to that which it had originally. It is periodically required expenditure, relatively large (material) in value compared with the value of the components or sub-components of the asset being renewed. As it reinstates existing service potential, it has no impact on revenue, but may reduce future operating and maintenance expenditure if completed at the optimum time, eg. resurfacing or resheeting a material part of a road network, replacing a material section of a drainage network with pipes of the same capacity, resurfacing an oval. Where capital projects involve a combination of renewal, expansion and/or upgrade expenditures, the total project cost needs to be allocated accordingly.
Capital upgrade expenditure
Expenditure, which enhances an existing asset to provide a higher level of service or expenditure that will increase the life of the asset beyond that which it had originally. Upgrade expenditure is discretional and often does not result in additional revenue unless direct user charges apply. It will increase operating and maintenance expenditure in the future because of the increase in the council’s asset base, eg. widening the sealed area of an existing road, replacing drainage pipes with pipes of a greater capacity, enlarging a grandstand at a sporting facility. Where capital projects involve a combination of renewal, expansion and/or upgrade
expenditures, the total project cost needs to be allocated accordingly.
Carrying amount
The amount at which an asset is recognised after deducting any accumulated depreciation / amortisation and accumulated impairment losses thereon.
Class of assets
See asset class definition
Component
An individual part of an asset which contributes to the composition of the whole and can be separated from or attached to an asset or a system.
Cost of an asset
The amount of cash or cash equivalents paid or the fair value of the consideration given to acquire an asset at the time of its acquisition or construction, plus any costs necessary to place the asset into service. This includes one-off design and project management costs.
Current replacement cost (CRC)
The cost the entity would incur to acquire the asset on the reporting date. The cost is measured by reference to the lowest cost at which the gross future economic benefits could be obtained in the normal course of business or the minimum it would cost, to replace the existing asset with a technologically modern equivalent new asset (not a second hand one) with the same economic benefits (gross service potential) allowing for any differences in the quantity and quality of output and in operating costs.
Current replacement cost “As New” (CRC)
The current cost of replacing the original service potential of an existing asset, with a similar modern equivalent asset, i.e. the total cost of replacing an existing asset with an as NEW or similar asset expressed in current dollar values.
Cyclic Maintenance**
Replacement of higher value components/sub-components of assets that is undertaken on a regular cycle including repainting, building roof replacement, cycle, replacement of air conditioning equipment, etc. This work generally falls below the capital/ maintenance threshold and needs to be identified in a specific maintenance budget allocation.
Depreciable amount
The cost of an asset, or other amount substituted for its cost, less its residual value (AASB 116.6)
Depreciated replacement cost (DRC)
The current replacement cost (CRC) of an asset less, where applicable, accumulated depreciation calculated
Depreciation / amortisation
The systematic allocation of the depreciable amount (service potential) of an asset over its useful life.
Economic life
See useful life definition.
Expenditure
The spending of money on goods and services. Expenditure includes recurrent and capital.
Fair value
The amount for which an asset could be exchanged, or a liability settled, between knowledgeable, willing parties, in an arms length transaction.
Greenfield asset values **
Asset (re)valuation values based on the cost to initially acquire the asset.
Heritage asset
An asset with historic, artistic, scientific, technological, geographical or environmental qualities that is held and maintained principally for its contribution to knowledge and culture and this purpose is central to the objectives of the entity holding it.
Impairment Loss
The amount by which the carrying amount of an asset exceeds its recoverable amount.
Infrastructure assets
Physical assets of the entity or of another entity that contribute to meeting the public's need for access to major economic and social facilities and services, eg. roads, drainage, footpaths and cycleways. These are typically large, interconnected networks or portfolios of composite assets The components of these assets may be separately maintained, renewed or replaced individually so that the required level and standard of service from the network of assets is continuously sustained. Generally the components and hence the assets have long lives. They are fixed in place and are often have no market value.
Investment property
Property held to earn rentals or for capital appreciation or both, rather than for:
(a) use in the production or supply of goods or services or for administrative purposes; or
(b) sale in the ordinary course of business (AASB 140.5)
Level of service
The defined service quality for a particular service against which service performance may be measured. Service levels usually relate to quality, quantity, reliability, responsiveness, environmental, acceptability and cost).
Life Cycle Cost **
The life cycle cost (LCC) is average cost to provide the service over the longest asset life cycle. It comprises annual maintenance and asset consumption expense, represented by depreciation expense. The Life Cycle Cost does not indicate the funds required to provide the service in a particular year.
Life Cycle Expenditure **
The Life Cycle Expenditure (LCE) is the actual or planned annual maintenance and capital renewal expenditure incurred in providing the service in a particular year. Life Cycle Expenditure may be compared to Life Cycle Cost to give an initial indicator of life cycle sustainability.
Loans / borrowings
Loans result in funds being received which are then repaid over a period of time with interest (an additional cost). Their primary benefit is in ‘spreading the burden’ of capital expenditure over time. Although loans enable works to be completed sooner, they are only ultimately cost effective where the capital works funded (generally renewals) result in operating and maintenance cost savings, which are greater than the cost of the loan (interest and charges).
Maintenance and renewal gap
Difference between estimated budgets and projected expenditures for maintenance and renewal of assets, totalled over a defined time (eg 5, 10 and 15 years).
Maintenance and renewal sustainability index
Ratio of estimated budget to projected expenditure for maintenance and renewal of assets over a defined time (eg 5, 10 and 15 years).
Maintenance expenditure
Recurrent expenditure, which is periodically or regularly required as part of the anticipated schedule of works required to ensure that the asset achieves its useful life and provides the required level of service. It is expenditure, which was anticipated in determining the asset’s useful life.
Materiality
An item is material is its omission or misstatement could influence the economic decisions of users taken on the basis of the financial report. Materiality depends on the size and nature of the omission or misstatement judged in the surrounding circumstances.
Modern equivalent asset.
A structure similar to an existing structure and having the equivalent productive capacity, which could be built using modern materials, techniques and design. Replacement cost is the basis used to estimate the cost of constructing a modern equivalent asset.
Non-revenue generating investments
Investments for the provision of goods and services to sustain or improve services to the community that are not expected to generate any savings or revenue to the Council, eg. parks and playgrounds, footpaths, roads and bridges, libraries, etc.
Operating expenditure
Recurrent expenditure, which is continuously required excluding maintenance and depreciation, eg power, fuel, staff, plant equipment, on-costs and overheads.
Pavement management system
A systematic process for measuring and predicting the condition of road pavements and wearing surfaces over time and recommending corrective actions.
Planned Maintenance**
Repair work that is identified and managed through a maintenance management system (MMS). MMS activities include inspection, assessing the condition against failure/breakdown criteria/experience, prioritising scheduling, actioning the work and reporting what was done to develop a maintenance history and improve maintenance and service delivery performance.
PMS Score
A measure of condition of a road segment determined from a Pavement Management System.
Rate of annual asset consumption*
A measure of average annual consumption of assets (AAAC) expressed as a percentage of the depreciable amount (AAAC/DA). Depreciation may be used for AAAC.
Rate of annual asset renewal*
A measure of the rate at which assets are being renewed per annum expressed as a percentage of depreciable amount (capital renewal expenditure/DA).
Rate of annual asset upgrade*
A measure of the rate at which assets are being upgraded and expanded per annum expressed as a percentage of depreciable amount (capital upgrade/expansion expenditure/DA).
Reactive maintenance
Unplanned repair work that carried out in response to service requests and management/supervisory directions.
Recoverable amount
The higher of an asset's fair value, less costs to sell and its value in use.
Recurrent expenditure
Relatively small (immaterial) expenditure or that which has benefits expected to last less than 12 months. Recurrent expenditure includes operating and maintenance expenditure.
Recurrent funding
Funding to pay for recurrent expenditure.
Rehabilitation
See capital renewal expenditure definition above.
Remaining life
The time remaining until an asset ceases to provide the required service level or economic usefulness. Age plus remaining life is economic life.
Renewal
See capital renewal expenditure definition above.
Residual value
The net amount which an entity expects to obtain for an asset at the end of its useful life after deducting the expected costs of disposal.
Revenue generating investments
Investments for the provision of goods and services to sustain or improve services to the community that are expected to generate some savings or revenue to offset operating costs, eg public halls and theatres, childcare centres, sporting and recreation facilities, tourist information centres, etc.
Risk management
The application of a formal process to the range of possible values relating to key factors associated with a risk in order to determine the resultant ranges of outcomes and their probability of occurrence.
Section or segment
A self-contained part or piece of an infrastructure asset.
Service potential
The capacity to provide goods and services in accordance with the entity's objectives, whether those objectives are the generation of net cash inflows or the provision of goods and services of a particular volume and quantity to the beneficiaries thereof.
Service potential remaining*
A measure of the remaining life of assets expressed as a percentage of economic life. It is also a measure of the percentage of the asset’s potential to provide services that is still available for use in providing services (DRC/DA).
Strategic Management Plan (SA)**
Documents Council objectives for a specified period (3-5 yrs), the principle activities to achieve the objectives, the means by which that will be carried out, estimated income and expenditure, measures to assess performance and how rating policy relates to the Council’s objectives and activities.
Sub-component
Smaller individual parts that make up a component part.
Useful life
Either:
(a) the period over which an asset is expected to be available for use by an entity, or
(b) the number of production or similar units expected to be obtained from the asset by the entity.
It is estimated or expected time between placing the asset into service and removing it from service, or the estimated period of time over which the future economic benefits embodied in a depreciable asset, are expected to be consumed by the council. It is the same as the economic life.
Value in Use
The present value of estimated future cash flows expected to arise from the continuing use of an asset and from its disposal at the end of its useful life. It is deemed to be depreciated replacement cost (DRC) for those assets whose future economic benefits are not primarily dependent on the asset's ability to generate new cash flows, where if deprived of the asset its future economic benefits would be replaced.
Source: DVC 2006, Glossary
Note: Items shown * modified to use DA instead of CRC Additional glossary items shown **
1.
EXECUTIVE SUMMARY
What Council Provides
Council provides an open space network in partnership with the community, stakeholders, and other levels of government to enable availability of an appropriate open space network for residents and visitors.
The City of Holdfast Bay’s open space assets consist of major sporting reserves, open reserves (including local parks), natural reserves, and cemeteries. See
Appendix A for a comprehensive list of all assets in this category. Note that a separate Infrastructure and Asset Management Plan (IAMP) has been prepared for the Coast – defined as all assets beyond the western footpath of the Esplanade.
What does it Cost?
The assets covered by this IAMP are covered in four categories: Parks & Reserves, Sporting Reserves, Natural Reserves, and Cemeteries.
The life cycle cost being the average cost over the life cycle of the asset, and
The total maintenance and capital renewal expenditure required to deliver existing service levels in the next 10 years covered by Council’s long term financial plan.
The life cycle cost to provide the Open Space service is estimated at $2,353,770 per annum. Council’s planned life cycle expenditure for year 1 of the asset management plan is $1,798,420 which gives a life cycle sustainability index of .76.
The total maintenance and capital renewal expenditure required to provide the Open Space service the in the next 10 years is estimated at $18,863,930. This is an average of $1,886,393 per annum.
Council’s maintenance and capital renewal expenditure for year 1 of the asset management plan of $1,798,420
giving a 10 year sustainability index of 0.95.
Plans for the Future
Council plans to operate and maintain the Open Space network to achieve the following strategic objectives. 1. Ensure the Open Space network is maintained at a
safe and functional standard as set out in this asset management plan.
2. Ensure the open space network serves the resident population of the Holdfast Bay area and the suburbs immediately adjacent, as well as visitors from within and outside Adelaide, both physically and psychologically.
3. Recognise the open space network as a component of a complete set of community facilities available to the people of Holdfast Bay and its visitors, which
provides an environment for leisure and recreation which is comfortable and familiar to local users.
Measuring our Performance
Quality
Open Space assets will be maintained in a reasonably usable condition. Defects found or reported that are outside our service standard will be repaired. See our maintenance response service levels for details of defect prioritisation and response time.
Function
Our intent is that an appropriate open space network is maintained in partnership with other levels of government where appropriate such as the Natural Resources Management Board and the Coast Protection Board of the Department of Environment and Heritage, and stakeholders such as Elected members, community groups, sporting clubs where associated with sporting facilities, residents and visitors.
Open space asset attributes will be maintained at a safe level and associated signage and equipment be provided as needed to ensure public safety. We need to ensure key functional objectives are met:
Recreation and social amenity,
Provision of green space within the city, and Opportunity for structured and unstructured activities. The main functional consequence of the open space service delivery strategy is providing passive and active recreation and ensuring these assets are maintained at a fit for purpose level.
Safety
We inspect all open space on a regular basis as field staff maintenance crews attend sites regularly to mow and clean-up rubbish, plus damage is reported via the customer request system. Damage to playgrounds is repaired immediately by customer request, rapid response team or speciality playground repairer.
The Next Steps
This actions resulting from this asset management plan are:
Develop Hierarchy of Parks which will determine service standards and their frequency of maintenance Implement development Standards in association with the Hierarchy to establish set criteria for each category
Set Budget strategies to each Hierarchy class. Develop Maintenance and Renewal procedures in accordance with the Hierarchy structure.
Implement improvements as identified in the Risk Management process
2.
INTRODUCTION
2.1
Background
This infrastructure and asset management plan is to demonstrate responsive management of assets (and services provided from assets), compliance with regulatory requirements, and to communicate funding required to provide the required levels of service.
The infrastructure and asset management plan is to be read with the following associated planning documents:
Council‟s Open Space Strategy
Council‟s Environmental Management Plan Planning SA‟s Metropolitan Open Space System
This Open Space asset management plan covers the following infrastructure and non-infrastructure assets:
Local parks, regional open space, sporting reserves, and natural reserves.
These assets provide playgrounds, picnic areas, grassed areas, community facilities such as tennis courts, may be vegetated with shady trees or of environmental and conservation significance, or community open areas (such as Moseley Square), and cemeteries.
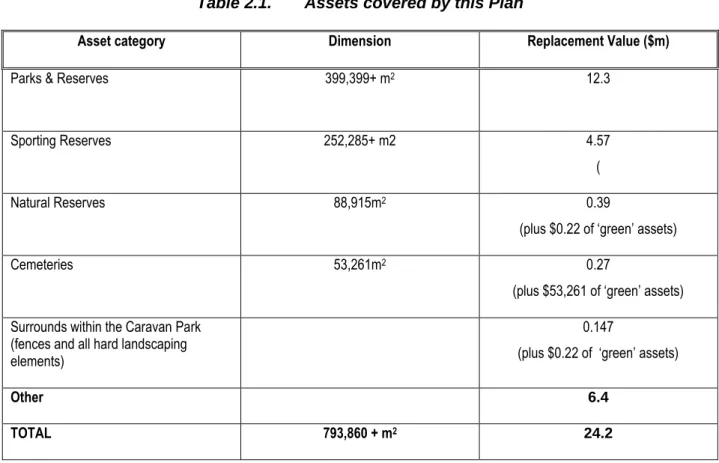
The assets covered by this IAMP are covered in four categories: Parks & Reserves, Sporting Reserves, Natural Reserves, and Cemeteries, as per Table 2.1. A complete list of open space assets held by the City of Holdfast Bay is provided at Appendix A – Register of Open Space Assets. Appendix C provides an estimated value for Council‟s living or green assets, see sections 5.1.4 and 5.1.5 for methodology and details on valuing this soft landscaping.
Table 2.1.
Assets covered by this Plan
Asset category Dimension Replacement Value ($m)
Parks & Reserves 399,399+ m2 12.3
Sporting Reserves 252,285+ m2 4.57
(
Natural Reserves 88,915m2 0.39
(plus $0.22 of ‘green’ assets)
Cemeteries 53,261m2 0.27
(plus $53,261 of ‘green’ assets) Surrounds within the Caravan Park
(fences and all hard landscaping elements)
0.147
(plus $0.22 of ‘green’ assets)
Other 6.4
Key stakeholders in the preparation and implementation of this infrastructure and asset management plan are:
External stakeholders such as residents, business community, visitor organisations, and facility users such as sporting clubs
Opportunity for input and review via formal stakeholder processes, building on previously stated community expectations.
Internal stakeholders such as Elected Members and other Council business units
Council to provide decision making and strategic direction on how assets are to be managed. Administration to develop, cost and implement detailed operational plans and prepare advice on most appropriate way forward.
Government departments, including the Local Government Association, and in particular the Department of Education and Children‟s Services who own Bowker Oval
Overview on ensuring and monitoring financial sustainability, guide operational parameters, and provide higher level management.
2.2
Goals and Objectives of Asset Management
The Council exists to provide services to its community. Some of these services are provided by infrastructure assets. Council has acquired infrastructure assets by „purchase‟, by contract, construction by council staff and by donation of assets constructed by developers and others to meet increased levels of service.
Council‟s goal in managing infrastructure assets is to meet the required level of service in the most cost effective manner for present and future consumers. The key elements of infrastructure asset management are:
Taking a life cycle approach,
Developing cost-effective management strategies for the long term, Providing a defined level of service and monitoring performance,
Understanding and meeting the demands of growth through demand management and infrastructure investment,
Managing risks associated with asset failures, Sustainable use of physical resources,
Continuous improvement in asset management practices.1
This asset management plan is prepared under the direction of Council‟s vision, mission, goals and objectives.
Council‟s vision is:
A sustainable, well serviced, safe and cohesive seaside community that enjoys an outstanding
quality of life welcomes visitors and values the City’s distinctive history and open spaces.
Council‟s mission is:We will deliver of our mission statement through efficient systems and processes, quality service
delivery, skilled people and prudent financial and asset management.
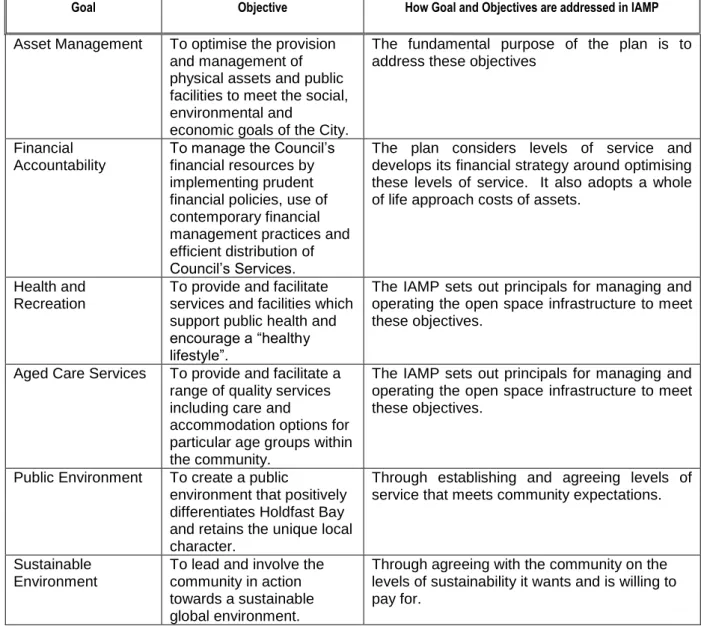
Relevant Council goals and objectives and how these are addressed in this asset management plan are:
Table 2.2. Council Goals and how these are addressed in this Plan
Goal Objective How Goal and Objectives are addressed in IAMP Asset Management To optimise the provision
and management of physical assets and public facilities to meet the social, environmental and
economic goals of the City.
The fundamental purpose of the plan is to address these objectives
Financial Accountability
To manage the Council‟s financial resources by implementing prudent financial policies, use of contemporary financial management practices and efficient distribution of Council‟s Services.
The plan considers levels of service and develops its financial strategy around optimising these levels of service. It also adopts a whole of life approach costs of assets.
Health and Recreation
To provide and facilitate services and facilities which support public health and encourage a “healthy lifestyle”.
The IAMP sets out principals for managing and operating the open space infrastructure to meet these objectives.
Aged Care Services To provide and facilitate a range of quality services including care and
accommodation options for particular age groups within the community.
The IAMP sets out principals for managing and operating the open space infrastructure to meet these objectives.
Public Environment To create a public
environment that positively differentiates Holdfast Bay and retains the unique local character.
Through establishing and agreeing levels of service that meets community expectations.
Sustainable Environment
To lead and involve the community in action towards a sustainable global environment.
Through agreeing with the community on the levels of sustainability it wants and is willing to pay for.
2.3
Plan Framework
Key elements of the plan are
Levels of service – specifies the services and levels of service to be provided by council. Future demand – how this will impact on future service delivery and how this is to be met.
Life cycle management – how Council will manage its existing and future assets to provide the required services
Financial summary – what funds are required to provide the required services. Asset management practices
Monitoring – how the plan will be monitored to ensure it is meeting Council‟s objectives. Asset management improvement plan
Road Map for preparing an Asset Management Plan
Source: IIMM Fig 1.5.1, p 1.11
IS THE PLAN AFFORDABLE? CORPORATE PLANNING
Confirm strategic objectives and establish AM policies, strategies & goals.
Define responsibilities & ownership. Decide core or advanced AM Pan. Gain organisation commitment.
REVIEW/COLLATE ASSET INFORMATION Existing information sources
Identify & describe assets. Data collection Condition assessments Performance monitoring Valuation Data
ESTABLISH LEVELS OF SERVICE Establish strategic linkages Define & adopt statements Establish measures & targets Consultation
LIFECYCLE MANAGEMENT STRATEGIES Develop lifecycle strategies
Describe service delivery strategy Risk management strategies Demand forecasting and management
Optimised decision making (renewals, new works, disposals)
Optimise maintenance strategies
FINANCIAL FORECASTS Lifecycle analysis Financial forecast summary Valuation Depreciation Funding
IMPROVEMENT PLAN Assess current/desired practices Develop improvement plan
ITERATION
Reconsider service statements Options for funding
Consult with Council Consult with Community
DEFINE SCOPE & STRUCTURE OF PLAN IN F O R M A T IO N M A N A G E M E N T , a n d D A T A I M P R O V E M E N T AM PLAN REVIEW AND AUDIT IMPLEMENT IMPROVEMENT STRATEGY ANNUAL PLAN / BUSINESS PLAN IN F O R M A T IO N M A N A G E M E N T , a n d D A T A I M P R O V E M E N T
2.4
Core and Advanced Asset Management
This asset management plan is prepared as a „core‟ asset management plan in accordance with the International Infrastructure Management Manual. It is prepared to meet minimum legislative and organisational requirements for sustainable service delivery and long term financial planning and reporting. Core asset management is a „top down‟ approach where analysis is applied at the „system‟ or „network‟ level.
Future revisions of this asset management plan will move towards „advanced‟ asset management using a „bottom up‟ approach for gathering asset information for individual assets to support the optimisation of activities and programs to meet agreed service levels.
3.
LEVELS OF SERVICE
3.1
Customer Research and Expectations
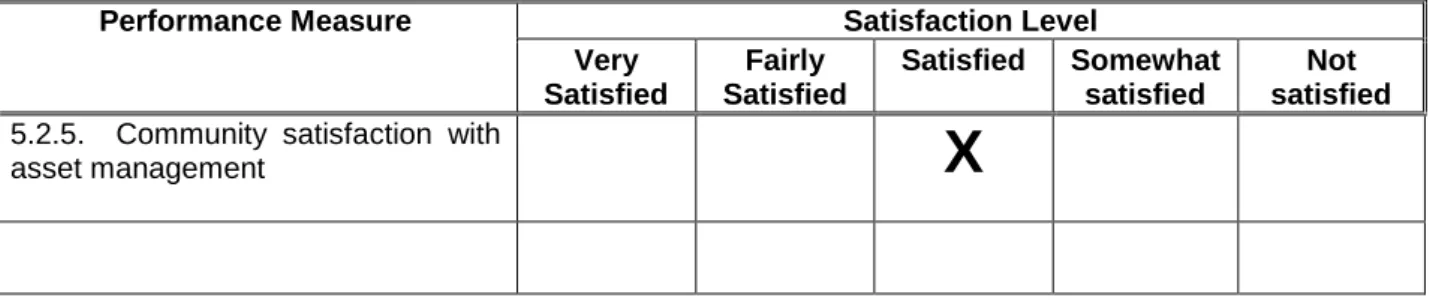
Council participates in the Local Government Association of SA Comparative Performance Measures in Local Government Customer Satisfaction survey. This telephone survey polls a sample of residents on their level of satisfaction with Council‟s services. The most recent customer satisfaction survey reported satisfaction levels for the following services
Table 3.1. Community Satisfaction Survey Levels
Performance Measure Satisfaction Level
Very Satisfied Fairly Satisfied Satisfied Somewhat satisfied Not satisfied 5.2.5. Community satisfaction with
asset management
X
Council uses this information in developing the Strategic Management Plan and in allocation of resources in the budget.
3.2
Legislative Requirements
Council has to meet many legislative requirements including Australian and State legislation and State regulations. These include:
Table 3.2. Legislative Requirements
Legislation Requirement
Legislation Requirement
Local Government Act 1999 Sets out role, purpose, responsibilities and powers of local governments including the preparation of a long term financial plan supported by infrastructure and asset management plans for sustainable service delivery.
Development Act 1993 Have consideration of, adhere to and fulfil the requirements of the Development Act.
Disability Discrimination Act 1992 and other relevant disability legislation
Have consideration of, adhere to and fulfil the requirements of the DDA and other relevant legislation.
Occupational Health & Safety Act 1985
Have consideration of, adhere to and fulfil the requirements of the OH&S Act.
Children‟s Services Act 1996 and Regulations 1998
Have consideration of, adhere to and fulfil the requirements of the Children‟s Services Act and Regulations
3.3
Current Levels of Service
:Council has defined service levels in two terms.
Community Levels of Service relate to how the community receives the service in terms of safety, quality, quantity, reliability, responsiveness, cost/efficiency and legislative compliance.
Supporting the community service levels are operational or technical measures of performance developed to ensure that the minimum community levels of service are met. These technical measures relate to service criteria such as
Service Criteria Technical measures may relate to
Quality Smoothness of roads
Quantity Area of parks per resident
Availability Distance from a dwelling to a sealed road
Safety Number of injury accidents
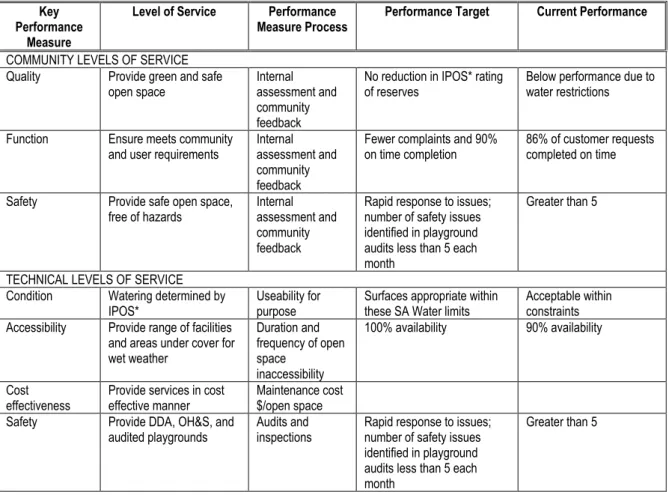
Council‟s current service levels are detailed in Table 3.3.
Table 3.3. Current Service Levels Key
Performance Measure
Level of Service Performance
Measure Process Performance Target Current Performance COMMUNITY LEVELS OF SERVICE
Quality Provide green and safe
open space Internal assessment and community feedback
No reduction in IPOS* rating
of reserves Below performance due to water restrictions
Function Ensure meets community and user requirements
Internal assessment and community feedback
Fewer complaints and 90% on time completion
86% of customer requests completed on time
Safety Provide safe open space,
free of hazards Internal assessment and community feedback
Rapid response to issues; number of safety issues identified in playground audits less than 5 each month
Greater than 5
TECHNICAL LEVELS OF SERVICE Condition Watering determined by
IPOS*
Useability for purpose
Surfaces appropriate within these SA Water limits
Acceptable within constraints Accessibility Provide range of facilities
and areas under cover for wet weather Duration and frequency of open space inaccessibility 100% availability 90% availability Cost
effectiveness Provide services in cost effective manner Maintenance cost $/open space Safety Provide DDA, OH&S, and
audited playgrounds Audits and inspections Rapid response to issues; number of safety issues identified in playground audits less than 5 each month
Greater than 5
The assets covered by this IAMP are covered in four categories: Parks & Reserves, Sporting Reserves, Natural Reserves, and Cemeteries. In addition, the surrounds within the Caravan Park are included for all elements – hard landscaping, fences etc, but excluding soft landscaping (buildings of the Caravan Park are included in the Buildings IAMP). See Section 5.1 or Appendix A for a breakdown of the elements within each asset
3.4
Desired Levels of Service
The “Climate Change - Adaptation Actions for Local Government” Report summarises the potential impacts of climate change on local government functions. For open space infrastructure it notes:
Impacts on coastal recreational infrastructure, Loss of existing public space in coastal areas,
Impacts on tourism/recreation activities along the coast,
Increased costs associated with operation and maintenance costs of public amenities/recreational sites due to storm damage, and
Reduced water quality and quantity resulting in less watering/irrigation or open space and sports grounds and closure of ovals.
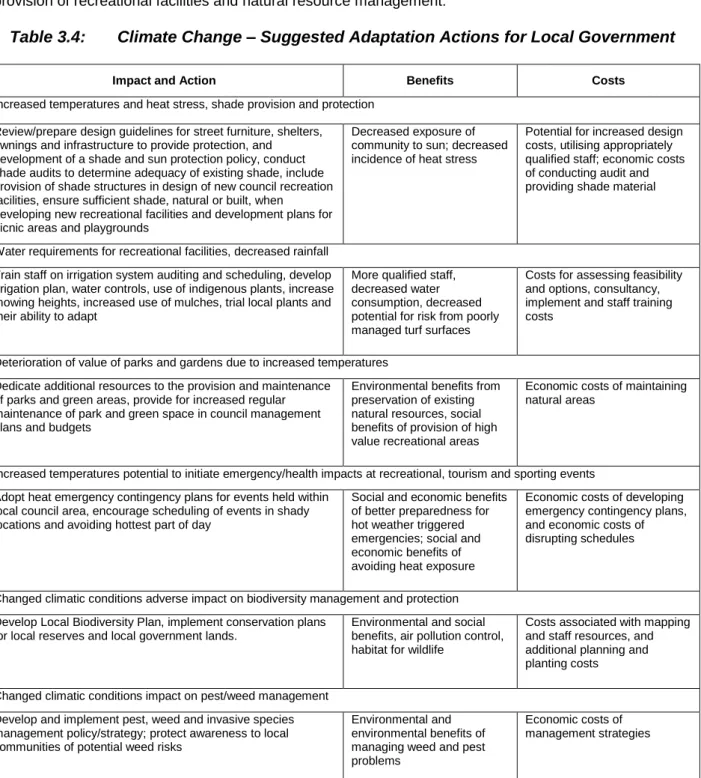
The Report also recommends adaptation options. Table 3.4 discusses those adaptations relevant to provision of recreational facilities and natural resource management:
Table 3.4:
Climate Change – Suggested Adaptation Actions for Local Government
Impact and Action Benefits Costs
Increased temperatures and heat stress, shade provision and protection Review/prepare design guidelines for street furniture, shelters,
awnings and infrastructure to provide protection, and development of a shade and sun protection policy, conduct shade audits to determine adequacy of existing shade, include provision of shade structures in design of new council recreation facilities, ensure sufficient shade, natural or built, when developing new recreational facilities and development plans for picnic areas and playgrounds
Decreased exposure of community to sun; decreased incidence of heat stress
Potential for increased design costs, utilising appropriately qualified staff; economic costs of conducting audit and providing shade material
Water requirements for recreational facilities, decreased rainfall Train staff on irrigation system auditing and scheduling, develop irrigation plan, water controls, use of indigenous plants, increase mowing heights, increased use of mulches, trial local plants and their ability to adapt
More qualified staff, decreased water consumption, decreased potential for risk from poorly managed turf surfaces
Costs for assessing feasibility and options, consultancy, implement and staff training costs
Deterioration of value of parks and gardens due to increased temperatures Dedicate additional resources to the provision and maintenance
of parks and green areas, provide for increased regular maintenance of park and green space in council management plans and budgets
Environmental benefits from preservation of existing natural resources, social benefits of provision of high value recreational areas
Economic costs of maintaining natural areas
Increased temperatures potential to initiate emergency/health impacts at recreational, tourism and sporting events Adopt heat emergency contingency plans for events held within
local council area, encourage scheduling of events in shady locations and avoiding hottest part of day
Social and economic benefits of better preparedness for hot weather triggered emergencies; social and economic benefits of avoiding heat exposure
Economic costs of developing emergency contingency plans, and economic costs of disrupting schedules
Changed climatic conditions adverse impact on biodiversity management and protection Develop Local Biodiversity Plan, implement conservation plans
for local reserves and local government lands.
Environmental and social benefits, air pollution control, habitat for wildlife
Costs associated with mapping and staff resources, and additional planning and planting costs Changed climatic conditions impact on pest/weed management
Develop and implement pest, weed and invasive species management policy/strategy; protect awareness to local communities of potential weed risks
Environmental and environmental benefits of managing weed and pest problems
Economic costs of management strategies
3.4.1 Parks and Reserves
The open reserves network provides an outdoor recreational facility for local communities. These facilities are either:
low profile and situated in close proximity to residents, and may include facilities such as playgrounds, park benches, paths and BBQs,
high profile areas that attract large numbers of people, are sited on major roads and have intensive maintenance regimes applied to them. These open spaces may have playgrounds, toilets, gazebos, picnic tables, paths, and community use tennis courts,
open areas such as Moseley Square, valuable for residents and providing amenity for visitors and tourists, or
low profile areas as utility reserves, such as walkways and closed roads.
Council‟s Open Space Strategy Plan suggests that priority to provide open space facilities be given to areas with a high residential concentration, with priority to provide additional areas that lack an open space within a 400 metre radius of their residence – ie. south east corner of Somerton Ward and south central section of Brighton Ward. However, the provision of open space within the City is relatively fixed due to the built-up nature of the City, the value of land, and typically small allotment spaces available at any one time.
There are 28 playgrounds spread relatively evenly across the Council area, with ease of access for all residents. A review of open space and playground provision in May 2007 identified priorities for installation of new playground equipment; and also identified priorities for major maintenance, renewal and upgrade work.
Turf is managed in accordance with the Code of Practice – Irrigation of Public Open Space, which provides a rating on fit for use purpose which dictates the watering requirements for each reserve. Council is developing a Turf and Irrigation Management Plan which should be finalised in late 2008. Playground maintenance is conducted internally by an accredited fieldstaff member each month. Maintenance of reserves is largely tailored to the profile rating of each reserve.
Council owns and manages 81 Open Reserves, totalling over 400,000m2. This includes local parks (eg. Baddams Green Reserve), regional open space (eg. Angas Neill Park), and utility areas (eg. Fisher Terrace closed road).
3.4.2 Sporting Reserves
Sporting reserves are used for active recreation and sporting activities and often have a sporting or community club based at the reserve. They may offer tennis or netball courts, bowling greens, oval, soccer pitch, athletics track and fencing.
Turf is managed in accordance with the Code of Practice – Irrigation of Public Open Space, which provides a rating on fit for use purpose which dictates the watering requirements for each reserve. All playing surfaces for sporting ovals are assessed regularly both internally and externally to ensure fit for use surfaces are maintained. As seen in the Eastern States the availability of water for irrigation is going to be a major factor in future playing surface condition. Council is developing a Turf and Irrigation Management Plan which should be finalised in late 2008.
These reserves may be a minor revenue source for Council with leases, hire and rent received from sporting clubs.
Council owns and manages 17 sporting reserves, totalling over 252,000 m2.
3.4.3 Natural Reserves
Council has responsibility for four natural reserves remaining within the City of Holdfast Bay. These Natural Reserves are noted for their environmental and conservation significance and feature significant
environmental staff and team of volunteers are dedicated to maintaining the condition of these natural reserves via a program of weeding, mulching, photo point monitoring, and planting of native vegetation. As for all open space, the provision of natural reserves is limited within a built-up urban environment. Council has four registered natural reserves under its care – Barton Avenue Gully, Gilbertson Gully, and the natural area of Kingston Park Coast Reserve which is the Cliff Face and Pine Gully, totalling 88,915m2. Historically, expenditure on these reserves has not been recorded separately. Although there has been investment in Concept Plans for rehabilitation, implementation is limited by adequate resources.
The potential for slippage on the Kingston Park cliff face is increasing due to erosion from greater stormwater runoff, as a consequence of climate change (rainfall intensity) and urban infill. This issue will need to be addressed and funding allocated.
A monthly service provided by generalist contractors has been used which covered weeding, slashing and spraying. This was reviewed in November 2007 and will now be done on a quarterly basis by environmental specialists within the allocated budget constraints. It is anticipated that the service quality will now improve as the relevant Management Plans were not being implemented by the previous contractor
.
3.4.4 Cemeteries
Council is responsible for the management of two public cemeteries – North Brighton and St Judes. Both cemeteries are on Brighton Road. St Judes Cemetery was established in 1854 and has many historically significant burials from the original settlers of Adelaide including arrivals on the HMS Buffalo in 1836; and the grave of Sir Douglas Mawson. North Brighton Cemetery was established in 1863 and also has significant graves such as Sir William Ashton.
Council maintains the grounds and arranges burials, gravesite leases and columbarium niches. Both cemeteries are virtually at capacity for grave sites. Council has agreed a policy of indicating that the lease on a site has expired, but has to-date not acted on this expiry by re-using such sites. North Brighton Cemetery is expected to be at capacity within the next 2-4 years. Columbarium space has been established at both cemeteries. Council sells an average of 20 niches per annum, with the majority at North Brighton Cemetery. Council agreed in October 2007 to the creation of a new Columbarium wall at North Brighton Cemetery, funded through the Cemetery Reserve Fund, which has now been constructed. Council‟s two cemeteries have a total area of 53,260m2. The cemeteries are largely cost neutral, with revenue greater than expenditure on operations and maintenance. A Cemetery Reserve Fund has been established for cemetery maintenance and capital upgrades; as at 1 July 2007 the balance available was $95,996. Since 2002, Council has increased the lease cost for columbarium niches from $670 to $1100. Leases on burial plots have increased from $1045 to $1211 in the same period.
3.5
Desired Levels of Service
At present, indications of desired levels of service are obtained from various sources including the LGASA Customer Satisfaction survey, residents‟ feedback to Councillors and staff, service requests and correspondence. Council has yet to quantify desired levels of service. This will be done in future revisions of this infrastructure and asset management plan.
Future focus on the relationship between Development Standards and Service Standards of our Parks and Reserves will see the creation and implementation of a Hierarchy system which will cost and plan its maintenance and capital needs within a sustainable environment. Refer to the Improvement Plan.
4.
FUTURE DEMAND
4.1
Demand Forecast
Factors affecting demand include population change, changes in demographics, seasonal factors, vehicle ownership, consumer preferences and expectations, economic factors, agricultural practices, environmental awareness, etc.
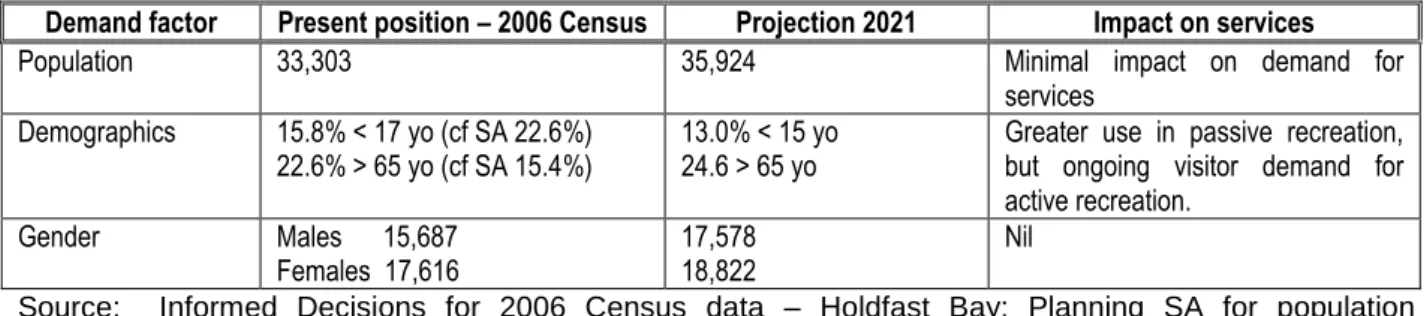
Demand factor trends and impacts on service delivery are summarised in Table 4.1. Table 4.1. Demand Factors, Projections and Impact on Services
Demand factor Present position – 2006 Census Projection 2021 Impact on services
Population 33,303 35,924 Minimal impact on demand for services
Demographics 15.8% < 17 yo (cf SA 22.6%)
22.6% > 65 yo (cf SA 15.4%) 13.0% < 15 yo 24.6 > 65 yo Greater use in passive recreation, but ongoing visitor demand for active recreation. Gender Males 15,687 Females 17,616 17,578 18,822 Nil
Source: Informed Decisions for 2006 Census data – Holdfast Bay; Planning SA for population projections based on medium scenario
Demographic data taken from the Community Services & Facilities study, although only in draft form at this stage highlighted numerous implications for the recreational needs of the City of Holdfast Bay. Our population is anticipated to grow by 7.5% over the next 10 years. With this it is anticipated that people from other council areas will be drawn to CHB and increase the demand for facilities. There will be a need to cater for the projected population growth.
As shown in table 4.1 we have a large and increasing proportion of older people 22.6% with the greater proportion being 80 years or older. If a large proportion of these people live in self sufficient retirement villages and nursing homes the demand for facilities and services could be less. It can be expected however that a greater dependency for home services such as HACC could be expected.
With predominantly 74% of residents being Australian born, our culture would suggest a potential for higher demand for sport and recreation as part of an active and outdoor lifestyle. This however will be less relevant for the oldest age groups.The impact on facilities and services will be tangible and this Asset Plan will consider demand and take action accordingly to ensure development and service standards are appropriately in line with our demographic projections.
4.2
Changes in Technology
Technology changes are forecast to affect the delivery of services covered by this plan in the following areas.
Table 4.2. Changes in Technology and Forecast effect on Service Delivery Technology Change Effect on Service Delivery
Low energy consumption lighting Increased initial outlay but reduced energy consumption Recycling and reuse of water and innovations in soil
wetting Maintenance of reserves during water restrictions, climate change and drought conditions. New more durable materials, eg for playgrounds Reduced maintenance requirements
Alternative surfaces for playing fields and reserves, such
as synthetic or reduced water requirements Reduced watering and maintenance (including mowing), reduced risk exposure and increased amenity. Improved irrigation technology, eg subsurface Reduced water requirements and decreased evaporation. Improved engineering structures, eg playground shade
structures
Reduced risk environment for kids (including from climbing), benefits from UV protection, increased use in hot and wet weather,
4.3
Demand Management Plan
Demand for new services will be managed through a combination of managing existing assets, upgrading of existing assets and providing new assets to meet demand and demand management. Demand management practices include non-asset solutions, insuring against risks and managing failures. Opportunities identified to date for demand management are shown in Table 4.3. Further opportunities will be developed in future revisions of this asset management plan.
Table 4.3. Demand Management Plan Summary
Service Activity Demand Management Plan
Monitor passive use and determine if additional playgrounds are required
Undertake survey on 5 yearly basis on strategic use of reserves to determine usage trends.
Monitor future demand for active services
Undertake survey on 5 yearly basis on strategic use of reserves to determine usage trends.
Conversion of heavily watered grass to alternative / lower maintenance surfaces
Undertake survey on 5 yearly basis on strategic use of reserves to determine usage trends.
Development of Facility standards
Adopt a Hierarchy for Open Space assets and implement facility standards for each asset group
Development of Service Standards
Adopt appropriate service standards to each asset class in accordance with the asset hierarchy class rating.
4.4
New Assets from Growth
The new assets required to meet growth will be acquired from land developments and constructed by Council. The new asset values are summarised in Fig 1.
Fig 1. New Assets from Growth Graph is not available at this time but will be included in future reviews of this Asset Managemnet Plan
Given Council‟s forecast of minimal/static population growth there appears to be no new assets required for growth but the shift in age profile may require some modifications to usage, yet to be identified. Council will need to plan to fund asset improvement for each Hierarchy asset class through the Capital Works Programme to ensure that council approved standards are provided in accordance with pre determined nominated facilities, equipment and auxiliary items.
Acquiring these new assets will commit council to fund ongoing operations and maintenance costs for the period that the service provided from the assets is required. These future costs are identified and considered in developing forecasts of future operating and maintenance costs.
5.
LIFECYCLE MANAGEMENT PLAN
The lifecycle management plan details how Council plans to manage and operate the assets at the agreed levels of service (defined in section 3) while optimising life cycle costs.
5.1
Background Data
5.1.1 Physical parameters
The assets covered by this asset management plan are shown below.
The assets covered by this infrastructure and asset management plan are shown below. Parks & Reserves 83 includes Utility spaces
Sporting Reserves Sixteen Natural Reserves Three Cemeteries Two Caravan Park – open space only
One – a Commercial operation, the buildings of which are addressed in the Buildings IAMP.
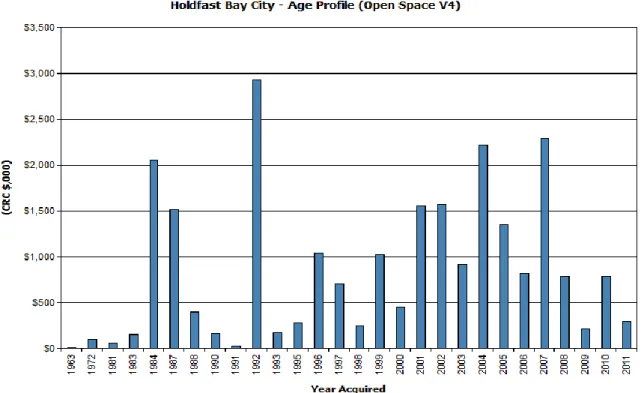
The age profile of Council‟s assets is shown below.
Fig 2. Asset Age Profile
Council owns a variety of open spaces, from the small „pocket‟ parks, local parks with and without playground facilities, utility spaces on the Community Lands Register, major sporting facilities, three remaining natural gullies, and two cemeteries.
Maintaining open space under water restrictions is an ongoing issue, as is management of the natural reserves for the benefit of biodiversity. The most prominent open space is Glenelg Oval, used by the South Australian football code. Council‟s cemeteries are nearing capacity and require active management using a Cemeteries Management Plan. Appendix A provides a complete listing of all assets considered under this IAMP.
For condition assessment, maintenance and replacement purposes, the open spaces have been broken into major elements with averaged useful life, summarised below:
Soft landscaping averaged over 20 year period
Hard landscaping (eg bollards, signs) 27
Playground 20
Lighting 25
Paths, paving, steps & stairs 40
Fencing & gates 40
Irrigation 30
Monuments 100
Council provides an open space network in partnership with the community, stakeholders such as sporting clubs, and other levels of government (where appropriate) such as the NRM Board to enable availability of an appropriate open space network for residents and visitors. The City of Holdfast Bay‟s open space assets consist of major sporting reserves, open reserves (including local parks), natural reserves, and cemeteries. See Appendix A for a comprehensive list of all assets in this category. Note that a separate Infrastructure and Asset Management Plan (IAMP) has been prepared for the Coast – defined as all assets beyond the western footpath of the Esplanade.
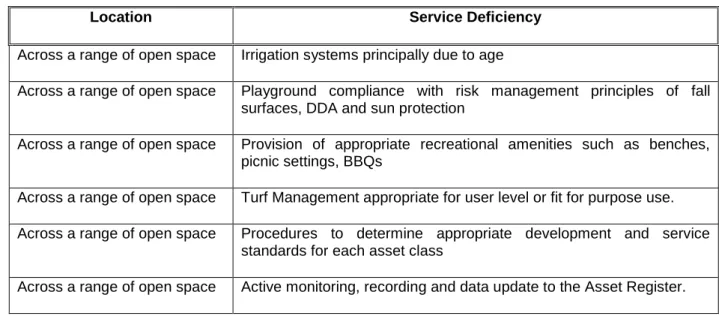
5.1.2 Asset capacity and performance
Council‟s services are generally provided to meet design standards where these are available. Locations where deficiencies in service performance are known are detailed in Table 5.1.2.
Table 5.1.2. Known Service Performance Deficiencies
Location Service Deficiency
Across a range of open space Irrigation systems principally due to age
Across a range of open space Playground compliance with risk management principles of fall surfaces, DDA and sun protection
Across a range of open space Provision of appropriate recreational amenities such as benches, picnic settings, BBQs
Across a range of open space Turf Management appropriate for user level or fit for purpose use. Across a range of open space Procedures to determine appropriate development and service
standards for each asset class
5.1.3 Asset condition
The condition profileof Council‟s assets is shown below.
Fig 3. Asset Condition Profile.
This graph is not available at this time but will be included in future asset plans Condition is measured using a 1 – 5 rating system.2
Rating Description of Condition
1 Excellent condition: Only planned maintenance required.
2 Very good: Minor maintenance required plus planned maintenance. 3 Good: Significant maintenance required.
4 Average: Significant renewal/upgrade required. 5 Poor: Unserviceable.
5.1.4 Asset valuations
The value of assets as at June 2011 covered by this asset management plan is summarised below. Assets were last re-valued at June 2011. Assets are valued at brownfield rates.
Current Replacement Cost $24,189,076
Depreciable Amount $15,628,270
Depreciated Replacement Cost $16,192,314 Annual Depreciation Expense $802,070
Council‟s sustainability reporting reports the rate of annual asset consumption and compares this to asset renewal and asset upgrade and expansion.
Asset Consumption 79%
Asset renewal 3.9%
Annual Upgrade/expansion 0
5.2
Risk Management Plan
An assessment of risks3 associated with service delivery from infrastructure assets has identified critical risks to Council. The risk assessment process identifies credible risks, the likliehood of the risk event occurring, the consequences should the event occur, develops a risk rating, evaluates the risk and develops a risk treatment plan for non-acceptable risks.
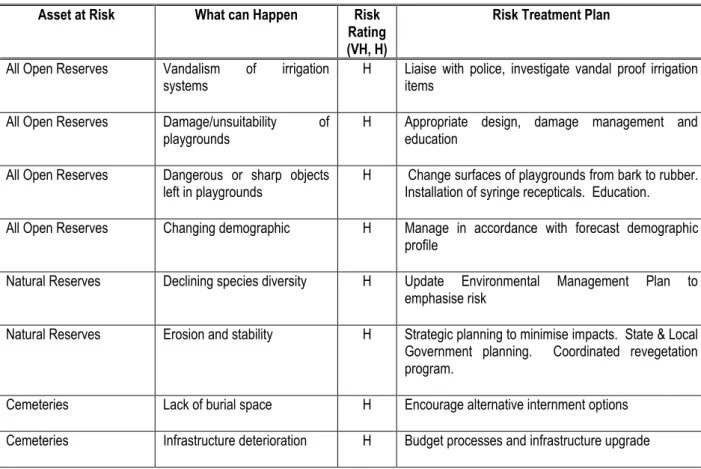
Critical risks, being those assessed as „Very High‟ - requiring immediate corrective action and „High‟ – requiring prioritised corrective action identified in the infrastructure risk management plan are summarised in Table 5.2.
Table 5.2. Critical Risks and Treatment Plans Asset at Risk What can Happen Risk
Rating (VH, H)
Risk Treatment Plan
All Open Reserves Vandalism of irrigation
systems H Liaise with police, investigate vandal proof irrigation items All Open Reserves Damage/unsuitability of
playgrounds
H Appropriate design, damage management and education
All Open Reserves Dangerous or sharp objects
left in playgrounds H Change surfaces of playgrounds from bark to rubber. Installation of syringe recepticals. Education. All Open Reserves Changing demographic H Manage in accordance with forecast demographic
profile
Natural Reserves Declining species diversity H Update Environmental Management Plan to emphasise risk
Natural Reserves Erosion and stability H Strategic planning to minimise impacts. State & Local Government planning. Coordinated revegetation program.
Cemeteries Lack of burial space H Encourage alternative internment options Cemeteries Infrastructure deterioration H Budget processes and infrastructure upgrade
5.3
Routine Maintenance Plan
Routine maintenance is the regular on-going work that is necessary to keep assets operating, including instances where portions of the asset fail and need immediate repair to make the asset operational again. 5.3.1 Maintenance plan
Maintenance includes reactive, planned and cyclic maintenance work activities.
Reactive maintenance is unplanned repair work carried out in response to service requests and management/supervisory directions.
Planned maintenance is repair work that is identified and managed through a maintenance management system (MMS). MMS activities include inspection, assessing the condition against failure/breakdown experience, prioritising, scheduling, actioning the work and reporting what was done to develop a maintenance history and improve maintenance and service delivery performance.
Cyclic maintenance is replacement of higher value components/sub-components of assets that is undertaken on a regular cycle including repainting, building roof replacement, etc. This work generally falls below the capital/maintenance threshold.
This Asset Plan will focus on the determination of actual costs when planning service standards ensuring that cyclic and planned maintenance are common solutions to services. Reactive maintenance will be where possible, only used in urgent risk work necessitating immediate action.
Year Maintenance Expenditure
Reactive Planned Cyclic
2009/10 $1,159,500 $0 $0
20010/11 $1,171,100 $0 $0
2011/12 $309,700 $1,238,800 $619,400
Maintenance expenditure levels are considered to be adequate to meet required service levels. Future revision of this asset management plan will include linking required maintenance expenditures with required service levels.
Assessment and prioritisation of reactive maintenance is undertaken by Council staff using experience and judgement.
5.3.2 Standards and specifications
Maintenance work is carried out in accordance with the following Standards and Specifications. Australian Safety Standards for Playgrounds.
Monthly audits of Sports Grounds using parameters such as Australian Football League, Australian Rugby League, and seasonal needs.
Service demand for mowing.
Safe Operating Procedures under Occupational Health and Safety.
It is recommended that individual master plans for each asset class be developed incorporating procedures, maintenance frequency and service standards.
5.3.3 Summary of future maintenance expenditures
Future maintenance expenditure is forecast to trend in line with the value of the asset stock as shown in Fig 4. Note that all costs are shown in current 2011dollar values.
Fig 4. Planned Maintenance Expenditure
Deferred maintenance, ie works that are identified for maintenance and unable to be funded are to be included in the risk assessment process in the infrastructure risk management plan.
Maintenance is funded from Council‟s operating budget and grants where available. This is further discussed in Section 6.2.
5.4
Renewal/Replacement Plan
Renewal expenditure is major work which does not increase the asset‟s design capacity but restores, rehabilitates, replaces or renews an existing asset to its original service potential. Work over and above restoring an asset to original service potential is upgrade/expansion or new works expenditure.
5.4.1 Renewal plan
Assets requiring renewal are identified from estimates of remaining life obtained from the asset register worksheets on the ‘Planned Expenditure template’. Candidate proposals are inspected to verify accuracy of remaining life estimate and to develop a preliminary renewal estimate. Verified proposals are ranked by priority and available funds and scheduled in future works programmes. The priority ranking criteria is detailed in Table 5.4.1.
Table 5.4.1 Renewal Priority Ranking Criteria
Criteria Weighting
On Attainment of Reaching End of Useful Life 30%
On Estimated Condition Rating 30%
Environmental Considerations 20%
Financial Considerations 20%
Total 100%
Renewal will be undertaken using „low-cost‟ renewal methods where practical. The aim of „low-cost‟ renewals is to restore the service potential or future economic benefits of the asset by renewing the assets at a cost less than replacement cost.
Examples of low cost renewal include re-use of irrigation heads and pipe-work where possible. 5.4.2 Renewal standards
Renewal work is carried out in carried out in accordance with the following Standards and Specifications. Disability Discrimination Act
Playground Safety Standards. Compliance with current regulations Decisions of Elected Members
5.4.3 Summary of future renewal expenditure
Projected future renewal expenditures are forecast to increase over time as the asset stock ages. The costs are summarised in Fig 5. Note that all costs are shown in current 2011 dollar values.