Doctoral Dissertations Student Theses and Dissertations
Fall 2013
Enamel coated steel reinforcement for improved durability and
Enamel coated steel reinforcement for improved durability and
life-cycle performance of concrete structures: microstructure,
life-cycle performance of concrete structures: microstructure,
corrosion, and deterioration
corrosion, and deterioration
Fujian Tang
Follow this and additional works at: https://scholarsmine.mst.edu/doctoral_dissertations
Part of the Civil Engineering Commons
Department: Civil, Architectural and Environmental Engineering Department: Civil, Architectural and Environmental Engineering Recommended Citation
Recommended Citation
Tang, Fujian, "Enamel coated steel reinforcement for improved durability and life-cycle performance of concrete structures: microstructure, corrosion, and deterioration" (2013). Doctoral Dissertations. 1828.
https://scholarsmine.mst.edu/doctoral_dissertations/1828
This thesis is brought to you by Scholars' Mine, a service of the Missouri S&T Library and Learning Resources. This work is protected by U. S. Copyright Law. Unauthorized use including reproduction for redistribution requires the
ENAMEL COATED STEEL REINFORCEMENT FOR IMPROVED DURABILITY AND LIFE-CYCLE PERFORMANCE OF CONCRETE STRUCTURES:
MICROSTRUCTURE, CORROSION, AND DETERIORATION
by
FUJIAN TANG
A DISSERTATION
Presented to the Faculty of the Graduate School of the MISSOURI UNIVERSITY OF SCIENCE AND TECHNOLOGY
In Partial Fulfillment of the Requirements for the Degree
DOCTOR OF PHILOSOPHY in
CIVIL ENGINEERING
2013 Approved by
Dr. Genda Chen, Advisor Dr. Richard K. Brow
Dr. Jeffery S. Volz Dr. Matthew J. O’Keefe
2013 FUJIAN TANG All Rights Reserved
ABSTRACT
This study is aimed (a) to statistically characterize the corrosion-induced deterioration process of reinforced concrete structures (concrete cracking, steel mass loss, and rebar-concrete bond degradation), and (b) to develop and apply three types of enamel-coated steel bars for improved corrosion resistance of the structures. Commercially available pure enamel, mixed enamel with 50% calcium silicate, and double enamel with an inner layer of pure enamel and an outer layer of mixed enamel were considered as various steel coatings. Electrochemical tests were respectively conducted on steel plates, smooth bars embedded in concrete, and deformed bars
with/without concrete cover in 3.5 wt.% NaCl or saturated Ca(OH)2 solution. The effects
of enamel microstructure, coating thickness variation, potential damage, mortar protection, and corrosion environment on corrosion resistance of the steel members were investigated. Extensive test results indicated that corrosion-induced concrete cracking can be divided into four stages that gradually become less correlated with corrosion process over time. The coefficient of variation of crack width increases with the increasing level of corrosion. Corrosion changed the cross section area instead of mechanical properties of steel bars. The bond-slip behavior between the corroded bars and concrete depends on the corrosion level and distribution of corrosion pits. Although it can improve the chemical bond with concrete and steel, the mixed enamel coating is the least corrosion resistant. The double enamel coating provides the most consistent corrosion performance and is thus recommended to coat reinforcing steel bars for concrete structures applied in corrosive environments. Corrosion pits in enamel-coated bars are limited around damage locations.
ACKNOWLEDGMENTS
First and foremost, I would like to express my sincere gratitude to Dr. Genda Chen, for providing continuing support, encouragement and invaluable advice during my study at Missouri University of Science and Technology. I would also like to thank Drs. Richard K. Brow, Jeffery S. Volz, Matthew J. O’Keefe, and Lesley H. Sneed for their time and effort as Ph.D. committee members in reviewing this dissertation and providing constructive review comments.
Financial support for this study was provided in part by the U.S. National Science Foundation under Award No. CMMI-0900159, by the Missouri Department of Transportation under Award No. 28015485-09R000587, and by the Center for Transportation Infrastructure and Safety at Missouri University of Science and Technology under Award No. DTRT06-G-0014. Special thanks are due to Michael L. Koenigstein for coating enamels on steel specimens that are vital to the completion of this study.
I would like to thank the Center for Infrastructure Engineering Studies laboratory technicians Jason Cox and John Bullock, and civil engineering department laboratory technicians Gary Abbott, Scott Parker, and Brian Swift for their assistance during the fabrication and test preparation of various specimens.
Thanks are extended to the Materials Science and Engineering laboratory technicians Eric Bohannan and Clarissa Wisner for their assistance during the characterization of enamel coating using XRD and SEM.
I also appreciate the assistance from my fellow students and friends during various laboratory tests, including Xing Tao, Ying Huang, Xiaoming Cheng, Charles Robert Werner, Zhibin Lin, John A. Cain, Hongya Qu, Yi Bao, Yizheng Chen, and Yan Tang.
Last but not the least, I wishes to express my special and sincere gratitude to my parents, sister, and brother-in-law for their continuous love, understanding and encouragement throughout the Ph.D. study. And I would like to express my sincere gratitude to my aunt Josephine Chain for her care and encouragement during my study in the U.S.
TABLE OF CONTENTS Page ABSTRACT ... iii ACKNOWLEDGMENTS ... iv LIST OF ILLUSTRATIONS ... xi LIST OF TABLES ... xx SECTION 1. INTRODUCTION ... 1
1.1 BACKGROUND, PROBLEM AND JUSTIFICATION ... 1
1.2 LITERATURE REVIEW AND STATE-OF-THE-ART DEVELOPMENT .... 2
1.2.1 Electrochemical Corrosion Test Techniques ... 2
1.2.1.1 Open-circuit potential ...3
1.2.1.2 Linear polarization resistance ...3
1.2.1.3 Transiet technique ...5
1.2.1.4 Electrochemical impedance spectroscopy ...6
1.2.2 Corrosion Prevention Methods ... 8
1.2.2.1 Alternative reinforcement ...9
1.2.2.2 Barrier to choride ingress ...10
1.2.2.3 Corrosion inhibitors...12
1.2.2.4 Cathodic protection ...12
1.2.3 Corrosion-induced Structural Deterioration ... 13
1.2.3.1 Concrete cover cracking ...13
1.2.3.2 Mechanical degradation of corroded rebar ...14
1.2.3.3 Bond degradation due to corrosion ...15
1.3 RESEARCH OBJECTIVES AND SCOPE OF THIS WORK ... 15
1.4 ORGANIZATION OF THIS DISSERTATION ... 16
2. CORROSION-INDUCED CONCRETE COVER CRACKING ... 18
2.1 INTRODUCTION ... 18
2.2 EXPERIMENTAL PROCEDURE ... 19
2.2.2 Accelerated Corrosion Test ... 23
2.2.3 Crcak Width Measurement ... 24
2.3 RESULTS AND DISCUSSION ... 25
2.3.1 Concrete Cracking ... 25
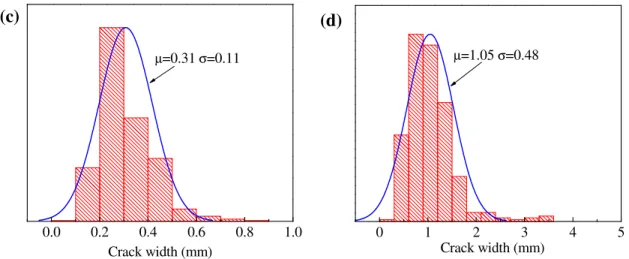
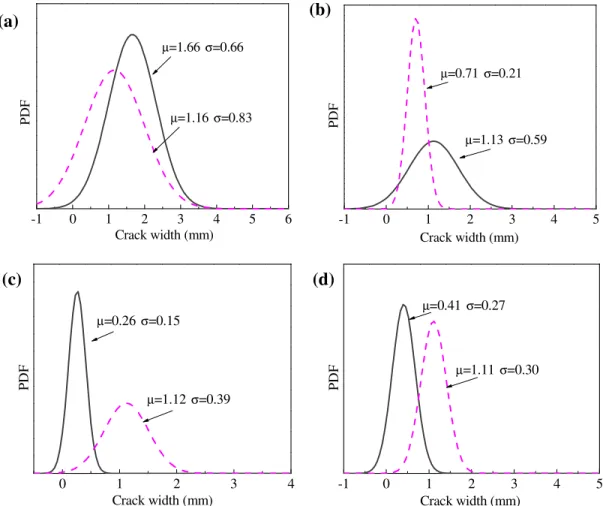
2.3.2 Histograms of Crack Width ... 27
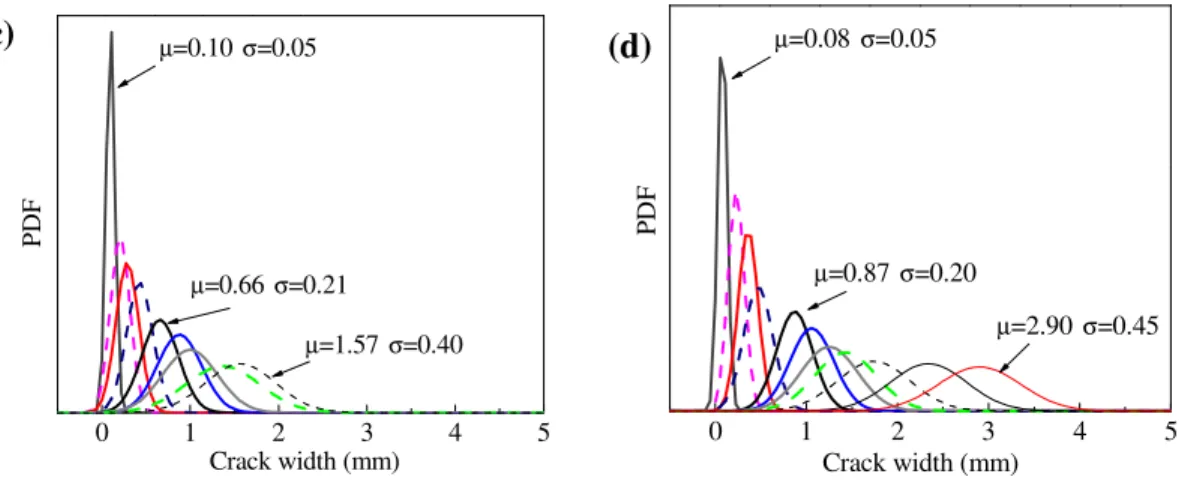
2.3.3 PDF Evolution of Crack Width ... 28
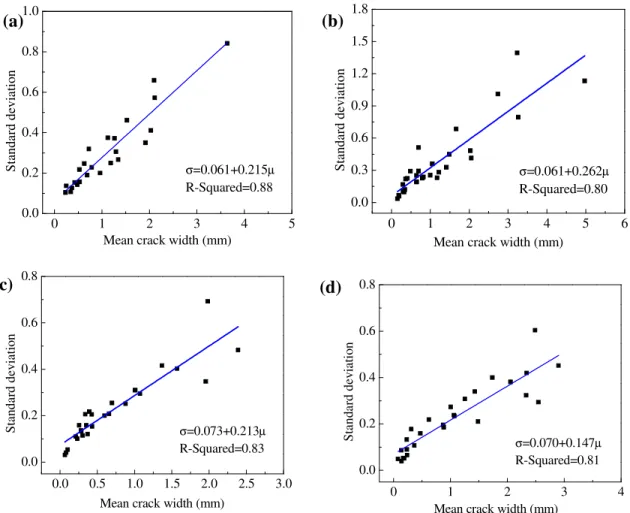
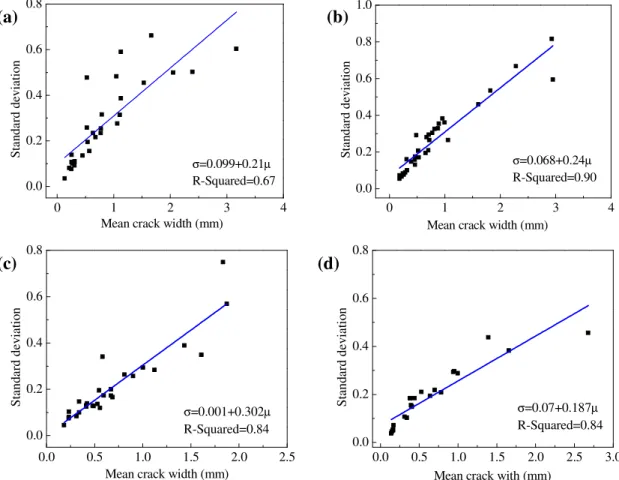
2.3.4 Relationships between Mean Value and Standard Deviation of Crack Width ... 30
2.3.5 Relationship between Crack Width and Corrosion Level ... 31
2.3.6 PDF of Crack Width for Rebar with Two Cracks in the Corner of Specimen ... 34
2.3.7 Crack Propagation Mechanism ... 35
2.4 SUMMARY ... 36
3. MECHANICAL DEGRADATION OF CORRODED STEEL BAR ... 38
3.1 INTRODUCTION ... 38
3.2 EXPERIMENTAL PROCEDURE ... 39
3.2.1 Specimen Preparation ... 39
3.2.2 Accelerated Corrosion Test ... 41
3.2.3 3D Laser Scan ... 42
3.2.4 Tensile Test Setup ... 43
3.3 RESULTS AND DISCUSSION ... 44
3.3.1 Histograms of Cross Sectional Area of Corroded Rebar ... 44
3.3.2 Comparison with Gravimetric Analysis ... 48
3.3.3 Mechanical Property Degradation ... 49
3.3.4 Ductility ... 53
3.3.5 Fracture Cross Section ... 54
3.4 SUMMARY ... 55
4. CORROSION-INDUCED BOND DEGRADATION ... 57
4.1 INTRODUCTION ... 57
4.2 EXPERIMENTAL DETAILS ... 58
4.2.1 Materials and Specimens ... 58
4.2.3 Pull-out Test Setup... 61
4.2.4 3D Laser Scan ... 63
4.2.5 Acoustic Emission Test ... 63
4.3 RESULTS AND DISCUSSION ... 64
4.3.1 Average Bond Loss ... 64
4.3.2 Cross Section of Corroded Rebar ... 65
4.3.3 Crack Pattern and Opening ... 67
4.3.4 Load-slip Curves ... 69
4.3.5 AE Results ... 72
4.3.6 Bond Degradation ... 76
4.3.7 Bond Degradation Mechanism ... 77
4.4 SUMMARY ... 82
5. ELECTROCHEMICAL BEHAVIOR OF ENAMEL COATED CARBON STEEL IN SIMULATED CONCRETE PORE WATER SOLUTION WITH VARIOUS CHLORIDE CONCENTRATIONS ... 84
5.1 INTRODUCTION ... 84
5.2 EXPERIMENTAL ... 86
5.2.1 Preaparation of Enamel Coatings and Test Samples ... 86
5.2.2 Characterization of Enamel Coating ... 88
5.2.3 Pull-off Test ... 88
5.2.4 Electrochemical Tests ... 88
5.3 RESULTS AND DISCUSSION ... 90
5.3.1 Characterization of the Coatings... 90
5.3.1.1 Phase composition ...90
5.3.1.2 Surface, cross-sectional and enamel-steel interfacial morphologies...91
5.3.2 Tensile Strength of Enamel Coatings ... 94
5.3.3 Electrochemial Measurements ... 96
5.3.3.1 Open-circuit potential and corrosion current density ...96
5.3.3.2 EIS tests with plate samples ...97
6. CEMENT-MODIFIED ENAMEL COATING FOR ENHANCED CORROSION
RESISTANCE OF STEEL REINFORCING BARS ... 107
6.1 INTRODUCTION ... 107
6.2 EXPERIMENTAL PROCEDURES ... 108
6.2.1 Preparation of Enamel Coatings and Mortar Cylinders ... 108
6.2.2 Mortar/Steel Interface ... 111
6.2.3 Chloride Measurement ... 111
6.2.4 Electrochemical Measurements ... 112
6.2.5 Visual Observation ... 113
6.3 RESULTS AND DISCUSSION ... 113
6.3.1 Mortar/Steel Interfaces ... 113
6.3.2 Open-circuit Potential, Corrosion Rate and Chloride Profile ... 114
6.3.3 EIS Results ... 117
6.3.4 Visual Observation ... 125
6.4 SUMMARY ... 126
7. CORROSION RESISTANCE AND MECHANISM OF STEEL REBAR COATED WITH THREE TYPES OF ENAMEL ... 127
7.1 INTRODUCTION ... 127
7.2 EXPERIMENTAL DETAILES ... 128
7.2.1 Preparation of Enamel Coatings ... 128
7.2.2 Preparation of the Samples ... 129
7.2.3 Characterization and Barrier Ability of Enamel Coatings ... 131
7.2.4 Electrochemical Studies ... 132
7.3 RESULTS AND DISCUSSION ... 132
7.3.1 Microstructure and Elemental Analysis ... 132
7.3.2 Coating Analysis ... 134
7.3.3 Electrochemical Study ... 136
7.3.3.1 FBE coated steel bar ...136
7.3.3.2 Enamel coated steel bar ...139
7.3.4 Chloride Diffusion through Enamel Coatings ... 146
7.3.5 Mechanism of the Corrosion Resistance of FBE Coating and Three Enamel Coatings ... 147
7.4 SUMMARY ... 149
8. DETERIORATION MECHANISM, DETERIORATION RATE, AND TIME-DEPENDENT EQUIVALENT CIRCUIT REPRESENTATION OF MORTAR-COATING-STEEL SYSTEMS BY EIS ... 151
8.1 INTRODUCTION ... 151
8.2 MATERIAL AND METHODS ... 152
8.2.1 Preparation of Enamel Coating and Cylindrical Specimens ... 152
8.2.2 Microstructurer Examination at Motar-Coating-Steel Interface ... 154
8.2.3 Chloride Profile Analysis... 154
8.2.4 Electrochemical Measurement ... 155
8.2.5 Forensic Study on Tested Specimens ... 155
8.3 RESULTS AND DISCUSSION ... 155
8.3.1 Mortar-Coating-Steel Interfacial Microstructure ... 155
8.3.2 Chloride Profile... 157
8.3.3 Visual Observation ... 158
8.3.4 Electrochemical Testing of Mortar-Coating-Steel Systems ... 161
8.3.4.1 Group A: specimens with UN and ME-coated steel bars ...161
8.3.4.2 Group B: speciemsn with PE- and DE-coated steel bars ...165
8.3.4.2 Group C: speciemens with FBE-coated steel bars ...168
8.3.5 Equivalent Electrical Circuit Representation of Mortar-Coating-Steel Interfaces ... 170
8.3.6 EEC Parameters Evolution ... 172
8.3.6.1 High frequency region (motar cover and coating layer) ...173
8.3.6.2 Intermediate frequency region (passive film) ...184
8.3.6.3 Low frequency region (coating-steel interface) ...186
8.3.6.4 Diffusion behavior...188
8.3.6.5 Non-homogeneities of motar-coating-steel system ...188
8.3.7 Deterioration Mechanism and Rate over Time ... 189
8.3.7.1 Deterioration mechanism ...189
8.3.7.2 Deterioration rates ...191
8.4 SUMMARY ... 194
9.1 MAIN FINDINGS FROM THE OVERALL DISSERTATION WORK ... 196
9.1.1 Corrosion-induced RC Structural Deterioration ... 196
9.1.2 Corrosion Performance of Three Types of Enamel-coated Steel ... 197
9.2 FUTURE WORK ... 198
9.2.1 Effect of Enamel Coating on Concrete Cover Cracking, Steel Rebar Corrosion and Steel-Concrete Bond ... 198
9.2.2 Development of a Reliability-based Durability and Life-cycle Performance Evaluation Framework ... 199
BIBLIOGRAPHY ... 201
LIST OF ILLUSTRATIONS
Figure Page
1.1: Typical potential-time curve as response to a galvanostatic pulse ...6
1.2: Various electrical circuits for steel-concrete systems: (a-1) Randle's circuit, (a-2) modified Randle's circuit, (b-1) resistor-capacitor in series, (b-2) modified resistor-capacitor with diffusion in series, (c-1) resistor-capacitor in mixed mode, (c-2) modified resistor-capacitor with diffusion in mixed mode, (d) and (e) other models ...8
2.1: Side views of large concrete blocks with various concrete cover thicknesses: (a) 25.4 mm, (b) 38.1 mm, (c) 50.8 mm, and (d) 63.5 mm (unit: mm) ...20
2.2: Side views of small concrete blocks with various concrete cover thicknesses: (a) 25.4 mm, (b) 38.1 mm, (c) 50.8 mm, and (d) 63.5 mm (unit: mm) ...21
2.3: Cross section views of concrete blocks with various concrete cover thicknesses: (a) 25.4 mm, (b) 38.1 mm, (c) 50.8 mm, and (d) 63.5 mm (unit: mm) ...21
2.4: Details of short steel bars (a-1, a-2) and long steel bars (b-1, b-2) (unit: mm) ...22
2.5: Plywood mold for: (a) small concrete block, and (b) large concret block ...23
2.6: Accelerated corrosion test: (a) corrosion bath, and (b) test setup ...24
2.7: Typical corrosion-induced cracks on the concret surface with a crack meter ...25
2.8: Representative concrete cover cracking: (a) near the side steel bar, and (b) near the corner steel bar ...25
2.9: Cracks on the side of (a) small concrete block, and (b) large concrete block after corrosion tests ...26
2.10: Cracks underneath concrete cover: (a) hairline crack width on concrete surface, and (b) no crack on concrete surface ...27
2.11: Typical histograms of crack width and fitting pdf curves for: (a)(b) for small specimens, and (c)(d) for larger specimens ...27
2.12: PDF evolution of crack width on small specimens with various cover thicknesses: (a) 25.4 mm, (b) 38.1 mm, (c) 50.8 mm, and (d) 63.5 mm ...28
2.13: PDF evolution of crack width on large specimens with various cover
thicknesses: (a) 25.4 mm, (b) 38.1 mm, (c) 50.8 mm, and (d) 63.5 mm ...29
2.14: Relations between mean value and standard deviation of crack width on small specimens with various cover thicknesses: (a) 25.4 mm, (b) 38.1 mm, (c) 50.8 mm, and (d) 63.5 mm ...30
2.15: Relations between mean value and standard deviation of crack width on large specimens with various cover thicknesses: (a) 25.4 mm, (b) 38.1 mm, (c) 50.8 mm, and (d) 63.5 mm ...31
2.16: Relations between mean crack width and the mean mass loss of steel bars for small specimens with various cover thicknesses: (a) 25.4 mm, (b) 38.1 mm, (c) 50.8 mm, and (d) 63.5 mm ...32
2.17: Relations between mean crack width and the mean mass loss of steel bars for large specimens with various cover thicknesses: (a) 25.4 mm, (b) 38.1 mm, (c) 50.8 mm, and (d) 63.5 mm ...33
2.18: Representative PDF curves of cracks around corner steel bars in the large concrete block with 25.4 mm cover thickness: (a) corner 1, (b) corner 2, (c) corner 3, and (d) corner 4 ...34
2.19: Schematic illustration of corrosion-induced concrete cracking as a fucntion of corrosion level or time ...35
2.20: Schematic diagram of crack width development ...35
3.1: Dimensions of concrete block specimen (unit: mm) ...40
3.2: Details of steel bar (unit: mm) ...40
3.3: Mold to cast concrete block ...41
3.4: Accelerated corrosion test setup: (a) corrosion bath, (b) electrical circuit to accelerate corrosion ...42
3.5: 3D laser scanning of deformed steel bar. ...43
3.6: Tension tests: (a) setup, (b) two steel collars mounted on steel bar ...44
3.7: 3D images of: (a) uncorroded, (b) relatively uniformly corroded, and (c) relatively non-uniformly corroded steel bar ...45
3.8: Distribution of cross sectional area along the rebar length of: (a) uncorroded, (b) almost uniformly corroded, and (c) non-uniformly corroded steel bar ...45
3.9: Histograms of: (a) the uncorroded, (b) almost uniformly corroded, and (c)
non-uniformly corroded steel bar ...46
3.10: Cross sections of (a-1, a-2, a-3) for the uncorroded, (b-1, b-2, b-3) for almost uniformly corroded, and (c-1, c-2, c-3) for non-uniformly corroded steel bar (unit: mm) ...47
3.11: PDF curves of the residual cross section area of corroded steel bar as a function of corrosion area loss ...48
3.12: Correlation between the area loss and mass loss ...49
3.13: Load-slip curves of the uncorroded and corroded steel bars ...50
3.14: Yield load (a) and ultimate load (b) as a function of area loss ...51
3.15: Yield strength (a) and ultimate strength (b) as a function of corrosion area loss ...53
3.16: Elongation of steel bars as a function of area loss ...54
3.17: Fracture cross sections of (a) uncorroded and (b) corroded steel bars after tensile tests ...55
4.1: Pull-out test specimen dimensions (unit: mm) ...59
4.2: Plywood mold for pull-out specimen casting ...60
4.3: Accelerated corrosion test setup ...61
4.4: Pull-out test setup: (a) specimen during testing, (b) schematic view of specimen, (c) two DCVTs mounted on the top of specimen, and (d) strain pot for deformation recording ...62
4.5: 3D laser scanning of the deformed steel bar ...63
4.6: Layout of AE sensors (unit: mm) ...64
4.7: Scanned surface profiles of (a) uncorroded, (b) corroded bar #2, (c) corroded bar #3, and (d) corroded bar #10 ...65
4.8: Histograms of the cross section of corroded bars for (a) uncorroded, (b) corroded bar #2, (c) corroded bar #3, and (d) corroded bar #10 ...66
4.9: Representative corrosion-induced cracking: (a) one small crack through the concrete cover, (b) two cracks through the two side faces, (c) two cracks with one through the concrete cover and the other through one side, and (d) three cracks through both the concrete cover and two side faces ...67
4.10: Cracking initiation and propagation of the concrete block with corroded bar under applied loads from: (1) 0 kN through (3) 69.8 kN to (15) 29.8 kN ...68 4.11: Cracking widening of corroded specimen#7 at loads from (1) 0 kN through
(9) 60.8 kN to (15) 16.9 kN ...69 4.12: Representative curves of (a) deformation in the rubber layer, (b)
load-strain in the steel bar, and (c) load-slip ...70 4.13: Bond stress-slip curves of all specimens: (a) speciemens with uncorroded
steel bar, (b) specimens with less crack, and (c) specimens with more cracks ...72 4.14: Acoustic energy spectra of various specimens ...74 4.15: Relationships between (a) maximum bond stress and corrosion level, and
(b) maximum bond stress and crack width ...76 4.16: Effects of steel bar corrosion on: (a) top-bottom slip difference, (b) average
crack width. ...77 4.17: Bond-slip curves for: (a) specimen with uncorroded steel bar, (b) specimen
with slighlty corroded steel bar concentrated at lugs, (c) specimens with slighly corroded steel bar concentrated at ribs, and (d) specimens with
severe corroded steel bar ...78 4.18: Visual observation of steel-concrete interfaces after pull-out tests: (1)
concrete interface, (2) steel bar surface; (a) uncorroded specimen, (b) slightly corroded specimen on ribs, (c) slightly corroded specimen on lugs, and (d) severely corroded specimen ...79 4.19: Bond degradation mechanisms for specimens with: (a) uncorroded steel
bar, (b) slighlty corroded steel bar concentrated at lugs, (c) slighly corroded steel bar concentrated at ribs, and (d) severely corroded steel bar ...81 5.1: Schematic view of the steel plate sample used in the electrochemical
experiment (unit: mm) ...87 5.2: XRD patterns for: (a) ordinary Portland cement, (b) PE, (c) ME, and (d)
DE coatings ...90 5.3: SEM images for (a) surface and (2) cross-sectional morphologies of: (a)
PE, (b) ME, and (c) DE coating ...92 5.4: SEM images for (1) cross section and (2) steel-enamel interface of (a) PE,
5.5: Optical micrographs of the fracture interface after pull-off tests at (1) low magnification and (2) high magnification of (a) PE, (b) ME, and (c)DE coated steel plates. ...95 5.6: Changes of (a) open circuit potential, and (b) corrosion current density of
various steel plate samples in the saturated Ca(OH)2 solution with defferent
chloride concentrations ...97 5.7: Representative EIS diagrams: (1) Nyquist plot and (2) Bode plot for (a)
uncoated, (b) PE coated, (c) ME coated, and (d) DE coated steel plates in
the saturated Ca(OH)2 solution with defferent chloride concentrations ...99
5.8: Equivalent electrical circuits for: (a) PE coated samples, and (b) uncoated, ME and DE coated samples ...101
5.9: Comparison of coating properties: (a) coating resistance Rc, (b) coating
capacitance Cc, and (c) nc ...103 5.10: Comparison of steel-solution interfacial parameters: (a) charge transfer
resistance Rct, (b) double layer capacitance Cdl, and (c) ndl ...104 6.1: Mortar cylinder specimens: (a) geometries (unit: mm), (b) groove precut on
plywood, and (c) PVC mold for casting ...111 6.2: Locations of mortar powder samples for chloride content analysis (unit:
mm) ...112 6.3: Cross sectional SEM images of the interface between mortar and steel rebar
for: (a) uncoated, (b) pure enamel coated, (c) mixed enamel coated, and (d) double enamel coated. ...114 6.4: Open-circuit potential evolution with time for mortar cylinders reinforced
with uncoated and three types of enamel coated rebar in 3.5 wt. % NaCl solution ...115 6.5: Corrosion current density evolution with time for mortar cylinders
reinforced with uncoated and three types of enamel coated rebar in 3.5 wt. % NaCl solution. ...116 6.6: Chloride distribution in mortar with time in 3.5 wt. % NaCl solution ...117 6.7: Typical EIS diagrams of mortar cylinders in 3.5 wt. % NaCl solution with:
(a) uncoated, (b) pure enamel, (c) mixed enamel, and (d) double enamel coated steel rebar in the format of Nyquits plots (1), and Bode plots (2) & (3) ...119
6.8: Equivalent electrical circuit for mortar cylinders with: (a) pure enamel and doubl enamel coated steel rebar, and (b) uncoated and mixed enamel coated steel rebar ...120 6.9: Impedance spectrum and fitting results for: (a) uncoated, (2) pure enamel,
(c) mixed enamel, and (d) double enamel coated steel rebar after 116 days of immersion in 3.5 wt. % NaCl solution ...121 6.10: Surface conditions of (a) uncoated, (2) pure enamel, (c) mixed enamel, and
(d) double enamel coated steel rebar embedded in mortar after 173 days of
immersion in 3.5 wt. % NaCl solution ...125 7.1: Geometry of rebar samples (unit: mm) ...130 7.2: Steel rebar samples tested in this study: (a) uncoated rebar, (b-1, b-2) FBE
coated rebar without and with impact points, (c-1, c-2) pure enamel coated rebar without and with impact points, (d-1, d-2) mixed enamel coated rebar without and with impact points, and (e-1, e-2) double enamel coated rebar without and with impact points ...131 7.3: Cross sectional SEM images and EDS analysis before corrosion tests: (a-1,
a-2) uncoated rebar, (b-1, b-2) pure enamel coated rebar, (c-1, c-2) mixed enamel coated rebar, and (d-1, d-2) doubl enamel coated rebar ...134 7.4: XRD patterns on the surface of steel rebar before and after immersion tests
in 3.5 wt.% NaCl solutions: (a-1, a-2) uncoated rebar, (b-1, b-2) pure enamel coated rebar, (c-1, c-2) mixed enamel coated rebar, and (d-1, d-2) doubl enamel coated rebar ...135 7.5: EIS test results of FBE coated steel rebar in Bode format: (a) modulus, and
(b) phase angle.. ...136 7.6: EEC model for FBE coated rebar: (a) without impact points, and (b) with
impact points ...138
7.7: Fitted parameters of FBE coated rebar: (a) charge transfer resistance Rct, (b)
double layer capacitance Cdl, and (c) CPEdl exponent ndl ...139 7.8: EIS test result in Bode format for: (a-1, a-2) uncoated rebar, (b-1, b-2) pure
enamel coated rebar, (c-1, c-2) mixed enamel coated rebar, and (d-1, d-2) doubl enamel coated rebar ...140
7.9: Property of intact enamel coatings and mill scale: (a) coating resistance Rc,
(b) coating capacitance Cc, and (c) CPEc exponent nc ...142
7.10: Sensitivity of coating properties to impact points: (a) coating resistance Rc,
7.11: Coating behavior of three enamel coated sampels versus uncoated sampels:
(a) charge transfer resistance Rct, (b) double layer capacitance Cdl, and (c)
CPEdl exponent ndl ...144 7.12: Sensitivity of corrosion behavior of enamel coated sampels to impact
points: (a) charge transfer resistance Rct, (b) double layer capacitance Cdl, and (c) CPEdl exponent ndl ...145 7.13: Elemental distribution maps of electrochemical tested samples: (a)
uncoated rebar, (b) pure enamel coated rebar, (c) mixed enamel coated rebar, and (d) double enamle coated rebar ...146 7.14: Schemes of corrosion process of FBE and enamel coatings: (a) FBE
coating (intact & damaged), (b) pure enamel coating(intact & damaged), (c) mixed enamel coating (intact & damaged), and (d) double enamel coating (intact & damaged) ...148 7.15: Supporting evidence of corrosion mechanisms: (a) damaged FBE coating,
and (b) damaged enamel coating ...149 8.1: Geometry of rebar sample (unit: mm) ...153 8.2: SEM images of interfaces for (a) uncoated, (b) pure enamel, (c) mixed
enamel, (d) double enamel, and (e) FBE-coated steel bars ...156 8.3: Chloride profiles for (a) w/c=0.40 and continuous immersion in 3.5 wt. %
NaCl solution, (b) w/c=0.40 and bi-weekly wet-dry cycles, (c) w/c=0.55 and continuous immersion in 3.5 wt. % NaCl solution, and (d) w/c=0.55 and bi-weekly wet-dry cycles ...158 8.4: Optical images of the surface conditions of 244-day tested samples with (1)
uncoated, (2) pure enamel, (3) mixed enamel, (4) double enamel, and (5) FBE-coated steel bar for (a) w/c=0.40 and continuous immersion in 3.5 wt. % NaCl solution, (b) w/c=0.40 and bi-weekly wet-dry cycles, (c) w/c=0.55 and continuous immersion in 3.5 wt. % NaCl solution, and (d) w/c=0.55 and bi-weekly wet-dry cycles ...159 8.5: Representative Bode plots of mortar cylinders with uncoated steel bars for
(a) w/c=0.40 and continuous immersion in 3.5 wt. % NaCl solution, (b) w/c=0.40 and bi-weekly wet-dry cycles, (c) w/c=0.55 and continuous immersion in 3.5 wt. % NaCl solution, and (d) w/c=0.55 and bi-weekly wet-dry cycles. ...163 8.6: Representative Bode plots of mortar cylinders with pure enamel coated
steel bars for (a) w/c=0.40 and continuous immersion in 3.5 wt. % NaCl solution, (b) w/c=0.40 and bi-weekly wet-dry cycles, (c) w/c=0.55 and continuous immersion in 3.5 wt. % NaCl solution, and (d) w/c=0.55 and
bi-8.7: Representative Bode plots of mortar cylinders with mixed enamel coated steel bars for (a) w/c=0.40 and continuous immersion in 3.5 wt. % NaCl solution, (b) w/c=0.40 and bi-weekly wet-dry cycles, (c) w/c=0.55 and continuous immersion in 3.5 wt. % NaCl solution, and (d) w/c=0.55 and
bi-weekly wet-dry cycles ...166 8.8: Representative Bode plots of mortar cylinders with double enamel coated
steel bars for (a) w/c=0.40 and continuous immersion in 3.5 wt. % NaCl solution, (b) w/c=0.40 and bi-weekly wet-dry cycles, (c) w/c=0.55 and continuous immersion in 3.5 wt. % NaCl solution, and (d) w/c=0.55 and
bi-weekly wet-dry cycles ...167 8.9: Representative Bode plots of mortar cylinders with FBE coated steel bars
for (a) w/c=0.40 and continuous immersion in 3.5 wt. % NaCl solution, (b) w/c=0.40 and bi-weekly wet-dry cycles, (c) w/c=0.55 and continuous immersion in 3.5 wt. % NaCl solution, and (d) w/c=0.55 and bi-weekly wet-dry cycles ...169 8.10: Equivalent electrical circuits for motar cylinders with (a) uncoated and
mixed enamel coated steel bar, (b) pure enamel and double enamel coated steel bars, and (c) FBE-coated steel bars ...172 8.11: Measured versus simulated Bode plots of mortar cylinders with uncoated
steel bars for (a) w/c=0.40 and continuous immersion in 3.5 wt. % NaCl solution, (b) w/c=0.40 and bi-weekly wet-dry cycles, (c) w/c=0.55 and continuous immersion in 3.5 wt. % NaCl solution, and (d) w/c=0.55 and
bi-weekly wet-dry cycles at (1) 1 day, (2) 124 days, and (3) 244 days test ...174 8.12: Measured versus simulated Bode plots of mortar cylinders with pure
enamel coated steel bars for (a) w/c=0.40 and continuous immersion in 3.5 wt. % NaCl solution, (b) w/c=0.40 and bi-weekly wet-dry cycles, (c) w/c=0.55 and continuous immersion in 3.5 wt. % NaCl solution, and (d) w/c=0.55 and bi-weekly wet-dry cycles at (1) 1 day, (2) 124 days, and (3) 244 days test ...175 8.13: Measured versus simulated Bode plots of mortar cylinders with mixed
enamel coated steel bars for (a) w/c=0.40 and continuous immersion in 3.5 wt. % NaCl solution, (b) w/c=0.40 and bi-weekly wet-dry cycles, (c) w/c=0.55 and continuous immersion in 3.5 wt. % NaCl solution, and (d) w/c=0.55 and bi-weekly wet-dry cycles at (1) 1 day, (2) 124 days, and (3) 244 days test ...176 8.14: Measured versus simulated Bode plots of mortar cylinders with double
enamel coated steel bars for (a) w/c=0.40 and continuous immersion in 3.5 wt. % NaCl solution, (b) w/c=0.40 and bi-weekly wet-dry cycles, (c) w/c=0.55 and continuous immersion in 3.5 wt. % NaCl solution, and (d)
w/c=0.55 and bi-weekly wet-dry cycles at (1) 1 day, (2) 124 days, and (3) 244 days test ...177 8.15: Measured versus simulated Bode plots of mortar cylinders with
FBE-coated steel bars for (a) w/c=0.40 and continuous immersion in 3.5 wt. % NaCl solution, (b) w/c=0.40 and bi-weekly wet-dry cycles, (c) w/c=0.55 and continuous immersion in 3.5 wt. % NaCl solution, and (d) w/c=0.55 and bi-weekly wet-dry cycles at (1) 1 day, (2) 124 days, and (3) 244 days test ...178 8.16: Schemes of deterioration processes of mortar with: (a) uncoated, (b) pure
enamle coated, (c) mixed enamel coated, (d) double enamel coated, and (e) FBE-coated steel bar ...190 8.17: Evoluation of charge transfer resistance of motar with: (a) uncoated, (b)
pure enamle coated, (c) mixed enamel coated, (d) double enamel coated, and (e) FBE-coated steel bar. (Note: 40WW---w/c=0.40, in 3.5 wt.% NaCl solution; 40WD---w/c=0.40, weekly wet-dry cycles; 55WW---w/c=0.55, in 3.5 wt.% NaCl solution; 55WD---w/c=0.55, weekly wet-dry cycles;) ...192
LIST OF TABLES
Table Page
1.1: Corrosion condition related with half-cell potential measurement ...3 1.2: Corrostion rate vs. condition of reinforcement steel ...5 2.1: Chemical composition of steel rebar ...19 2.2: Chemical composition of Type-I Portland Cement (wt. %) ...22 3.1: Chemical composition of steel rebar ...39 3.2: Chemical composition of Type-I Portland Cement (wt. %). ...41 4.1: Chemical composition of steel rebar ...58 4.2: Chemical composition of Type-I Portland Cement (wt. %) ...58 4.3: Crack width before pull-out tests ...68 4.4: Frequencies idenfied at stages I and III (kHz) ...75 5.1: Chemical composition of alkali borosilicate glass frits ...86 5.2: Cohesive strength of various enamel coatings ...95 6.1: Chemical composition of alkali borosilicate glass frits ...109 6.2: Chemical composition of steel rebar ...110 6.3: Chemical composition of Type-I Portland Cement (wt. %) ...110 6.4: EEC model (b) parameters for mortar cylinders with uncoated and mixed
enamel coated steel rebar in 3.5 wt.% NaCl solution ...122 6.5: EEC model (a) parameters for mortar cylinders with pure enamel and
double enamel coated steel rebar in 3.5 wt.% NaCl solution ...123 7.1: Chemical composition of alkali borosilicate glass frits ...128 7.2: Chemical composition of steel rebar ...129 7.3: Test matrix: 39 samples total ...131 8.1: Mortar matrix proportions ...153
8.2: Mortar cylinders with uncoated steel bars ...179 8.3: Mortar cylinders with pure enamel coated steel bars ...180 8.4: Mortar cylinders with mixed enamel steel bars ...181 8.5: Mortar cylinders with double enamel steel bars ...182 8.6: Mortar cylinders with FBE-coated steel bars ...183 8.7: Normalized average deterioration rates in stage II according to coating
types ...193 8.8: Normalized average deterioration rates in stage II according to corrosion
1. INTRODUCTION
1.1 BACKGROUND, PROBLEM AND JUSTIFICATION
Corrosion has resulted in a significant financial burden to the U.S. Department of Transportation. According to the 2002 study by Federal Highway Administration [1], the total cost to combat corrosion had been approximately $276 billion annually or 3.1% of the nation’s Gross Domestic Product (GDP). Over the following 10 years, the direct corrosion cost for highway bridges was estimated to be $8.3 billion per year, including $3.8 billion for replacement of deficient bridges, $2 billion for maintenance and capital cost of concrete bridge decks, $2 billion for maintenance and capital cost of concrete substructures, and $0.5 billion for maintenance painting of steel bridges. The indirect cost such as traffic delay and lost productivity was estimated to be as high as 10 times the direct cost. According to the 2009 American Society of Civil Engineers Report Card for America’s Infrastructure, more than 26% of the nation’s bridges are either structurally deficient or functionally obsolete, and a $17 billion annual investment is needed to substantially improve the current bridge conditions [2]. By 2012, the total cost for corrosion-induced maintenance and replacement has exceeded $ 1 trillion in the U.S., and the annual cost to the U.S. Department of Defense (DOD) has been estimated to be $ 20.9 billion [3].
Corrosion in transportation infrastructure is not only the main reason for substantial financial costs, but also a matter of public safety and commuter inconvenience when not assessed and mitigated in time. As an example, the I-35W Bridge over the Mississippi River in Minneapolis collapsed on August 1, 2007, killing 13 people. The National Transportation Safety Board discovered that cracks occurred along corroded gusset plates on the failed bridge. Although the root cause for the bridge collapse was due to the under designed gusset plate [4], corrosion was also observed on the approximately 50-years old bridge. On October 22, 2010, the City of Minneapolis closed another bridge (Plymouth Avenue Bridge) over the Mississippi River because serious corrosion was observed in at least five of the post-tensioned tendons in the bridge’s center span. Closure
of bridges for corrosion-induced inspection and maintenance forces vehicles to detour, increasing commuting time and thus gas consumption and greenhouse gas emission.
Porcelain enamel is typically a silicate-based material that is deposited from slurries and fused at high temperature. It has many advantages as follows. First, enamel has very stable chemical properties in harsh environments such as high temperature, acid and alkaline. Therefore, it can protect reinforced concrete (RC) structures located in any environment. Second, the properties of enamel are flexible and can be tailored for various applications by regulating the chemical composition of enamel and/or pre-treating the metal substrate to be coated. For example, replacing B2O3 with SiO2/TiO2 can increase
the corrosion resistance of enamel in acidic environments; adding ZrO2 can improve the
performance of enamel in alkaline environments. Third, an enamel coating can establish a physical barrier between steel rebar and its surrounding concrete, delaying the penetration of aggressive chloride ions and thus prolonging the service life of RC structures. Lastly, enamel with cement additives is fused on a steel substrate at high temperature to establish a chemical bond with the steel and concrete when applied to RC structures, which is important for the long-term performance of structures. The main disadvantage of enamel coating is its brittleness and can potentially damage during shipping and transportation, though its impact in applications can be minimized through precast constructions. Overall, enamel coating can be an alternative method to protect steel from corrosion.
1.2 LITERATURE REVIEW ON STATE-OF-THE-ART DEVELOPMENT
1.2.1 Electrochemical Corrosion Test Techniques. A number of test methods and techniques to detect and measure reinforcement steel corrosion have been developed in the past [5]. They can be divided into two groups: electrochemical and non-destructive. For example, the electrochemical methods include the open-circuit potential measurement, linear polarization resistance (LPR) measurement, galvanostatic pulse transient response, and electrochemical impedance spectroscopy (EIS). The non-destructive techniques include the concrete cover thickness measurement, ultrasonic pulse velocity measurement, and x-ray and Gamma radiography measurements. Following is a detail review of the four frequently-used electrochemical techniques.
1.2.1.1 Open-circuit potential. The open-circuit potential (also referred to as half-cell potential) measurement has been widely used to assess reinforcement steel corrosion in concrete due to its simplicity and cost effectiveness. This method often provides the probability of corrosion activity through a measurement of potential differences among a standard portable reference electrode, a copper/copper sulphate electrode (CSE), and a reinforcing steel electrode. ASTM standard C876 [6] provides the general guidelines for the corrosion evaluation of RC structures based on the potential thresholds as summarized in Table 1.1.
Table 1.1 Corrosion condition related with half-cell potential measurement [6]
Corrosion potential vs. CSE Corrosion activity
Less negative than -0.2 V 90% probability of no corrosion
Between -0.2 and -0.35 V Corrosion activity is uncertain
More negative than -0.35 V 90% probability of corrosion
However, the above potential measurement method has some drawbacks. The potential mapping on existing structures require careful interpretation because many factors can affect the corrosion potential measurement [7], such as oxygen and chloride concentration, concrete resistivity [8], use of corrosion inhibitors, epoxy-coated or galvanized reinforcing steel, presence of stray currents [9], carbonated concrete [10], and presence of concrete cracks [11]. Therefore, evaluation on the reinforcement steel corrosion based on the half-cell potential measurement alone may mislead engineers and cause errors in their judgment if these factors are not taken into account. It must be stressed that this method just evaluates the probability of corrosion activity at a given location and time, long-term monitoring of the half-cell potential in combination with other techniques is more meaningful.
1.2.1.2 Linear polarization resistance. The most extensively used method to evaluate rebar corrosion rates in concrete is the LPR measurement. This technique is rapid and non-destructive; it only requires a connection to the reinforcing steel under investigation. The data provides a valuable insight into the instantaneous corrosion rate of
steel reinforcement, thus giving more detailed information than the hall-cell potential measurement. For each LPR measurement, the reinforcing steel is perturbed by a small electrical signal from its equilibrium potential. This can be accomplished potentiostatically by changing the potential applied to the reinforcing steel by a fixed
amount ∆V and then monitoring the current decay, ∆I, after a given time or vice versa. In
either case, the test conditions are selected such that the variation in potential, ∆V, falls
within the linear Stern-Geary range of 10-30 mV. The polarization resistance
representing the slope of a polarization curve, Rp, can be calculated by:
/ p
R = ∆V ∆I (1.1)
where ∆V and ∆I represent the potential and current increments, respectively, in the
linear portion of a polarization curve at I=0. LPR measurements were used to calculate
the corrosion current density by the Stern-Geary equation [12]:
/ [2.303( ) ] /
corr a c a c p p
i =
β β
β
+β
R =B R (1.2)where icorr is the corrosion current density, βa is the anodic Tafel slope, βc is the cathodic
Tafel slope, and B is a constant related to βa and βc.
However, there are still some difficulties associated with this technique. It is often difficult to determine the Tafel slopes when the steel surface is in passive state. As a result, the B value estimated from Eq. (1.2) is likely inaccurate or very sensitive to the change in steel surface condition. Furthermore, some requirements must be met during each test. For example, the electrochemical current at the fixed potential should remain constant during the entire polarization period and uniform along the length of a steel bar. The effect of the high electrical resistance of concrete should be properly taken into account.
In order to meet the above two requirements, an outer auxiliary guard ring electrode has been placed around the inner auxiliary electrode. The outer guard ring electrode maintains a confinement current during each LPR measurement. The
confinement current prevents the perturbation current in the inner auxiliary electrode from spreading beyond a known area. To select an approximate level of the confinement current, two sensor electrodes are placed between the inner and outer auxiliary electrodes. The potential difference between the two sensor electrodes is monitored and maintained throughout the LPR measurement by selecting a proper confinement current. The LPR measurement is affected by a few factors such as temperature and humidity. Therefore, special attention should be paid to the interpretation of measured data. Table 1.2 gives the general criteria for the extent of corrosion based on the corrosion rate measured with and without guard ring.
Table 1.2 Corrosion rate vs. condition of reinforcement steel [13]
Extent of corrosion Icorr applied to device with
guard ring (µA/cm2)
Icorr applied to device
without guard ring(µA/cm2)
Passive icorr<0.1 icorr<0.22
Low to moderate 0.1<icorr<0.5 0.22<icorr<1.08
Moderate to high 0.5<icorr<1 1.08<icorr<10.8
high icorr>1 icorr>10.8
1.2.1.3 Transient technique. Transient techniques such as galvanostatic pulse or coulostatic methods in time domain recently became more receptive in the study of steel and concrete composite structures [14-18]. These techniques recognize the fact that corrosion is a relatively slow electrochemical response/process at steel-concrete interfaces, which makes data collection more preferably done in time domain than in frequency domain. In time domain, they can directly provide the measurement of both polarization resistance and double layer capacitance per unit surface area, independent of the size or total steel area of a test specimen. Such a measurement makes the transient techniques advantageous for in situ monitoring over others that require the prior
knowledge of the cross sectional area of the test system.
For transient measurements, a counter electrode is placed on the surface of concrete, a small current perturbation (pulse effect) is applied to a reinforcing steel bar embedded in the concrete, and the transient potential in the reinforcing steel is recorded
with respect to the reference electrode. The analysis of the transient response allows the determination of corrosion rate in steel. Figure 1.1 shows a typical potential response for
a corroding reinforcement bar. Under a galvanostatic pulse, the electrochemical system
can be approximately simulated by a simple Randles circuit due to the current pulse I and its potential response can be expressed into:
[1 exp( )] t S p dl p t V IR IR C R = + − − (1.3)
where Vt is the total potential change in the steel working electrode, IRs is the ohmic drop
in the concrete between the counter electrode and the working electrode, IRp is the
effective polarization potential during a charging or discharging period, Rp is the
polarization resistance of the rebar, Cdl is the double layer capacitance of the
steel-concrete interface, and CdlRp represents the time constant for the corrosion process.
IRP IRS Ecorr Vmax Time (s) P o te n ti al ( m V ) -200 -100 0 100 200
Figure 1.1 Typical potential-time curve as response to a galvanostatic pulse.
As shown in Figure 1.1, each measurement with the galvanostatic pulse transient technique may take a long period of time since the response to the pulse must be
stabilized before Vmax can be determined accurately. Curtailing the response measurement
before Vmax has been reached may lead to an erroneous evaluation of Rp and Cdl.
1.2.1.4 Electrochemical impedance spectroscopy. Electrochemical impedance spectroscopy (EIS) has been widely used in fundamental and applied electrochemistry
investigation of corrosion mechanisms in laboratory and for the determination of the corrosion rate of reinforcing steel in concrete. For each measurement, a harmonic potential signal (10 to 20 mV in amplitude) around the open-circuit potential is usually applied to the system or specimen under test, and the current signal is recorded as a function of the excitation frequency. By analyzing the test data in various frequency ranges, EIS can be used to study the corrosion kinetics and insights into the corrosion mechanism of a test specimen in a short time, and investigate the evolution of corrosion over a relatively long time.
The interpretation of EIS test data is usually done in combination with simulations of the electrochemical system under investigation by an equivalent electrical circuit. As shown in Figure 1.2(a-1), the simplified Randles circuit consists of a solution resistance in series with a parallel set of polarization resistance and capacitor. In order to extract the non-homogeneity and diffusion phenomenon, Sagues et al. [14, 15] and Feliu et al. [19-20] modified the simplified circuit by replacing the capacitor with a constant phase element (CPE) and adding a diffusion impedance, as shown in Figure 1.2(a-2). In an EIS measurement, multiple semi-circles are often observed because various materials have different characteristic frequencies [21-23]. The semi-circles can be represented either by a series of parallel pairs of capacitor (or CPE) and resistor as shown in Figure 1.2(b-1) or a series of mixed pairs of resistor and capacitor (or CPE) as shown in Figure 1.2(c-1), each pair representing a certain material behavior. The diffusion behavior is generally combined into a particular pair that represents the steel-concrete interface, as shown in Figures 1.2(b-2, c-2). More advanced circuit representations of the steel-concrete systems were also introduced as shown in Figures 1.2(e, f) [18, 24]. The fact that diverse electrical circuits have been used to reasonably represent a steel-concrete system warrants further study on the equivalent circuit representation of steel-concrete systems.
Rs Rp Cdl(CPEdl) Rs p Cdl(CPEdl) Zd Rs R1 C1 (CPE1) R2 Rn C2 (CPE2) Cn (CPEn) Rs R1 C1 (CPE1) R2 Rn C2 (CPE2) Cn (CPEn) Zd Rs R1 C1 (CPE1) R2 Rn C2 (CPE2) Cn (CPEn) Rs R1 C1 (CPE1) R2 Rn C2 (CPE2) Cn (CPEn) Zd Rs R3 C1 R2 C2 Rf CPE Rs r CPE R W
Figure 1.2 Various electrical circuits for steel-concrete systems: (a-1) Randle’s circuit, (a-2) modified Randle’s circuit, (b-1) resistor-capacitor in series, (b-2) modified
resistor-capacitor with diffusion in series, (c-1) resistor-capacitor in mixed mode, (c-2) modified resistor-capacitor with diffusion in mixed mode, (d) and (e) other models.
The use of EIS as a monitoring technique provides substantial information on the corrosion characteristics of a steel-concrete system. However, it is a time-consuming task and sometimes a challenge to interpret the EIS test data. Nevertheless, EIS is a powerful tool that has recently gained increasing acceptance for the understanding of corrosion behavior in various steel-concrete systems.
1.2.2 Corrosion Prevention Methods. A number of measures can be taken to protect reinforcement steel from corrosion. They can be divided into four categories [25]: (1) alternative reinforcement, (2) barrier to chloride ingress, (3) corrosion inhibitors, and (4) cathodic protection.
(a-1) (a-2)
(b-1) (b-2)
(c-1) (c-2)
1.2.2.1 Alternative reinforcement. To improve the corrosion resistance of RC structures, reinforcing bars with various materials can be used as an alternative to the widely used low carbon steel bars in civil engineering, including stainless steel rebar, stainless steel clad rebar, nickel clad rebar, copper clad rebar, and fiber reinforced polymer (FRP) rebar.
Stainless steel bars are produced by adding a minimum of 12% chromium into the low carbon steel so that an invisible film can be formed on the surface of the stainless steel bars and thus protect the steel from oxidation. It offers many advantages including high corrosion resistance, high strength, good ductility, and good weldability. Castro et al. [26] mechanically characterized two types of austenitic stainless steel bars, 304 LN and 316 LN grades, and found that the cold-rolled rib shaping significantly increased their strength and hardness but maintained their high toughness when compared with carbon steel bars. In a chloride-containing aqueous solution, the cold-rolled 304 LN bars were prone to pitting corrosion while the cold-rolled 316LN bars revealed excellent corrosion behavior. Garcia-Alonso et al. [27] studied the corrosion behavior of three low-cost and low Ni-content stainless steels embedded in mortar contaminated with chloride ions, and they concluded that the new stainless steel remained in the passive state in mortar specimens with both 2% and 5% chloride contents. Moser et al. [28] evaluated the corrosion resistance of austenitic, duplex, and precipitation-hardened martensitic high strength stainless steels and a pearlitic high-C prestressing steel bar in simulated alkaline and carbonated concrete pore solutions and found that all types of the steel materials showed high corrosion resistance at chloride concentrations from zero to 0.25M.
However, the high cost of stainless steel bars may prevent them from wide applications in construction. Therefore, stainless steel clad bars were studied as a lower cost corrosion resistance reinforcement option. It was produced by spraying 304 stainless steel on the surface of a portion of a billet and then rolling the steel in a traditional fashion. Darwin et al. [29] compared the performances of stainless steel clad bars and uncoated black steel bars. They found that the stainless steel clad bars corroded at a rate about two orders of magnitude lower than that of the black steel bars.
Nickel clad bars are produced by applying a heavy layer of nickel to a billet before it is hot rolled, resulting in a continuous coating of wrought nickel on the surface
of the steel bars. In 1980, copper clad bars were tested in concrete, leveraging with an FHWA study [30]. The copper clad reinforcing bars were compared with the black steel bars with and without calcium nitrite corrosion inhibitors and compared with epoxy– coated bars. The copper clad bars were not discussed in the FHWA report, but their results were published in 1996 by McDonald et al. [31]. The test results indicated that the copper clad bars with a coating thickness of approximately 0.5 mm exhibited a much higher corrosion resistance than the other types of reinforcement including the black steel with calcium nitrite corrosion inhibitors. Tests up to that time have shown excellent corrosion behaviors of copper clad reinforcing bars in concrete. Copper clad bars could also prove to be cost effective.
Fiber reinforced polymers (FRP) bars is another non-corroding reinforcement option for RC structures. It is made by three elements: fibers for strength, resinous synthetic polymers for binding with the fibers, and finishing or coupling agents for enhanced adhesion between the fibers and the polymers. Although carbon FRP strands exhibit superior fatigue behavior, high tensile elastic modulus and low relaxation, they typically have a low tensile strain at failure [32]. Another problem with glass composites is that they are made of silica, which can combine with calcium hydroxide in concrete and result in a loss of reinforcement over time.
1.2.2.2 Barrier to chloride ingress. Steel reinforcement can be protected from corrosion by establishing a barrier layer between it and its aggressive environment. It can be achieved by using high quality concrete (low permeability and thick cover), or protective coating on reinforcement steel. Two of the most widely used barriers for reinforcement steel are fusion-bonded epoxy (FBE) coating and hot-dipped galvanized (HDG) zinc coating.
Epoxy-coated reinforcing bars were developed in the early 1970s. They are made
by first cleansing black steel bars, heating them to around 230 °C, and passing them
through an electrostatic spray that applies charged, dry epoxy powders to the steel surface. In this process, epoxy materials melt, flow and cure on steel bars, which are finally quenched with usually a water spray bath [33]. Epoxy coating functions in two ways, first by acting as a barrier and keeping oxygen and chloride ions from reaching the
surface of steel bars, and second by increasing the electrical resistance between adjacent steel bars in practical applications.
Epoxy-coated steel bars were widely used for bridge construction in the 1960s and 1970s because they are sufficiently flexible to bend in application and can be produced at high speed [33]. However, in 1986, the substructure of the Long Key Bridge with epoxy-coated steel rebar began to show signs of corrosion only five to seven years after construction [34]. In the following several years, corrosion was observed in other bridges [35]. After several studies, corrosion in epoxy-coated rebar was mainly attributed to the damage induced during transportation and handling. Equally if not more important, corrosion at one location of the damaged epoxy coating was widely spread underneath the coating due to relatively weak physical bond between the epoxy and its steel substrate. In addition, use of epoxy-coated steel rebar reduced the bond strength between rebar and concrete [36].
Metallic coatings have been used successfully to prevent corrosion of steel in other applications, and were recently expected to protect reinforcement steel from corrosion in RC structures. One of the most popular metallic coatings for reinforcement steel is the application of hot-dip galvanic (HDG) zinc on steel bars. Zinc-coated or galvanized bars are produced by a hot-dip process in which the steel bars are first cleansed by pickling, and then immersed in molten zinc. Like steel, zinc can generate corrosion products that occupy more space than the zinc itself, and can consequently cause concrete to cracking. An advantage of galvanized reinforcement is that, as zinc corrodes sacrificially, a hydrated oxide is formed on the rebar surface that acts as an electrical insulator. The insulator is thought to form a barrier at active corrosion sites that will prevent further corrosion from occurring [37].
Galvanized steel rebar have at least two main concerns in engineering applications. First, the zinc coating corrodes vigorously due to the high alkaline environment in fresh concrete, likely leaving an insufficient galvanic protection for the underlying steel in long term. Second, the hydrogen produced in the corresponding cathodic half-cell reaction would increase the porosity of adjacent cement pastes and thus reduce the bond strength between the rebar and the concrete [38].
1.2.2.3 Corrosion inhibitors. Corrosion inhibitors may be a good alternative to other protection methods due to their lower cost and easy application. They can be added into fresh concrete as an admixture and repair mortar for existing RC structures, or directly applied on hardened concrete surfaces and rebar surfaces before concrete casting. There are three mechanisms of protection from inhibitors [39]: anodic, cathodic, and mixed. Anodic inhibitors act on the dissolution of steel and reduce the corrosion rate by increasing the corrosion potential of the steel. Cathodic inhibitors act on the oxygen reaction on the steel surface and reduce the corrosion rate by decreasing the corrosion potential. Mixed inhibitors act on both anodic and cathodic sites and reduce the corrosion rate without significantly changing the corrosion potential, generally by surface absorption of the steel in contact with the inhibitors and consequently forming a thin protective layer.
The most commonly-used anodic inhibitors are calcium nitrite (Ca(NO2)2 and
sodium nitrite; sodium benzoate and sodium chromate are the next [40, 41]. The most commonly-used cathodic inhibitors are sodium hydroxide and sodium carbonate, which are supposed to increase the pH near steel and reduce the oxygen transportation by covering the steel surface; phosphates, silicate and polyphosphates are the next [42]. Mixed type inhibitors include materials with hydrophobic groups such as N, S, and OH are effective. Organic polymer compounds such as amine and aminoalcohol (AMA) are also used [42].
1.2.2.4 Cathodic protection. Cathodic protection is an electrochemical technique for corrosion control by connecting the metal to be protected to a more easily corroded metal so that the protected metal and the “sacrificial” metal act as the cathode and anode of an electrochemical cell, respectively. It has been widely adopted to control the corrosion of reinforcing steel embedded in concrete [43-45]. The goal of cathodic protection is to shift the potential of the protected steel to the least probable range for corrosion. Cathodic protection has been determined by Federal Highway Administration to be the only rehabilitation technique that can prevent further corrosion in RC structures
regardless of the salt content in concrete [46].
Sacrificial anode methods have such an advantage as no auxiliary power supply requirement. They can be used in prestressed or post-tensioned concrete with no risk of
increasing potential shifts and thus no hydrogen embrittlement of the steel. In addition, since the anode is directly connected to the protected steel, electrical shorting is of no concern. Anode materials made of arc sprayed zinc, aluminum alloys containing Zn, and magnesium alloy have been studied extensively in laboratory and field conditions [47, 48].
1.2.3 Corrosion-induced Structural Deterioration. Corrosion of reinforcing steel bars in concrete may impair the capacity of RC structures in the form of concrete cracking, steel reduction, and loss of the bond between the steel reinforcement and concrete. Following is a presentation of a detailed review on the three effects.
1.2.3.1 Concrete cover cracking. Corrosion-induced cracking in concrete cover is an important criterion for the analysis and evaluation of the service life of a RC structure. Cracks in concrete cover provide paths for a rapid ingress of aggressive chemicals to the reinforcing steel bars, and accelerate structural deterioration. Therefore, the appearance of the first crack is a key indication for the end-of-service-life of structural concrete. Indeed, concrete cover cracking induced by corrosion has been identified as the serviceability limit state of RC structures [49, 50].
Both laboratory and field tests have been conducted extensively to investigate the corrosion-induced cracking in concrete cover. These studies can be classified into three main categories: empirical (experimental), analytical, and numerical modeling [51]. The empirical models are primarily based on a regression analysis of experimental data and observations. Andrade et al. [52] conducted accelerated corrosion tests and observed that regardless of corrosion rate, cracking occurred at a structurally negligible steel loss of approximately 20 um in diameter. Webster [53] conducted a regression analysis of 50 sets of experimental data obtained by other researchers and proposed a very simple model for a rough estimation of critical attack penetration, which initiates concrete cover cracking. The analytical models are based primarily on the fundamental of solid mechanics under some assumptions. Bazant [54] used a comprehensive mathematical formulation for corrosion rate and proposed a predictive model for crack width using the principles of linear elastic solid mechanics. Finite element model (FEM) has also been applied to study concrete cracking. Yokozeki et al. [55] simulated the internal pressure by
imposing strains to the corrosion front. Using a regression analysis of the results from multiple FEMs, an empirical equation for the prediction of cracking time was proposed.
Although the above models shed insight on steel corrosion and concrete cracking, their predictions are often deviated from respective observations. The possible sources of discrepancy between the theory and observations are [56]: (1) lack of an accurate model for corrosion rate, (2) neglecting the residual strength of cover concrete after its tensile capacity is exceeded, and (3) lack of full understanding of the composition and mechanical properties of corrosion products. Corrosion products can migrate away from the bar surface through open cracks and concrete pores toward the free surface.
1.2.3.2 Mechanical degradation of corroded rebar. Many researchers have investigated the effect of corrosion on the mechanical properties of steel, and stated notable reductions in yielding and ultimate tensile strengths and a significant reduction in the ultimate strain and elongation of corroded rebar. Almusallam [57] tested 6-mm and 12-mm steel bars embedded in concrete and subjected them to accelerated corrosion. Using the actual cross-sectional area, the ultimate tensile strength of steel bars was marginally reduced as the degree of steel corrosion increased. Correspondingly, the total elongation of the steel bars decreased with the increasing degree of corrosion. Apotolopoulos and Papadakis [58] studied the tensile behavior of corroded steel bars of Class BSt 420, and found that the effective yield strength remained nearly constant while the apparent yield strength and both effective and apparent ultimate strengths decreased as the corrosion rate increased. Cairns et al. [59] investigated the effect of local pitting, which was simulated by removing a section of a bar using a multifluted, hemispherical end mill with a cylindrical shank, and found that the reduction of the maximum load was proportional to the damaged area while reduction in the force at the yield point was slightly less proportional to the cross-section. Du et al. [60] experimentally studied 108 reinforcement steel bars, and they concluded that the residual yield strength and the ultimate strength of corroded steel bars in concrete decreased with an increasing corrosion level. Apostolopoulos et al. [61] used advanced image analysis to investigate the effects of corrosion on mechanical properties and pit depths on B500c steel bars embedded in concrete. Wang et al. [62] used a three-dimensional (3D) laser scanner to determine the residual cross-sectional areas of corroded bars recently.
1.2.3.3 Bond degradation due to corrosion. Corrosion products of reinforcing steel bars occupy more space than the steel itself, exert an expansive radial pressure at the steel-concrete interface, develop the hoop tensile stress in the surrounding concrete, and therefore results in concrete cracking as the maximum hoop tensile stress exceeds the tensile strength of the concrete. Corrosion also causes the reduction in rib height of the deformed bars and the subsequent reduction of the interlocking force between the ribs and their surrounding concrete, thereby weakening the bond and anchorage between the concrete and reinforcement.
Bond behavior of corroded reinforcement bars has been experimentally studied by many researchers. Fang et al. [63, 64] investigated the effect of steel corrosion on the bond between steel bars and their surrounding concrete under confinement, and analyzed the results with the finite element method. They concluded that the confinement provided an effective means to counteract the bond loss of corroded steel bars at a medium corrosion level. Li et al. [65] studied the effect of corrosion on the bond strength between steel strands and concrete, and found that corrosion of strands in a prestressed concrete structure reduced the tensile strength of the strands more significantly than their bond strength in concrete. Tang et al. [66] investigated the effects of the concrete cover depth, bar diameter, degree of corrosion and the surface crack width on the bond strength between concrete and the corroded rebar, and found a strong correlation between the average bond strength and the average surface crack width, and an unclear relationship between the average bond strength and the degree of corrosion. Yalciner et al. [67] proposed an empirical equation for the steel-concrete bond strength considering two concrete mix designs, three concrete cover depths, and the degree of corrosion.
1.3 RESEARCH OBJECTIVES AND SCOPE OF THIS WORK
This study takes a new barrier approach to control the corrosion of steel rebar in concrete. Specifically, enamel coating will be developed and applied to steel rebar in RC structures in order to meet the societal needs for cost-effective corrosion mitigation measures. In addition, the main components in a probabilistic, corrosion-induced