1
Germanium oxidation occurs by diffusion of oxygen network interstitials
H Li and J Robertson
Engineering Dept, Cambridge University, Cambridge CB2 1PZ, UK
Abstract Density functional modeling is used to show that germanium oxidation occurs by the
diffusion of network oxygens across the film as peroxyl bridges, not by molecular O2 interstitials
(O2*). The smaller O bond angle of GeO2 leads to lower order rings in the amorphous GeO2
network than in SiO2. This leads to narrower interstitial diffusion channels, and less dilation of
the interstitial volume around the transition state. This raises the migration barrier of O2* in
GeO2, so that the overall diffusion energy of O2* in GeO2 is now higher than that of a network O
interstitial. The low formation energy of the O vacancy in GeO2 leads to GeO2 being O-poor
very near the Ge/GeO2 interface, but the lower overall diffusion energy of the O network
interstitial than the vacancy leads to the network interstitial dominating diffusion.
Silicon has been the dominant semiconductor for many years largely because SiO2 is such a
well-behaved oxide. However, to continue Moore’s law scaling, it is becoming necessary to replace Si with a higher mobility semiconductor. Ge has higher electron and hole mobilities than Si and would be a reasonable choice. However, Ge has a poor native oxide GeO2 with a poorer
interface with its parent Ge for reasons that are not fully understood [1-3].
Historically, one of the notable features of silicon was its well-understood oxidation process. Silicon oxidation follows the linear/quadratic Deal-Grove model [4], in which the O2 molecule
diffuses along interstitial channels of the amorphous (a-) SiO2 network [4,5], to react
exo-thermically with Si at the Si/SiO2 interface [6-9]. This occurs because of the remarkably open
network of a-SiO2. This model was verified by the lack of O isotopic exchange with the existing
network oxygens [10,11]. Ge oxidation somehow differs, it creates Ge/GeO2 interfaces with
more interfacial defects [1,2], molecular GeO is volatile [12], the oxidation kinetics follow an unusual pressure dependence [13], but the Ge/GeO2 interface can be flat [14]. Here, we analyze
the Ge oxidation mechanism in terms of atomic transport processes across the GeO2 layer, and
conclude that it occurs mainly by transport of oxygen network interstitials (also known as peroxyl bridges) rather than by molecular oxygen interstitials [15]. A hint of this is already seen by comparing the experimental oxidation rates of Si and Ge [5,12,13], and the kinematic viscosities of SiO2 and GeO2 [16-19] in Fig 1(a).
There are three possible transport paths for the oxidation of Si or Ge, see Fig 1(b); diffusion of molecular O2 interstitials along channels in the oxide, diffusion of interstitial network
oxygens, or diffusion of oxygen vacancies across the oxide network. The immobility of the cation in SiO2 and GeO2 was confirmed by isotope tracer studies [10,12]. The mechanism for the
oxidation is as follows. If Si or Ge is pre-oxidized in 16O and then further oxidized in 18O, if molecular O2 transport dominates, then an 18O peak will be found at the Si/SiO2 interface, as
indeed occurs for Si [8,9]. If oxidation occurs by transport of O lattice interstitials or vacancies, there is 18O exchange with the network, and a broad peak of 18O will be found across the oxide layer, as is seen for GeO2 by Xu et al [20] and da Silva et al [21].
Here, we use density-functional supercell calculations to find out which species control the oxidation mechanism in a-GeO2 by calculating the defect formation energies and the migration
2
energies. The overall diffusion energy is then the sum of these two energies. The calculations are carried out using the CASTEP plane-wave density-functional code [22] and ultra-soft pseudopotentials. The plane-wave cut-off energy is 500 eV. Energies are relaxed until residual forces are below 10-5 eV/Ǻ. Some 144 atom and 216 atom GeO2 network models were made by
molecular dynamics, equilibrating at 3000K for 10 ps, then quenching in 10 ps, followed by an energy minimization. Similar a-SiO2 networks were created with the same procedure. In addition,
supercells of quartz-like SiO2 and GeO2 are used. The defect formation energy is the energy cost
to form the defect, with the O atom going to form an O2 molecule outside the SiO2. The migration
energy is the energy barrier of the transition state over which the defect atoms must pass to get to its next site. The total diffusion energy is the sum of these two energies. The migration energies for network defects are derived by the nudged elastic band method [23].
Of the three possible diffusing species (Fig. 1b), let us first consider the competition between the O2 molecular interstitial O2* and the O lattice interstitial Oi. The defect formation energies of
Oi and the oxygen vacancy Vo are relatively independent of network, as they depend on the
forming or breaking of specific covalent bonds. In contrast, the formation energy of the O2* arises
from the closed-shell repulsions of the O2 molecule and the surrounding oxide network, and thus
it depends on the size of the network interstice. The O2* molecule is surrounded by lattice
oxygens. In quartz SiO2 of density 2.66 gm/cm3, there is one main interstice configuration, and
the defect formation energy at this site is ~2.04 eV, Fig 2(a), similar to found by Bongiorno [6] but larger than in Hamann [24].
A-SiO2 (silica) is less dense than quartz at 2.25 gm/cm3 and it contains a range of interstices
and channels mostly of larger size [25,26]. The lower density means that the Si-O-Si bond angle increases from 1440 in quartz towards 1500 in silica. Fig 2(a) plots the O2* formation energy vs
the relaxed interstice volume. This energy varies inversely with volume and follows a V-3.5 dependence. The interstice volume is calculated from the distance between the O2 bond center to
the six nearest network O sites, averaged, and then approximated as a sphere. A similar calculation is carried out for quartz-like GeO2 and for a-GeO2 random networks whose density is
3.55 gm/cm3 [27]. Fig 2(a) shows that the O2* defect formation energy follows the same line as in
SiO2, confirming that the energy depends mainly on O-O repulsions in both cases.
We studied many interstices in a-SiO2 and a-GeO2 in both their initial unrelaxed and relaxed
state (ie before and after the O2 molecule is added). Fig 2(b) shows the relaxation ratio (relaxed
volume/unrelaxed volume) vs. interstitial volume for each oxide. A major difference between a-SiO2 and a-GeO2 is that a-SiO2 has a longer tail of large interstitial volumes. This arises from the
larger O bond angle and different network topology of silica giving more low-order rings. This allows a greater interstice relaxation for the SiO2 case.
Fig 2(c) plots the probability distribution of relaxed interstitial volumes for both a-SiO2 and
a-GeO2. Interestingly, the average volume is rather similar, around 110 Å3, and slightly larger for
the SiO2 case. Thus from Fig 2(c), the O2* defect formation energy is slightly lower in a-SiO2, but
not by much. But it is notably smaller in a-SiO2 than in quartz.
The O2 or O diffusion energy is the sum of the defect formation energy and the migration
(barrier) energy. For the O2* in an interstice site in quartz, there are two diffusion paths, along the
Oz channel or along the Ox,y channels with quite different diffusion barriers. In silica or a-GeO2,
there are a range of diffusion paths. As in Biongorno and Pasquarello [6,7], there are roughly six adjacent interstitial sites around each O2* site for it to hop to. Thus, diffusion can be simplified to
3
a percolation problem on a simple cubic mesh, for which the percolation threshold is 0.55 as previously used [6]. Thus, the overall diffusion energy is the energy at 55% of its cumulative distribution, as in Fig 2(d).
This leads to the O2* migration energy being larger in a-GeO2 than in a-SiO2, see Table 1.
This is because the migration channels between interstices can dilate more in a-SiO2 during the
passage of O2* giving it a lower migration barrier, Fig 3(a,b). This gives a total diffusion energy
of ~1.4 eV for a-SiO2 and ~2.0 eV for a-GeO2 for O2* as in Table 1. The key difference for
a-GeO2 is its smaller O bond angle, which raises its O2* migration barrier, due to its reduced
channel relaxation. (We also note the greater interstitial volume in silica than quartz because of its lower mass density, which increases the O2* diffusion rate by five orders magnitude at 6000C
[26].)
We now consider the neutral O lattice interstitial Oi or ‘peroxyl bridge’. Its configuration is
shown in Fig 3(c). The oxygen bond angles are typically 100-1100. We see in Table 1 that the formation energy of Oi changes from 2.0 eV in quartz to 1.4 eV in a-SiO2 to ~0.4 eV in a-GeO2,
for O-rich chemical potentials. In a-GeO2, the defect formation energy has a distribution. It
depends somewhat on the Ge-Ge separation of the initial Ge-O-Ge unit, as this determines the two bond angles at the oxygens. The Oi migrates from one SiOSi or GeOGe bridge to an adjacent
bridge site via a 5-fold coordinated Si or Ge transition state in both oxides, as shown in Fig 3(c). A similar transition state was seen by Hamann [24].
The overall effect is that the lowest energy diffusion path for oxygen in silica is the O2* route
because of its open channels, whereas the lowest path in a-GeO2 is by the network interstitial Oi.
Thus, O diffuses by the O2* route in a-SiO2, giving an experimental activation of oxidation of
1.23 eV similar to the O2* diffusion energy 1.4 eV, while in a-GeO2 the O2* diffusion energy is
increased, and the process shifts to the Oi path which has an diffusion energy of ~1.8 eV.
These values are compared to experiment in Table 1 (in bold). The O2* diffusion energy of 1.4
eV in a-SiO2 is consistent with the experimental activation energy of 1.23 eV for Si oxidation in
Fig 1(a), and the Oi diffusion energy of 1.79 eV for a-GeO2 is consistent with the experimental
activation energy of 2.0 eV for Ge oxidation.
We finally consider competition between VO and O interstitials. The O vacancy is a very
costly defect in SiO2, so this is not involved in Si oxidation (except in any reactive layer next to
the interface [28]). On the other hand, the O vacancy is thought to be important in a-GeO2, and
has been considered to be a key diffusing species [9,16]. This is because the O vacancy has a low cost in GeO2 in the O-poor condition, as occurs at the Ge/GeO2 interface. However, the O-rich
condition dominates across most of the film under oxidation conditions.
To understand the relevance of the interstitials and vacancies for diffusion in detail, we note that defect formation energies depend on the oxygen chemical potential, μ(O). μ(O) varies from
μ(O) = 0 eV at atmospheric pressure at the film’s surface to μ(O) = -4.85 eV at the Si/SiO2
interface, where –4.85 eV is the bulk heat of formation of SiO2 per O atom. Or, in GeO2, μ(O)
varies from 0 eV at the external surface to μ(O) = -3.02 eV at the Ge/GeO2 interface, where -3.02
eV is the bulk heat of formation of GeO2 per O. The defect formation energy Eform at an arbitrary
O chemical potential μ1 is given by
Eform(μ1) = Eform(μ0) + n.μ1 (1)
4
At the SiO2 surface where μ(O)=0 eV, Oi has a fairly low formation energy and VO has a very
large formation energy of 6.05 eV. At the Si/SiO2 interface, VO is now a lower cost defect, but it
still costs 1.4 eV. GeO2 is different. At the GeO2 surface, Oi is low cost, at ~0.5 eV and VO costs
3.16 eV, but at the Ge/GeO2 interface VO is very low cost at only 0.14 eV, much lower than at
Si/SiO2.
Under diffusing conditions, the oxygen flux J across a layer is given by
J = -
i i i i i i x c D x c D .where the concentration of species i ci = c0 exp (-Eform,i /kT). The flux must be the same across the
whole film. This equation can describe two situations for GeO2. In condition 1, the quiescent
state, the low cost of VO at the Ge/GeO2 interface dominates, and the μ(O) of O-poor condition
spreads across most of the film to near the surface, and then changes quickly to the O-rich condition very close to the surface, Fig. 4(a). μ(O) changes from fully O-rich to O-poor across the film thickness, and the main change occurs over a fraction (kT/∆μ) of this thickness below the surface.
In condition 2, corresponding to oxidation, the O-rich condition spreads from the GeO2
surface down through most of the film to the Ge/GeO2 interface. This causes the O flux to be
carried by the O interstitial. μ(O) then rapidly falls very close to the interface, Fig 4(a), VO then
becomes the flux carrier, formally across the last atomic layer, and the sharp decrease in μ(O) occurs to create a large concentration gradient to force the same flux to be carried by VO.
The difference of VO between SiO2 and GeO2 arises as follows. Making a VO leaves two
dangling bonds on the adjacent Si or Ge sites. These sites rebond into Si-Si or Ge-Ge bonds. The formation energy of a O vacancy is very large in SiO2 even after the rebonding (6.05 eV) in the O
rich condition, because of the large cost of breaking Si-O bonds. It is less in GeO2 (3.16 eV)
because the Ge-O bond is weaker. (Table 1). Furthermore, the migration barrier for the O vacancy is very high in SiO2, at 4.28 eV, and is much less in GeO2, at 1.71 eV. The migration energy
largely consists of undoing the reconstruction of the vacancy into a Si-Si or Ge-Ge bond.
A final detail about defects is the valence alternation pair (VAP). This consists of a positively charged 3-fold O site, and a negatively charged 3-fold Ge site. These sites have been seen in simulations of a-GeO2 and a-SiO2 [29,30]. Briefly, they are O-deficiency defects created from O
vacancies. Their formation energy is greater than the vacancy, but their migration energy is much lower than for the vacancy, Table 1. They are relevant to other processes in these oxides.
Thus, in summary, the main diffusing species changes from the interstitial O2* molecule in
SiO2 to the lattice O interstitial in a-GeO2. This is largely due to the smaller O bond angle in
GeO2, meaning fewer high order rings, and this less ability for its network to dilate around the
O2* to allow it to lower its migration energy, unlike in a-SiO2. This is consistent with isotopic
tracer results. The O lattice interstitial dominates O O vacancy diffusion in a-GeO2 because this
becomes O-poor only very close to the Ge/GeO2 interface under oxidizing conditions.
The authors thank EPSRC grant EP/M009297 for funding. References
5
2. A Delabie, F Bellenger, M Houssa, T Conard, S VanElshocht, M Caymax, M Heyns,M Meuris, App Phys Lett 91 082904 (2007)
3. J Robertson, R M Wallace, Mat Sci Eng R 88 1 (2015)
4. B E Deal, A S Grove, J Appl Phys 36 3770 (1965)
5. J D Plummer, M D Deal, P B Griffin, ‘Silicon VLSI Microelectronics’, Prentice Hall (2000) p319
6. A Bongiorno, A Pasquarello, Phys Rev Lett 88 125901 (2002)
7. A Bongiorno, A Pasquarello, Phys Rev B 70 195312 (2004)
8. A Bongiorno, A Pasquarello, Phys Rev Lett 93 086102 (2004); J Phys Conden Mat 17
S2051 (2005)
9. L Tsetseris, S T Pantelides, Phys Rev Lett 97 116101 (2006)
10. F Rochet, S Rigo, M Froment, C D’Anterroches, C Maillot, H Roulet, G Dufour, Adv Phys
35 237 (1986)
11. E P Gusev, H C Lu, T Gustafsson, E Garfunkel, Phys Rev B 52 1759 (1995)
12. S K Wang, K Kita, T Nishimura, K Nagashio, A Toriumi, Jpn J App Phys 50 04DA01
(2011)
13. C H Lee, T Tabata, T Nishimura, K Nagashio, A Toriumi, App Phys Exp 5 114001 (2012)
14. T Sasada, Y Nakakita, M Takenaka, S Takagi, J App Phys 106 073716 (2009)
15. G Hetherington, K H Jack, J C Kennedy, Phys Chem Glasses 5 130 (1964)
16. G Urbain, Y Bottinga, P Richelt, Geochim. Cosmochim. Acta 46 1061 (1982)
17. E F Riebling, J Chem Phys 39 1889 (1963)
18. S K Sharma, D Virgo, I Kushiro, J Non-Cryst Solids 33 235 (1979)
19. W Xu, T Nishimura, T Yajima, A Toriumi, presented at JSAP meeting (March 2017, Yokohama, 16p-413-4)
20. S R M daSilva, G K Rolm, G V Soares, I J R Baumvol, C Krug, L Miotti, F L Freire, M E H M daCosta, C Radike, App Phys Lett 100 191907 (2012)
21. H Li, J Robertson, IEEE-SISC (San Diego, Dec 2016) p7.2
22. S J Clark, M D Segall, C J Pickard, P J Hasnip, M J Probert, K Refson, M C Payne, Z Krist
220, 567 (2005); S. J. Clark and J. Robertson, Phys. Rev. B 82, 085208 (2010)
23. G Henkelman, H Jónsson, J. Chem. Phys.113, 9901 (2000)
24. D R Hamann, Phys Rev Lett 81 3447 (1998) 25. S L Chan, S R Elliott, Phys Rev B 43 4423 (1991)
26. R A B Devine, J Capponi, J Arndt, Phys Rev B 35 770 (1987)
27. M Micoulaut, L Cormier, G S Henderson, J Phys Conden Mat 18 R753 (2006)
28. R M C deAlmeida, S Goncalves, I J R Baumvol, F C Stedile, Phys Rev B 61 12992 (2000)
29. H Li, J Robertson, App Phys Lett 110 032903 (2017);
30. A Pasquarello, M S Hybertsen, R Car, Nature 396 58 (1994)
31. O Kubaschewski, C B Alcock, ‘Metallurgical Thermochemistry’, (Pergamon, Oxford, UK, 1979 )
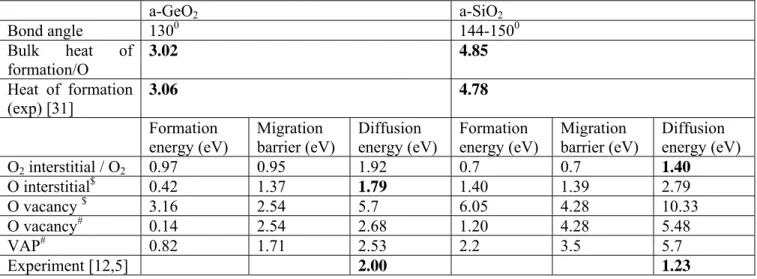
6 a-GeO2 a-SiO2 Bond angle 1300 144-1500 Bulk heat of formation/O 3.02 4.85 Heat of formation (exp) [31] 3.06 4.78 Formation energy (eV) Migration barrier (eV) Diffusion energy (eV) Formation energy (eV) Migration barrier (eV) Diffusion energy (eV) O2 interstitial / O2 0.97 0.95 1.92 0.7 0.7 1.40 O interstitial$ 0.42 1.37 1.79 1.40 1.39 2.79 O vacancy $ 3.16 2.54 5.7 6.05 4.28 10.33 O vacancy# 0.14 2.54 2.68 1.20 4.28 5.48 VAP# 0.82 1.71 2.53 2.2 3.5 5.7 Experiment [12,5] 2.00 1.23
Table 1 Calculated defect formation energies and migration barrier energies in GeO2 and SiO2. $ in O rich-limit, # in O-poor limit. The experimental diffusion energies in the last row are to be compared with the specific calculated values in bold above.
7
Figure Captions
1. (a) Oxidation rates of Ge and Si vs temperature [5,12,13], compared to kinematic viscosity of amorphous GeO2 and SiO2 [15-18]. We note that the activation energies for oxidation and
viscosity are fairly close for the case of Ge (2.00 eV and 2.74 eV), but quite different for Si (1.23 eV and 5.99 eV), indicating that similar processes may be involved in the case of Ge whereas this is not so for Si. (b) schematic of alternative oxygen transport paths through SiO2
and GeO2 to the semiconductor interface. The open circle in the right hand diagram signifies
a vacancy.
2. (a) Formation energy vs relaxed interstitial volume of O2* in SiO2 and GeO2. (b) Relaxation
ratio vs initial unrelaxed interstital volume for a-SiO2 and a-GeO2, noting larger relaxation
for the a-SiO2 case. (c) probability distribution of relaxed interstitial volumes of O2* in
a-SiO2 and a-GeO2 network models, guassian broadened by 5Å3. (d) probability distribution
of diffusion barrier energies for a-GeO2 models.
3. (a) migration paths of various species in SiO2 or GeO2. Migrating species is in orange. (a)
O2* in quartz SiO2, (b) O2* in quartz-like GeO2 showing slight bonding to channel O in the
transition state. (c) migration path of oxygen network interstitial in SiO2 and GeO2 via
5-fold intermediate Si/Ge site. (d) migration path of the O vacancy (equivalent to a Ge-Ge bond) to adjacent site. Si=yellow, Ge=green, O = red.
4. (a) O chemical potential vs depth across a GeO2 film while in contact with Ge substrate and
while being oxidised from surface. The length scale is the fractional depth between surface and interface. (b) Summary of diffusion barrier energies of O2*, Oi and VO at high μ(O) (at
surface) and at low μ(O) (near interface), for GeO2, and their relevance to transport
8 interstitial O interstitial lattice O O vacancy semiconductor oxide 2
(a)
(b)
9
(a)
(b)
10
(a)
(b)
(c)
11