M
MOONNEETTAARRYY PPOOLLIICCYY
Taking Monetary Aggregates Seriously
ByPierre L. Siklos
INDEPENDENT
REASONED
RELEV
ANT
In response to the recent financial crisis, central banks around the world, including the Bank of Canada, have provided markets with extraordinary levels of liquidity. As the economic recovery takes hold, the question arises of what the increasedliquidity, through higher money growth, portends for the near future.
The supply of and demand for money – a balance summarized in a “money gap” estimate, which measures deviations in the actual supply of money relative to the demand for money driven by economic fundamentals – carries information on the outlook for inflation and economic growth. Current evidence suggests a rebound in economic growth and inflationary pressure unless the Bank begins to rein in money growth.
The Bank of Canada should provide some guidance on its thinking on the behaviour of monetary and credit aggregates and what it entails for inflation and economic growth.
Thor Koeppl, David Laidler, Michael Parkin, Angela Redish, Bill Robson, Avery Shenfeld, Andrew Spence, and others, provided helpful comments on earlier drafts.
1 As the Bank explained, “Conditional on the outlook for inflation, the target overnight rate can be expected to remain at its current level until the end of the second quarter of 2010 in order to achieve the inflation target. The Bank will continue to provide guidance in its scheduled interest rate announcements as long as the overnight rate is at the effective lower bound” (Bank of Canada 2009, 2).
2 See Bank of Canada, “About Credit Conditions,” online at http://credit.bank-banque-canada.ca/about. The relevant information is also in Banking and Financial Statistics, online at http://www.bankofcanada.ca/en/bfsgen.html. Nevertheless, it is safe to safe to say that the relevant monetary aggregates data were deemphasized both in central banking and in academic circles in recent years with a few notable exceptions (see below).
With central bank policy interest rates near zero in much of the developed world, the instrument used for over a decade to communicate, and deliver, monetary policy has lost some relevance. In Canada’s case, its reduced information content was underscored by the Bank of Canada’s April 2009 announcement that, conditional on the outlook for inflation, it would maintain the target overnight rate at 0.25 percent until June 2010.1In other words, the current overnight rate target is not enough: the Bank also wished to influence short-term interest rate expectations. Meanwhile, the Bank began highlighting a wider array of information on monetary and credit aggregates.2The U.S. Federal Reserve, the centre of attention in the current financial crisis, the European Central Bank, and other central banks have also begun to pay greater attention to the evolution of monetary (and credit) aggregates.
Although many academics and central bankers relegated monetary aggregates to the dustbin of history during the 1990s, others have continued to insist that “money does matter” and that, at least in the medium
term, the evolution of certain monetary aggregates does signal future inflation. The European Central Bank’s two-pillar monetary policy strategy, for example, monitors monetary aggregates for clues about the longer-term prospects for economic activity and inflation.3Both the Fed and the European Central Bank have pondered whether emergency liquidity measures, including some of the extraordinary tools the Fed has introduced, can be removed without necessarily immediately tightening monetary policy. Closer to home, well-known difficulties with the measurement of monetary aggregates and the complications of relying on these aggregates as indicators of monetary policy (see, for example, Siklos and Barton 2001) have led to the neglect of monetary aggregates instead of challenging the economics profession to address the mystery of their significance in evaluating monetary policy (see Laidler and Robson 2004).
It is not entirely surprising, then, that analysts look for indications of whether the extraordinary injections of liquidity portend a return to the high inflation or, worse still, the stagflation of the 1970s.4After all, it was arguably a series of policy failures that led to the predicament we find ourselves in, and there is no guarantee that, having escaped Great Depression 2.0, we will avoid stumbling into Great Inflation 2.0.5
Given the drawing of battle lines concerning how best to exit from the current extraordinary measures that central banks have initiated and the renewed interest in monetary aggregates, it seems worthwhile to examine the evidence. This e-briefaccordingly asks whether the supply of and demand for money in Canada – a balance summarized in a “money gap,” essentially, the deviation in money growth from some underlying long-term relationship defined by money demand – prefigures renewed growth and controlled inflation. The answer currently appears to be yes, although difficulties in interpreting this information and the delicacy of the Bank of Canada’s exit strategy from its response to the crisis make continued careful monitoring of the money gap essential.
Velocity, Money Demand, and All That
Superficially, it appears somewhat puzzling that, despite large injections of liquidity, both inflation and expectations of inflation remain firmly anchored within the Bank of Canada’s inflation-target range. Since the fourth quarter of 2008, however, the velocity of money (i.e., the frequency with which money is spent or circulated in an economy), whose growth fluctuated around the zero mark for over a decade, has turned sharply negative with annualized growth rates of well over -10 percent.6A return to higher velocity would, given a now much enlarged stock of money, herald higher inflation down the road.
Figure 1 below plots, in two parts, the growth rates of M1+ and headline consumer price index (CPI) inflation (panel A) and real growth of Canada’s gross domestic product (GDP) (panel B) over the 1993-2009 period. The vertical line at the third quarter of 2007 in panel A marks the unofficial start of the financial crisis with the sub-prime episode that originated in the United States.7Rising money growth, a steady drop in velocity, and relatively stable economic growth over the past two decades have allowed inflation to remain for the most part inside the target range of 1-3 percent in which the Bank of Canada is tasked to navigate. Nevertheless, it is striking that surges in money
3 See the European Central Bank website at http://www.ecb.int/mopo/strategy/html/index.en.html. In recent years, the Bank for International Settlements, which speaks for several central banks, has warned policymakers of the dangers – admittedly for financial system stability, not just inflation – lurking behind the growth of certain components of money and credit growth; see, for example, Borio and Lowe (2004).
4 Some prominent economists have argued that a return to inflation rates of 6 percent or so might be desirable, especially as industrialized countries risk drowning under unsustainably high debt loads (see, for example, Kenneth Rogoff, “Not so high on the rebound,” Globe and Mail,May 6, 2009); others are aghast that we would be willing to risk the hard-won war against inflation and public support for price stability (see A.H. Meltzer, “Inflation nation,” New York Times,May 4, 2009).
5 In this connection, it is instructive to compare the optimistic central banking view of Fed vice-chairman Donald Kohn (2009) with the more sober and pessimistic take of Hamilton (2009). A central bank that partners with the fiscal authorities to deal with a financial crisis risks losing its autonomy and, hence, raises the spectre of higher future inflation.
6 This is not simply a Canadian phenomenon; the velocity of money has also fallen sharply in the United States in recent quarters; see, for example, Mark Gongloff. “As liquidity drains, so does inflation risk,” Wall Street Journal,September 9, 2009.
Annualiz ed inflation rate (%) Annualiz ed M1+ g ro wth (%) Headline CPI M1+ -2 -1 0 1 2 3 4 5 6 -2 0 2 4 6 8 10 12 14 1993 1996 1999 2002 2005 2008
Figure 1: Money Growth, Inflation and GDP, 1993-2009
Panel A: Growth of M1+ and Headline CPI Inflation
Annualiz ed g ro wth rate (%) Real GDP growth -3 -2 -1 0 1 2 3 4 5 6 1993 1996 1999 2002 2005 2008
Panel B: GDP Growth (constant 2002 dollars)
Note: The money growth series were obtained by converting the raw monthly data to quarterly arithmetic means prior to calculating rates of change. Source: Statistics Canada, CANSIM series v37151, v41690973, and v1992067.
growth have been followed, roughly four to six quarters later, by rises in inflation. The same story holds when money growth has declined. Needless to say, just as Milton Friedman (1969) famously wrote, one must also contend with the likelihood that such lags that do exist can be long and variable. Turning to real GDP growth, there is similarly visual evidence that surges in M1+ have been followed by a rise in real income growth a few quarters later, but drops in money growth appear to have been more coincident with falling real GDP growth. The rapid increase in money growth at the end of the period tantalizingly suggests a return to positive growth, although, as pointed out above, this view needs to be tempered by the rather sharp fall in velocity since early 2008.
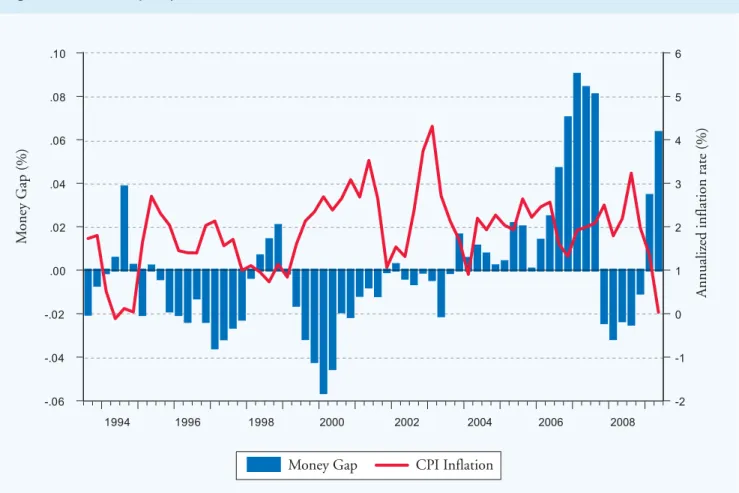
What do recent events portend for the future course of inflation in the near term? The preceding developments can be summarized neatly by the money gap concept. Figure 2 is instructive in that it reveals two features that define recent monetary policy performance. First, the sharp rise in the money gap (shown as bars) in 2006 presages the worries in central banking circles over rising inflationary pressures in 2007, later blamed on commodity prices. Clearly, loose monetary policy might be one of the culprits.8The gap disappears rather quickly in 2007 and 2008 in the aftermath of the global financial crisis. Second, considerably loose monetary policy resumes around the end of 2008, reflecting in part the actions of central banks in response to the downturn and deflationary pressures. To the
8 Monetary tightness or looseness refers to an interest rate that is higher (or lower money growth) or lower (or higher money growth) than is necessary to ensure a stable inflation rate. Among those who make the connection between loose U.S. monetary policy and the subsequent rise in commodity prices is Frankel (2008). It should also be noted that the findings based on the money gap are entirely consistent with those based on the ubiquitous Taylor rule, which reveals that, until 2006, monetary policy was too loose in both Canada
Money Gap CPI Inflation
Annualiz ed inflation rate (%) M oney G ap (%) 1994 1996 1998 2000 2002 2004 2006 2008 -.06 -.04 -.02 .00 .02 .04 .06 .08 .10 -2 -1 0 1 2 3 4 5 6
Figure 2: The Money Gap, 1993-2009
extent that the money gap is an early-warning indicator of future inflation, the current positive gap might be associated with higher future CPI inflation. In most cases, however, the rise in inflation is temporary as the money gap changes signs, leading to a reduction in subsequent inflation. The link need not be, and is not, perfect, but there is clearly a connection between the two.9
To be sure, the maintenance of loose policy will be inflationary unless central banks begin to rein in the potential for high money growth to spill over into the economy. The behaviour of velocity poses an additional problem as markets return to normal and opportunities open up to shift funds into different assets, with consequences that are difficult to predict. While the Bank of Canada has all the tools necessary to combat this prospect, the coming quarters will shed more light on future inflation. For this reason, it would be useful for the Bank to provide some guidance about its thinking on the behaviour of the monetary (and credit) aggregates to which it has decided once again to give pride of place in assessing credit conditions.10
It is clearly too much to ask that a single statistic such as the money gap provide an early warning of inflationary (or deflationary) problems ahead. Since the inflation-targeting regime is up for renewal in 2011 and aggressive fiscal policy is not likely to be scaled back until next year, there could be some value in taking monetary (and credit) aggregates and the message they convey more seriously in public than in the past. This does not imply their use as instruments of policy; rather, it suggests that a more explicit recognition that the maintenance of both inflation stability and financial stability requires talking about a broader array of variables than was the case previously. This presents both an analytical and a communications challenge, but it cannot be ignored.
9 Adam and Hendry (1999) made a similar point more than a decade ago.
10 Taylor (2009), famous for the instrument rule that bears his name, also suggests a (temporary) shift in emphasis in favour of monetary aggregates as the Fed contemplates an exit strategy. In light of this, an alternative instrument rule that might provide some guidance about future inflation prospects is the McCallum rule, which proved useful for understanding China’s monetary policy where interest rates do not convey particularly useful information about monetary conditions. See, for example, Burdekin and Siklos (2008).
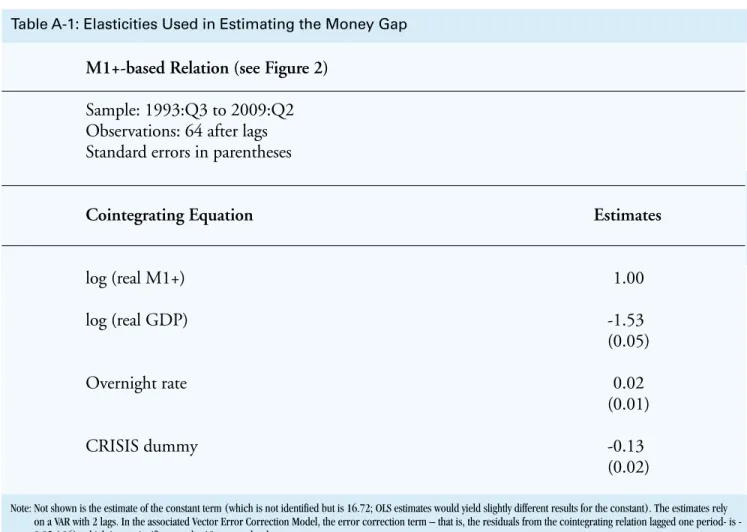
The money gap, is the difference between money growth and the growth of equilibrium money demand, itself determined by real GDP and a short-term interest rate. A positive money gap signals higher future inflation while a negative value implies a drop in inflation. The money gap is found by estimating an “error correction” model where deviations of variables from their equilibrium values, referred to in statistical terms as the cointegrating relation-ship between real M1+, real GDP and the overnight rate, are assumed to be corrected over time. Note also that a correction is added to capture the impact of the financial crisis assumed to begin in the 3rd quarter of 2007.
Table A-1 presents the results of the money gap estimations, which are based on the M1+ monetary aggregate. The money demand is a function of real GDP and the overnight rate. A dummy variable has been added to account for potential shifts in the long-run relationship among variables of the model since the beginning of the recent financial crisis.
Technical Appendix
Appendix A
M1+-based Relation (see Figure 2) Sample: 1993:Q3 to 2009:Q2 Observations: 64 after lags Standard errors in parentheses
Cointegrating Equation Estimates
log (real M1+) 1.00 log (real GDP) -1.53 (0.05) Overnight rate 0.02 (0.01) CRISIS dummy -0.13 (0.02)
Table A-1: Elasticities Used in Estimating the Money Gap
Note: Not shown is the estimate of the constant term (which is not identified but is 16.72; OLS estimates would yield slightly different results for the constant). The estimates rely on a VAR with 2 lags. In the associated Vector Error Correction Model, the error correction term – that is, the residuals from the cointegrating relation lagged one period is -0.05 (.06), which is not significant at the 10 percent level.
M1+ includes currency outside banks plus personal and non-personal chequable deposits held at chartered banks plus all chequable deposits at trust and mortgage loan companies, credit unions and caisses populaires (excluding deposits of these institutions) plus continuity adjustments.
This e-briefis a publication of the C.D. Howe Institute.
Pierre L. Siklos is Professor, Department of Economics, and Director, Viessmann European Research Centre, Wilfrid Laurier University. For more information call 416-865-1904.
This e-briefis available at www.cdhowe.org.
Permission is granted to reprint this text if the content is not altered and proper attribution is provided.
References
Adam, C., and S. Hendry. 1999. “The M1 Vector-Error-Correction Model: Some Extensions and Applications.” In Proceedings of the Bank of Canada Conference on Money, Monetary Policy, and Transmission Mechanisms.Ottawa: Bank of Canada. November.
Bank of Canada. 2009. Monetary Policy Report.Ottawa. April. Online at http://www.bankofcanada.ca/en/mpr/pdf/2009/mpr230409.pdf.
Borio, C., and P. Lowe. 2004. “Securing Sustainable Price Stability: Should Credit Come Back from the Wilderness?” BIS Working Paper 157. Basle: Bank for International Settlements. July.
Burdekin, R., and P. Siklos. 2008. “What Has Driven Chinese Monetary Policy since 1990? Investigating the People’s Bank’s Policy Rule.”Journal of International Money and Finance27 (September): 847-59.
Frankel, J. 2008. “The Effect of Monetary Policy on Real Commodity Prices.” In Asset Prices and Monetary Policy, edited by John Campbell. Chicago: University of Chicago Press.
Friedman, M. 1969. The Optimum Quantity of Money and Other Essays.Chicago: Aldine.
Hamilton, J.D. 2009. “Concerns about the Fed’s New Balance Sheet.” In The Road Ahead for the Fed, edited by J.D. Ciorciari and J.B. Taylor. Stanford, CA: Hoover Press.
Kohn, D. 2009. “Monetary Policy in the Financial Crisis.” In The Road Ahead for the Fed,edited by J.D. Ciorciari and J.B. Taylor. Stanford, CA: Hoover Press. Laidler, D.E.W., and W.B.P. Robson. 2004. Two Percent Target: Canadian Monetary Policy since 1991.Policy Study 37. Toronto: C.D. Howe Institute. Siklos, P.L. 2009. As Good as It Gets? The International Dimension to Canada’s Monetary Policy Strategy Choices.C.D. Howe Institute Commentary 292.
Toronto: C.D. Howe Institute. July.
Siklos, P.L., and A. Barton. 2001. “Monetary Aggregates as Indicators of Economic Activity in Canada: Empirical Evidence.” Canadian Journal of Economics34 (February): 1-17.
Taylor, J.B. 2009. “The Need for a Clear and Credible Exit Strategy.” In The Road Ahead for the Fed, edited by J.D. Ciorciari and J.B. Taylor. Stanford, CA: Hoover Press.