Financial
Institutions
Center
Payout Policy
by Franklin Allen Roni Michaely 01-21-BThe Wharton Financial Institutions Center
The Wharton Financial Institutions Center provides a multi-disciplinary research approach to the problems and opportunities facing the financial services industry in its search for competitive excellence. The Center's research focuses on the issues related to managing risk at the firm level as well as ways to improve productivity and performance.
The Center fosters the development of a community of faculty, visiting scholars and Ph.D. candidates whose research interests complement and support the mission of the Center. The Center works closely with industry executives and practitioners to ensure that its research is informed by the operating realities and competitive demands facing industry participants as they pursue competitive excellence.
Copies of the working papers summarized here are available from the Center. If you would like to learn more about the Center or become a member of our research community, please let us know of your interest.
Franklin Allen Richard J. Herring
Co-Director Co-Director
The Working Paper Series is made possible by a generous grant from the Alfred P. Sloan Foundation
Payout
Policy
Franklin Allen University of Pennsylvania ([email protected]) and Roni MichaelyCornell University and IDC ([email protected])
April, 2002
_____________________
Prepared for North-Holland Handbook of Economics edited by George Constantinides, Milton Harris, and Rene Stulz. We are in debt to Gustavo Grullon for his insights and help on this project. We would like to thank Harry DeAngelo, Eric Lie, Rene Stulz and Jeff Wurgler for their comments and suggestions.
Abstract
This paper surveys the literature on payout policy. We start with a description of the Miller-Modigliani payout irrelevance proposition, and then consider the effect of relaxing the assumptions on which it is based. We consider the role of taxes, asymmetric information, incomplete contracting possibilities, and transaction costs. The accumulated evidence indicates that changes in payout policies are not motivated by firms’ desire to signal their true worth to the market. Both dividends and repurchases seem to be paid to reduce potential overinvestment by management. We also review the issue of the form of payout and the increased tendency to use open market share repurchases. Evidence suggests that the rise in the popularity of repurchases increased overall payout and increased firms’ financial flexibility.
1. Introduction
How much cash should firms give back to their shareholders? And what form should payment take? Should corporations pay their shareholders through dividends or by repurchasing their shares, which is the least costly form of payout from a tax perspective? Firms must make these important decisions over and over again (some must be repeated and some need to be reevaluated each period), on a regular basis.
Because these decisions are dynamic they are labeled as payout policy. The word “policy” implies some consistency over time, and that payouts, and dividends in particular, do not simply evolve in an arbitrary and random manner. Much of the literature in the past forty years has attempted to find and explain the pattern in payout policies of corporations.
The money involved in these payout decisions is substantial. For example, in 1999 corporations spent more than $350b on dividends and repurchases and over $400b on liquidating dividends in the form of cash spent on mergers and acquisitions.1
Payout policy is important not only because of the amount of money involved and the repeated nature of the decision, but also because payout policy is closely related to, and interacts with, most of the financial and investment decisions firms make. Management and the board of directors must decide the level of dividends, what repurchases to make (and the mirror image decision of equity issuance), the amount of financial slack the firm carries (which may be a non-trivial amount; for example, at the end of 1999, Microsoft held over $17b in financial slack), investment in real assets, mergers and acquisitions, and debt issuance. Since capital markets are neither perfect nor complete, all of these decisions interact with one another.
Understanding payout policy may also help us to better understand the other pieces in this
puzzle. Theories of capital structure, mergers and acquisitions, asset pricing, and capital budgeting all rely on a view of how and why firms pay out cash.
Six empirical observations play an important role in discussions of payout policies: 1. Large, established corporations typically pay out a significant percentage of their
earnings in the form of dividends and repurchases.
2. Historically, dividends have been the predominant form of payout. Share repurchases were relatively unimportant until the mid-1980s, but since then have become an important form of payment.
3. Among firms traded on organized exchanges in the U.S., the proportion of dividend-paying firms has been steadily declining. Since the beginning of the 1980s, most firms have initiated their cash payment to shareholders in the form of repurchases rather than dividends.
4. Individuals in high tax brackets receive large amounts in cash dividends and pay substantial amounts of taxes on these dividends.
5. Corporations smooth dividends relative to earnings. Repurchases are more volatile than dividends.
6. The market reacts positively to announcements of repurchase and dividend increases, and negatively to announcements of dividend decreases.
The challenge to financial economists has been to develop a payout policy framework where firms maximize shareholders’ wealth and investors maximize utility. In such a framework payout policy would function in a way that is consistent with these observations and is not rejected by empirical tests.
The seminal contribution to research on dividend policy is that of Miller and Modigliani (1961). Prior to their paper, most economists believed hat the more dividends a firm paid, the more valuable the firm would be. This view was derived from an extension of the discounted dividends approach to firm valuation, which says that the value V0 of the firm at date 0, if the
first dividends are paid one period from now at date 1, is given by the formula:
) r + (1 D = V t t t 1 = t 0
∑
∞ (1) whereDt = the dividends paid by the firm at the end of period t
rt = the investors' opportunity cost of capital for period t
Gordon (1959) argued that investors’ required rate of return rt would increase with retention of
earnings and increased investment. Although the future dividend stream would presumably be larger as a result of the increase in investment (i.e., Dt would grow faster), Gordon felt that
higher rt would overshadow this effect. The reason for the increase in rt would be the greater
uncertainty associated with the increased investment relative to the safety of the dividend.
Miller and Modigliani (1961) pointed out that this view of dividend policy incomplete and they developed a rigorous framework for analyzing payout policy. They show that what really counts is the firm’s investment policy. As long as investment policy doesn’t change, altering the mix of retained earnings and payout will not affect firm’s value. The Miller and Modigliani framework has formed the foundation of subsequent work on dividends and payout policy in general. It is important to note that their framework is rich enough to encompass both dividends and repurchases, as the only determinant of a firm’s value is its investment policy.
managers and markets care about payouts, and dividends in particular. The theoretical work on this issue suggests five possible imperfections that management should consider when it determines dividend policy:
(i) Taxes If dividends are taxed more heavily than capital gains, and investors cannot use dynamic trading strategies to avoid this higher taxation, then minimizing dividends is optimal.
(ii) Asymmetric Information If managers know more about the true worth of their firm, dividends can be used to convey that information to the market, despite the costs associated with paying those dividends. (However, we note that with asymmetric information, dividends can also be viewed as bad news. Firms that pay dividends are the ones that have no positive NPV projects in which to invest.) (iii) Incomplete Contracts If contracts are incomplete or are not fully enforceable,
equityholders may, under some circumstances, use dividends to discipline managers or to expropriate wealth from debtholders.
(iv) Institutional Constraints. If various institutions avoid investing in non- or low-dividend-paying stocks because of legal restrictions, management may find that it is optimal to pay dividends despite the tax burden it imposes on individual investors.
(v) Transaction Costs. If dividend payments minimize transaction costs to equityholders (either direct transaction costs or the effort of self control), then positive dividend payout may be optimal.
In section 2 we elaborate further on some of the empirical observations about corporate payout policies. Section 3 reviews the Miller and Modigliani analysis. Subsequent sections recount the literature that has relaxed their assumptions in various ways.
2. Some Empirical Observations on Payout Policies
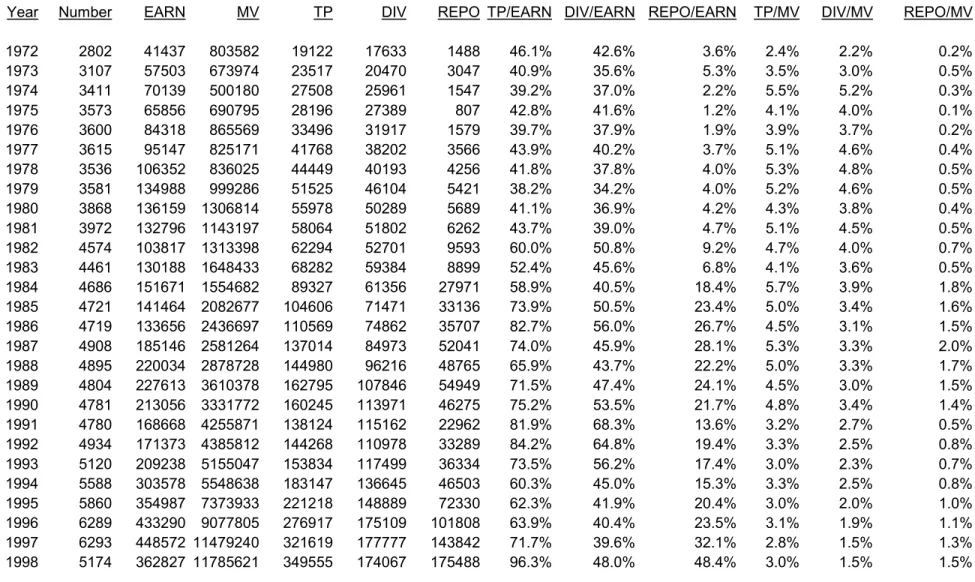
In the previous section we state six important empirical findings about corporate payout policies. Table 1 and Figure 1 illustrate the first observation that corporations pay out a substantial portion of their earnings. Table 1 shows that for U.S. industrial firms, dollar expenditures on both dividends and repurchases have increased over the years.
The table also illustrates the second empirical observation above. It shows that dividends have been the dominant form of payout in the early period, but that repurchases have become more and more important through the years. For example, during the 1970s the average dividend payout was 38% and the average repurchase payout was 3%. By the 1990s the average dividend payout was 58% and the average repurchase payout was 27%. From these numbers it appears U.S. corporations paid out over 80% of their earnings to shareholders.2 Clearly, payments to shareholders through dividends and repurchases represent a significant portion of corporate earnings. However, we note that these numbers are tilted towards large firms since we calculate payout as: (ΣDiv/ΣEarnings). In addition, aggregate earnings (i.e., the denominator) contain many negative earnings. This is especially true in the later period, when more and more small, not yet profitable, firms registered on Nasdaq. When we calculate payout for each firm and then average across firms (equal weighted) the overall payout relative to earnings is around 25%. (Grullon and Michaely, 2002, Figure 1).
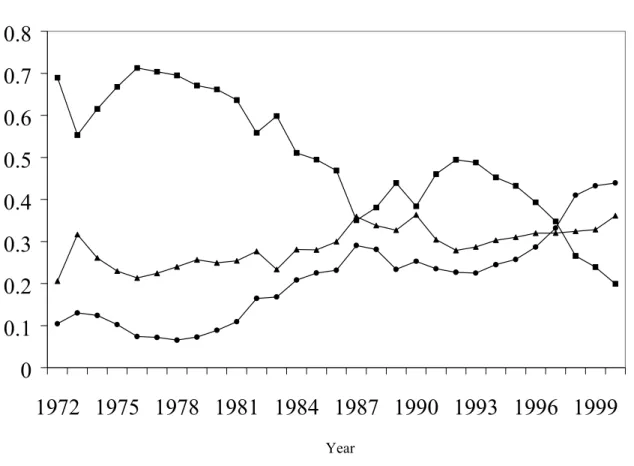
To further illustrate the second observation, Figure 1 shows the evolution of dividend yield (total dividends over market value of equity), repurchase yield (repurchases over market value of equity) and payout yield (dividends plus repurchases over market value of equity) since the early 1970s. Whether we examine repurchases relative to earnings or to the market value of the firm, it is clear that repurchases as a payout method were not a factor until the mid-1980s. It is interesting that in the 1990s, firms’ average total yield remained more or less constant while the dividend yield declined and the repurchase yield increased.
The third observation is that dividends are now being paid by fewer firms. As we can see in Figure 2, Fama and French (2001) show that the proportion of firms that pay dividends (among all CRSP listed firms) has fallen dramatically over the years, regardless of their earnings level. Prior to the 1980’s firms that initiated a cash payment usually did so with dividends. But since the beginning of the 1980s, most firms have initiated cash payments with repurchases. Figure 3 documents this observation for U.S. industrial firms. We define a cash distribution initiation as the first time after 1972 that a firm pays dividends and/or repurchases shares. Figure 3 shows that the proportion of firms that initiated a cash distribution by using only share repurchases increased from less than 27% in 1974 to more than 81% in 1998. Share repurchase programs have now become the preferred method of payout among firms initiating cash distributions to their equityholders. (For earlier evidence on trend in repurchases see Bagwell and Shoven, 1989)
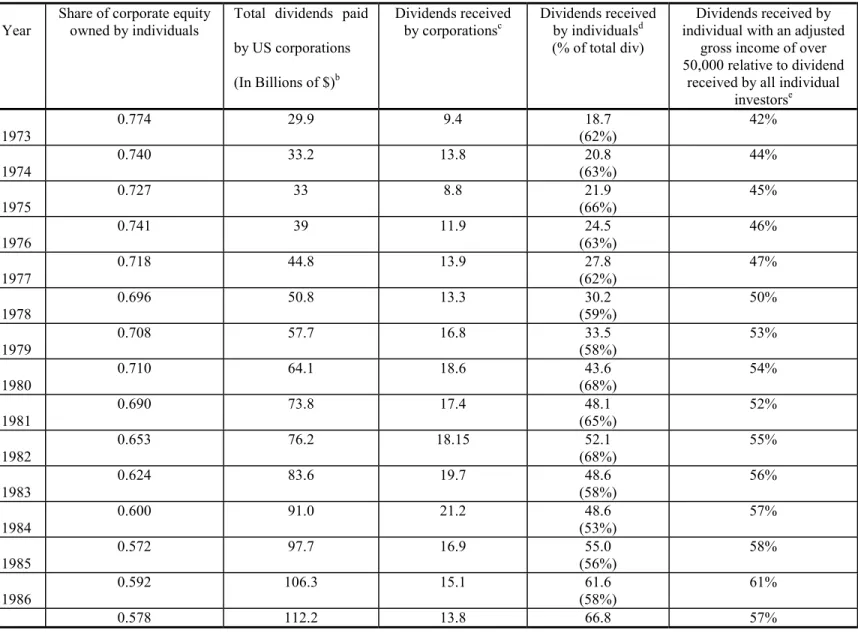
The fourth observation is that individuals pay substantial taxes on the large amounts of dividends that they receive. We collected information from the Federal Reserve’s Flow of Funds Accounts for the United States, and from the IRS, SOI Bulletin about total dividends paid and the amounts received by individuals and corporations for the years 1973-1996. Table 2 presents
the results. In most of the years in our sample (1973-1996) individuals received more than 50% of the dividends paid out by corporations. Moreover, most of these dividends were received by individuals in high tax brackets (those with annual gross income over $50,000).
Peterson, Peterson, and Ang (1985) conducted a study of the tax returns of individuals in 1979. More than $33b of dividends were included in individuals’ gross income that year. The total of dividends paid out by corporations in 1979 was $57.7b, so individuals received over two-thirds of that total. The average marginal tax rate on these dividends received by individuals (weighted by dividends received) was 40%.
The fact that individuals pay considerable taxes on dividends has been particularly important in the dividend debate, because there appears to be a substantial tax disadvantage to dividends compared to repurchases. Dividends are taxed as ordinary income. Share repurchases are taxed on a capital gains basis. Since the tax rate on capital gains has usually been lower than the tax rate on ordinary income, investors had an advantage if firms repurchased, rather than paid dividends. Even after the 1986 Tax Reform Act (TRA) when the tax rates on ordinary income and capital gains were equal for several years, there was a tax disadvantage to dividends because capital gains were only taxed on realization. In the 2001 tax code, long-term capital gains are lower than ordinary income for most individual investors. For example, an investor in the highest marginal tax bracket pays 39.6% taxes on dividends and only 20% tax on long-term capital gains. Black (1976) calls the fact that corporations pay such large amounts of dividends despite the existence of another, relatively untaxed, payout method, the "dividend puzzle."
The fifth observation is that corporations smooth dividends. From Table 1, we can see that during the entire 1972-1998 period, aggregate dividends fell only twice (in 1992 and in 1998), and then only by very small amounts. On the other hand, aggregate earnings fell five
times during the same time period and the drop was larger. Unlike dividends, repurchases are more volatile and more sensitive to economic conditions. During the recession in the early 1970s, firms cut repurchases. They did this again during the recession of the early 1990s. Overall, between 1972 and –1998, aggregate repurchases fell seven times.
Firms usually increase dividends gradually and rarely cut them. Table 3 shows the number of dividend increases and decreases for over 13,000 publicly held issues, for the years 1971 to 2001 (Moody’s dividend records, 1999 and S&P’s dividend book, 2001). In each year, the number of dividend cuts is much smaller than the number of dividend increases. For example, in 1999, there were 1,763 dividend increases or initiations, but only 121 cuts or omissions.
In a classic study, Lintner (1956) showed that dividend-smoothing behavior was widespread. He started with over 600 listed companies and selected 28 to survey and interview. Linter did not select these companies as a statistically representative sample, but chose them to encompass a wide range of different situations.
Lintner made a number of important observations concerning the dividend policies of these firms. The first is that firms are primarily concerned with the stability of dividends. Firms do not set dividends de novo each quarter. Instead, they first consider whether they need to make any changes from the existing rate. Only when they have decided a change is necessary do they consider how large it should be. Managers appear to believe strongly that the market puts a premium on firms with a stable dividend policy.
Second, Lintner observed that earnings were the most important determinant of any change in dividends. Management needed to explain to shareholders the reasons for its actions, and needed to base its explanations on simple and observable indicators. The level of earnings
was the most important of these. Most companies appeared to have a target payout ratio; if there was a sudden unexpected increase in earnings, firms adjusted their dividends slowly. Firms were very reluctant to cut dividends.
Based on interviews of the 28 firms’ management teams, Lintner reported a median target payout ratio of 50%. Despite the very small sample and the fact that the study was conducted nearly half a century ago, the target payout ratio is not far from what we present in table 1 for all U.S. industrial firms over a much longer time period.
Lintner's third finding was that management set dividend policy first. Other policies were then adjusted, taking dividend policy as given. For example, if investment opportunities were abundant and the firm had insufficient internal funds, it would resort to outside funds.
Lintner suggested that the following model captured the most important elements of firms' dividend policies. For firm i,
D*it = αiEit, (2)
Dt - Dt-1 = ai + ci(D*it - Di(t-1)) + uit, (3)
where for firm i
D*it = desired dividend payment during period t
Dit = actual dividend payment during period t αi = target payout ratio
Eit = earnings of the firm during period t
ai = a constant relating to dividend growth
ci = partial adjustment factor
uit = error term
Fama and Babiak (1968) undertook a comprehensive study of the Lintner model's performance, using data for 392 major industrial firms over the period 1946 through 1964. They also found the Lintner model performed well. Over the years, other studies have confirmed this.
The sixth observation is that the market usually reacts positively to announcements of increases in payouts and negatively to announcements of dividend decreases. This phenomenon has been documented by many studies, such as Pettit (1972), Charest (1978), Aharony and Swary (1980), and Michaely, Thaler, and Womack (1995) for dividends, and by Ikenberry, Lakonishok, and Vermaelen (1995) for repurchases. This evidence is consistent with managers knowing more than outside shareholders, and dividends and repurchases changes provide some information on future cash flows (e.g., Bhattacharya, 1979, or Miller and Rock, 1985), or about the cost of capital (Grullon, Michaely and Swaminathan, 2002, Grullon and Michaely 2000). The evidence is also consistent with the notion that when contracts are incomplete, higher payouts can sometimes be used to align management’s interest with that of shareholders’, as suggested by Grossman and Hart (1982), Easterbrook (1984) and Jensen (1986).
3. The Miller-Modigliani Dividend Irrelevance Proposition
Miller and Modigliani (1961) showed that in perfect and complete capital markets, a firm's dividend policy does not affect its value. The basic premise of their argument is that firm value is determined by choosing optimal investments. The net payout is the difference between earnings and investment, and is simply a residual. Because the net payout comprises dividends and share issues/repurchases, a firm can adjust its dividends to any level with an offsetting change in shares outstanding. From the perspective of investors, dividend policy is irrelevant,
because any desired stream of payments can be replicated by appropriate purchases and sales of equity. Thus, investors will not pay a premium for any particular dividend policy.
To illustrate the argument behind the theorem, suppose there are perfect and complete capital markets (with no taxes). At date t, the value of the firm is
Vt = present value of payouts
where payouts include dividends and repurchases. For ease of exposition, we initially consider the case with two periods, t and t + 1. At date t, a firm has
- earnings, Et, (earned previously) on hand.
It must decide on
- the level of investment, It
- the level of dividends, Dt
- the amount of shares to be issued, ∆St (or repurchased if ∆St is negative)
The level of earnings at t + 1, denoted Et+1(It, θt+1), depends on the level of investment It and a
random variable θt+1. Since t + 1 is the final date, all earnings are paid out at t + 1. Given
complete markets, let
pt(θt+1) = time t price of consumption in state θt+1
Then it follows that
Vt = Dt - ∆St + ∫pt(θt+1)Et+1(It, θt+1)dθt+1 (4)
The sources and uses of funds identity says that in the current period t:
Et + ∆St = It + Dt (5)
Using this to substitute for current payouts, Dt - ∆St, gives
From equation (6) we can immediately see the first insight from Miller and Modigliani's analysis. . Since Et is given, the only determinant of the value of the firm is current investment
It.
This analysis can be extended to the case with more than two periods. Now
Vt = Et - It + Vt+1 (7)
where
Vt+1 = Et+1(It, θt+1) - It+1 + Vt+2 (8)
and so on, recursively. It follows from this extension that it is only the sequence of investments It, It+1, ... that is important in determining firm value. Firm value is maximized by making an
appropriate choice of investment policy.
The second insight from the Miller-Modigliani analysis concerns the firm's dividend policy, which involves setting the value of Dt each period. Given that investment is chosen to
maximize firm value, the firm's payout in period t, Dt - ∆St, must be equal to the difference
between earnings and investment, Et - It. However, the level of dividends, Dt, can take any
value, since the level of share issuance, ∆St, can always be set to offset this. It follows that
dividend policy does not affect firm value at all. It is only investment policy that matters.
The analysis above implicitly assumes 100% equity financing. It can be extended to include debt financing. In this case management can finance dividends by using both debt and equity issues. This added degree of freedom does not affect the result. As with equity-financed dividends, no additional value is created by debt-financed dividends, since capital markets are perfect and complete so the amount of debt does not affect the total value of the firm.
The third and perhaps most important insight of Miller and Modigliani's analysis is that it identifies the situations in which dividend policy can affect firm value. It could matter, not
because dividends are "safer" than capital gains, as was traditionally argued, but because one of the assumptions underlying the result is violated.
Perfect and complete capital markets have the following elements: 1. No taxes
2. Symmetric information 3. Complete contracting possibilities 4. No transaction costs
5. Complete markets
It is easy to see the role played by each of the above assumptions. The reason for Assumption 1 is clear. In the no-taxes case, it is irrelevant whether a firm pays out dividends or repurchases shares; what is important is Dt - ∆St. If dividends and share repurchases are taxed
differently, this is no longer the case. Suppose, for example, dividends are taxed at a higher rate than capital gains from share repurchases. Then it is optimal not to pay dividends, but instead to pay out any residual funds by repurchasing shares. In section 5 we discuss the issues raised by relaxing Assumption 1.
Assumption 2 is that all participants (including the firms) have exactly the same information set. In practice, this is rarely the case. Managers are insiders and are likely to know more about the current and future prospects of the firm than outsiders. Dividends can reveal some information to outsiders about the value of the corporation. Moreover, insiders might even use dividends to deliberately change the market's perception about the firm's value. Again, dividend policy can affect firm value. Sections 6.1 and 7.1 consider the effect of asymmetric information.
The complete contracting possibilities specified in Assumption 3 mean that there is no agency problem between managers and security holders, for example. In this case, motivating the decisions of managers is possible through the use of enforceable contracts. Without complete contracting possibilities, dividend policy could, for example, help ensure that managers act in the interest of shareholders. A high payout ratio cause management to be more disciplined in the use of the firm's resources and consequently increase firm value. We cover these issues in sections 6.2 and 7.2.
Assumption 4 concerns transaction costs. These come in a variety of forms. For example, firms can distribute cash through dividends and raise capital through equity issues. If flotation costs are significant, then every trip to the capital market will reduce the firm's value. This means changing dividend policy can change the value of the firm. By the same token, when investors sell securities and make decisions about such sales, the transaction costs that investors incur can also result in dividend policy affecting the value of the firm. Section 8 develops several transaction-cost-related theories of dividend policy.
Assumption 5 is that markets are complete. To illustrate why this is important, assume that because trading opportunities are limited, there are two groups with different marginal rates of substitution between current and future consumption. By adjusting its dividend policy, a firm might be able to increase its value by appealing to one of these groups. The literature has paid very little attention to explanations such as these for dividend policy. Nevertheless, these explanations could be important if some investors wish to buy stocks with a steady income stream, and markets are incomplete because of high transaction costs. Further analysis in this area might provide some insights into dividend policy.
Another issue that is central to our survey is the form of the payout. One area of significant growth in the literature is related to the role of repurchases as a form of payout, not only because repurchases have become more popular (Table 1), but also because of the research concerning the reasons for repurchases and the interrelation between dividends and repurchases. In section 4 we define corporate payout, both conceptually and empirically. In section 9 we review in detail the recent developments concerning repurchases.
4. How Should We Measure Payout?
The Miller and Modigliani framework defines payout policy as the net payout to shareholders. However, most empirical work measures payout only by the amount of dividends the firms pay. Such studies do not consider repurchases. Neither do they factor in either net payout (accounting for capital raising activities) or cash spent on mergers and acquisitions.
If we wish to find out how much cash corporations pay out (relative to their earnings) at the aggregate level, we need to consider some of the aggregate measures, such as the one presented in Table 1, namely, aggregate dividends plus aggregate repurchases relative to aggregate earnings. But even this measure is incomplete. First, shareholders also receive cash payouts from corporations through mergers and acquisitions that are accomplished through cash transactions. That is, shareholders of the acquired firms receive a cash payment that can be viewed as a liquidating (or final) dividend.
Using data from SDC, Table 4 presents the magnitude of such payments. For each year we calculate the total dollar amount that was paid to U.S. corporations in all cash M&A deals. (Note that this figure is a lower bound, since it does not account for deals in which payment was partially in cash and partially in stocks.) The amount is not trivial and it does vary by year. This
type of liquidating dividend seems to have a significant weight in the aggregate payout of U.S. corporations. For example, in 1999, proceeds from cash M&As were more than the combined cash distributed to shareholders through dividends and repurchases combined.
Our next measure accounts not only for the outflow of funds from corporations to their shareholders, but also for the inflow of funds. Columns 3 and 4 in Table 4 present the dollar amount of capital raised by U.S. corporations through SEOs and IPOs. Column 5 reports the net amount (cash from M&As minus proceeds from IPOs and SEOs). It is clear that these are significant amounts. When we compare Tables 1 and 4, we see that in the last decade these amounts are as large as the cash payments through dividends and repurchases combined. We are also interested to see its impact on the overall aggregate payout. Clearly, in some years the aggregate payout is higher than after-tax earnings.
One can also define the aggregate payout as the total transfer of cash from the corporate sector to the private sector. This definition contains three elements: dividends paid to individual investors, repurchase of shares from individual investors, and net cash M&A activity where the proceeds are going to the private sector.
Using this definition and information from the IRS Statistics of Income and the Federal Reserve Flow of Funds publications, we can recalculate a rough measure of the total payout to the private sector over the years. We base this measure on the total dividends, repurchases, and cash M&A activity. We assume that the proportional holdings of each group (individuals, corporations and institutions) is the same for all firms in the economy.
In Table 2, we calculate the portion of shares held by individual investors (using information from Table L-312 from the Federal Reserve Flow of Funds).3 Using this ratio, we
can approximate the portion of repurchased shares and net cash M&As that went to the private sector. For example, in 1995, the private sector received $94b in dividends (see Table 2), $82b in cash M&As (57.9% of shares owned by individuals multiplied by $143b of net cash M&As, see Tables 2 and 4), and roughly $50b in repurchases (57.9% of shares owned by individuals multiplied by $72.3b of repurchases; see Tables 1 and 2). We note that out of total cash payments to the private sector of around $219b, less than half is through “formal” dividends. Table 5 presents the cash payout that goes to the private sector (dividends, repurchases, and net cash M&As) for the various years.
These issues have not received much attention in the literature. We believe they should. It is difficult to take a position on payout policy before we correctly measure it.
An equally interesting issue is to analyze the payout, its components, and the relation between payout and earnings at the firm level. For example, we think it would be interesting to investigate the type of firm that gives its shareholders liquidating dividends, and how such dividends relate to other types of payout. Analyzing the interaction between total payout, dividends, and the recent surge in repurchases would also require information on individual firms’ payout policies. But at the firm level, there may be another problem in the definition of payout relative to earnings, since a significant portion of firms have negative earnings. For these firms, it is not possible to define a total payout ratio, a repurchase payout ratio, or a dividend payout ratio.
Our discussion highlights several important points. First, in our opinion, the main issue is not whether one measure is better than another. Instead, we ask, what is the question that we are trying to answer? This question in turn should have an impact on which definition of payout we use.
The issue of how to define payout is also very relevant to the excess volatility literature. For example, Ackert and Smith (1993) showed that the results of variance-bound tests depend on how we measure cash distributions to shareholders. When they used only stated dividends, they found evidence of excess volatility. When the payout measure included share repurchase and takeover distributions as well, they did not find evidence of excess volatility. It is likely that using the net total payout to investors will add some variability to cash flows. It may also reduce even further the discrepancy between cash flow volatility and price volatility. In our opinion, this issue is worthy of further research.
Second, it is clear that most of the finance literature has analyzed the payout policy question using only the very narrow definition of dividend payout. Some studies have attempted to analyze repurchase payout. But with only a few exceptions, the literature does not cover the issue of total payout, its composition, and determination. This lacuna is understandable, given the fact that over many years, dividends were the most prominent form of payout. But this is not so anymore. Thus, to a great extent our review article reflects the current literature. We devote more space and put more emphasis on dividends relative to the other forms of payouts. We hope future research will explore the other aspects of payout policy and their implications.
5. Taxes
Much of the literature on payout policy focuses on the importance of taxes, and tries to reconcile several of the empirical observations discussed in our introduction. Firms pay out a large part of their earnings as dividends; many of the recipients are in high tax brackets. Firms did not traditionally use repurchases as a method of payout. The basic aim of the tax-related
literature on dividends has been to investigate whether there is a tax effect: All else equal, we ask if firms that pay out high dividends are less valuable than firms that pay out low dividends.
Two basic ideas are important to understanding how to interpret the results of these investigations:
1. Static clientele models:
(i) Different groups, or "clienteles," are taxed differently. Miller and Modigliani (1961) argued that firms have an incentive to supply stocks that minimize the taxes of each clientele. In equilibrium, no further possibilities for reducing taxes will exist and all firms will be equally priced.
(ii) A particular case (labeled as the simple static model) is when all investors are taxed the same way, and capital gains are taxed less than dividend income. In this case, the optimal policy is not to pay dividends. Firms with high dividend yields would be worth less than equivalent firms with low dividend yields.
2. Dynamic clientele model: If investors can trade through time, tax liabilities can be reduced even further. The dividend-paying stock will end up (just before the ex-dividend day) in the hands of those who are taxed the least when the dividend is received. Such trades will be reversed directly after the ex-day.
The empirical studies of dividend policy have tried to distinguish between the different versions of these models by attempting to identify one or more of the following:
(i) Is there a tax effect so that low-dividend-paying stocks are more valuable than high dividend stocks?
(ii) Do static tax clienteles exist so that the marginal tax rates of high-dividend stockholders are lower than those of low-dividend stockholders?
(iii) Do dynamic tax clienteles exist so that there is a large volume around the ex-dividend day, and low-tax-rate investors actually receive the ex-dividend?
This literature has traditionally been divided into CAPM-based studies and ex-dividend day studies. In our view, more insight is gained by comparing static to dynamic models. In the static models, investors trade only once. Thus, with the objective of minimizing taxes (keeping all else constant), investors must make a long-term decision about their holdings. The buy-and-hold CAPM studies, such as Litzenberger and Ramaswamy (1979), and Miller and Scholes (1982), fall into this category. The Elton and Gruber (1970) study is similar in that respect. Investors are allowed to trade only once, either on the cum-day or on the ex-day, but not on both. As we shall show, a static view is appropriate when transaction costs are exceedingly high, or when tax payments have been reduced to zero in the static clientele model.
In contrast, in dynamic models, investors are allowed to take different positions at different times. These models take into account risk, taxes, and transaction costs. Just before the ex-day, dividend-paying stocks can flow temporarily to the investors who value them the most.
5.1 Static models
First, we look at the special case in which all investors are taxed in the same way and the tax rate on dividend income is higher than the tax rate on capital gains income. In otherwise perfect capital markets, the optimal policy is to pay no dividends. Equityholders are better off receiving profits through repurchases or selling their shares so that they pay capital gains taxes rather than the higher taxes on dividends. Most U.S. corporations have not followed this
scenario. For a long time, many firms have paid dividends regularly and have rarely repurchased their shares. On the face of it, this behavior is puzzling, especially if we believe that agents in the market place behave in a rational manner. The basic assumption of this simple static model is that for all investors there is a substantial tax disadvantage to dividends because they are taxed (heavily) as ordinary income, while share repurchases are taxed (lightly) as capital gains.
But even if the statutory tax rates on dividends and capital gains were equal (and usually, they have not been), from a tax perspective receiving unrealized capital gains is superior to dividend payments.
The first reason is that capital gains do not have to be realized immediately, and thus the associated tax can be postponed. An investor’s ability to postpone may generate considerable value. Imagine a stock with an expected annual return of 15%, and an investor with a marginal tax rate of 20% on long-term capital gains. Say the investor has $1000 and an investment horizon of ten years, and consider whether she should realize gains at the end of each year or wait and realize all gains at the end of the tenth year. Under the first strategy, her final wealth would be $3,106. Under the second strategy it would be $3,436, a substantial difference.
Second, investors can choose when to realize capital gains (unlike dividends, for which they have no choice in the timing). In a more formal setting, Constantinides (1984) showed that investors should be willing to pay for this option to delay capital gains realization, and labeled it the “tax timing option.”
In reality, of course, not all investors are taxed as individuals. Many financial institutions, such as pension funds and endowments, do not pay taxes. They have no reason to prefer capital gains to dividends, or vice versa. Individuals hold stocks directly or indirectly, and so do corporations. One of the principal reasons corporations hold dividend-paying stocks as
both a form of near-cash assets and as an investment is because under the U.S. tax code, a large fraction of intercorporate dividends are exempt from taxation, but intercorporate (or government) interest payments are not. Under the old tax code, only 15% of dividends, deemed taxable income, were taxed, so the effective tax rate on dividends received was 0.15 x 0.46 (marginal corporate tax rate) = 6.9%. But corporations had to pay the full amount of taxes on any realized gains. Under the current tax code, 30% of dividends are taxed.4
In a clientele model, taxpayers in different groups hold different types of assets, as illustrated in the stylized example below. Individuals hold low-dividend-payout stocks. Medium-dividend-payout firms are owned by people who can avoid taxes, or by tax-free institutions. Corporations own high-dividend-payout stocks. Firms must be indifferent between the three types of stock, or they would increase their value by issuing more of the type that they prefer.
How are assets priced in this model? Since firms must be indifferent between the different types of assets, the assets must be priced so they are equally desirable. To show how this works, we use the following example:
Suppose there are three groups that hold stocks:
4 Prior to the 1986 Tax Reform Act (TRA), individual investors who held a stock for at least six months paid a lower tax on capital gains (20%) than on ordinary dividends (50%). The TRA eliminated all distinctions between capital gains and ordinary income. However, it is still possible to defer taxes on capital gains by not realizing the gains. Before the 1986 TRA, a corporation that held the stock of another corporation paid taxes on only 15% of the dividend. Therefore, the effective tax rate for dividend income was 0.15 x 0.46 = 0.069. After the TRA, the corporation income tax rate was reduced to 34%. The fraction of the dividend exempted from taxes was also reduced to 70%. The effective tax rate for dividend income was therefore increased to 0.3 x 0.34 = 0.102. In both time periods, the dividend exemption could be as high as 100% if the dividend-paying corporation was a wholly
(i) Individuals who are in high tax brackets and pay high taxes on dividend-paying stocks. These investors are subject to a 50% tax rate on dividend income and a 20% tax rate on capital gains.
(ii) Corporations whose tax situation is such that they pay low taxes on stocks that pay dividends. Their tax rate on dividend income is 10% and is 35% on capital gains.
(iii) Institutions that pay no taxes. Their opportunity cost of capital, determined by the return available in investment other than securities, is 10%.
Assume that these groups are risk neutral, so risk is not an issue. All that matters is the after-tax returns to the stocks. (We note that in this stylized market, a tax clientele is a result of both the risk neutrality assumption and the trading restrictions.)
There are three types of stock. For simplicity, we assume that each stock earnings per share of $100. The only difference between these shares is the form of payout. Table 6 describes the after-tax cash flow for each group if they held each type of stock.
In this example, individuals with high tax brackets will hold low-payout shares, corporations will hold the high-payout shares, and institutions will be prepared to hold all three. The asset holdings of these three groups are shown in Table 7.
To show why the shares must all have the same price, if the price of low-payout shares was $1050 and the prices of the high- and medium-payout stocks was $1000, what would happen? High- and medium-payout firms would have an incentive to change their dividend policies and increase the supply of low-payout stocks. This change would put downward pressure on the price of low payout stock. What amount of stock do investors demand? Individuals would still be prepared to buy the low-payout stock, since $80/$1050 = 7.62%,
which is greater than the 6.5% ($65/$1000) they would obtain from holding medium-payout stocks, or the 5% ($50/$1000) they would obtain from holding low-payout stocks. What about institutions? They’ will not be prepared to hold low-payout stocks, since the return on them is $100/$1050 = 9.52%. This return is less than the 10% ($100/$1000) they can get on the other two stocks and the opportunity cost they obtain from holding foreign assets, so they will try to sell. Again, there is downward pressure on the price of low-payout stock. Therefore, the price must fall from $1050 to $1000 for equilibrium to be restored. A similar argument explains why the prices of other stocks are also $1000. Thus, in equilibrium, the price is independent of payout policy and dividend policy is irrelevant, as in the original Miller and Modigliani theory.5
Several studies have attempted to distinguish between the case of the static model in which everybody is taxed the same, and the static clientele model in which investors are taxed differently. Perhaps the easiest way to make the distinction is to investigate the relation between the marginal tax rates of stockholders and the amount of dividends paid.
Blume, Crockett, and Friend (1974) found some evidence from survey data that there is a modest (inverse) relation between investors’ tax brackets and the dividend yield of the stocks they hold. Lewellen, Stanley, Lease and Schlarbaum (1978), using individual investor data supplied by a brokerage firm, found very little evidence of this type of effect. Both studies indicate that investors in high tax brackets hold substantial amounts of dividend-paying stock.
Table 2 corroborates these findings for the last 30 years. It is evident that individuals in high tax brackets hold substantial amounts of dividend-paying stocks. There is no evidence that their dividend income relative to capital gains income is lower than that of investors in low tax
5 The equilibrium here is conceptually different from the one in Miller (1977). Miller presents an equilibrium in which there is a strict clientele. In the equilibrium here, potential arbitrage by institutions ensures one price for all stocks, regardless of their dividend policy. The existence of a strict tax-clientele is inconsistent with no-arbitrage.
brackets. According to the clientele theory, this phenomenon should not occur. For example, firms should be able to increase their value by switching from a policy of paying dividends to repurchasing shares.
Elton and Gruber (1970) sought to identify the relation between marginal tax rates and dividend yield by using ex-dividend date price data. They argued that when investors were about to sell a stock around its ex-dividend date, they would calculate whether they were better off selling just before it goes dividend, or just after. If they sold before the stock went ex-dividend, they got a higher price. Their marginal tax liability was on the capital gain, represented by the difference between the two prices. If they sold just after, the price would have fallen because the dividend had been paid. They would receive the dividend plus this low price, and their marginal tax liability would be their personal tax rate times the dividend. In this setting, we can make a direct comparison between the market valuation of after-tax dividend dollars and after-tax capital gains dollars. In equilibrium, stocks must be priced so that individuals’ marginal tax liabilities are the same for both strategies.
Assuming investors are risk neutral and there are no transaction costs, it is necessary that:
where
PB = stock price cum-dividend (the last day the stock is traded with the
dividend)
PA = expected stock price on the ex-dividend day (the first day the stock is
traded without the dividend) P0 = stock price at initial purchase
D = dividend amount
(
P -P)
=P -t(
P -P)
+D( )
1-t t
tg = personal tax rate on capital gains
td = personal tax rate on dividends.
The left-hand side of (9) represents the after-tax receipts the seller would receive if he sold the stock cum-dividend and had bought it originally for P0. The right-hand side represents the
expected net receipts from sale on the ex-dividend day. Rearranging,
. t -1 t -1 = D P -P g d A B (10)
If there are clienteles with different tax brackets, the tax rates implied by the ratio of the price change to the dividend will differ for stocks with different levels of dividends. The implied tax rate will be greater the higher the dividend yield, and, hence, the lower the tax bracket of investors. Elton and Gruber find strong evidence of a clientele effect that is consistent with this relation.
5.1.1 The role of risk
In the simplest versions of the theories presented above, risk has been ignored. In practice, because risk is likely to be of primary importance, it must be explicitly incorporated in the analysis.
As Long (1977) pointed out, there is an implicit assumption in the argument of a tax clientele that when there is risk, there are redundant securities in the market. An investor can achieve the desired portfolio allocation in risk characteristics without regard to dividend yield. In other words, investors can create several identical portfolios in all aspects but dividend yield.
Keim (1985) presented evidence that stocks with different yields also have different risk characteristics. Zero-dividend-yield stocks and stocks with low –dividend –yields have
significantly higher betas than do high-yield stocks. This finding implies that it may be a nontrivial task to choose the optimal risk-return tradeoff while ignoring dividend yield.
Depending on the precise assumptions made, some models that incorporate risk are similar to the simple static model, in that there is a tax effect and dividend policy affects value. On the other hand, other models are similar to the static clientele model in that there is no tax effect and dividend policy does not affect value. Therefore, most of the literature has focused on the issue of whether or not there is a tax effect.
Brennan (1970) was the first to develop an after-tax version of the CAPM. Litzenberger and Ramaswamy (1979, 1980) extend his model to incorporate borrowing and short-selling constraints. In both cases, the basic result is that for a given level of risk, the compensation for a higher dividend yield is positively related to the differential taxes between dividends and capital gains:
(
R -R)
=a +a +a(
d -R)
E it ft 1 2βit 3 it ft (11)
Equation (11) describes the equilibrium relation between a security’s expected return E(Rit), its
expected dividend yield (dit), and its systematic risk (βit). Finding a significantly positive a3 is
interpreted as evidence of a tax effect. That is, two stocks with the same risk exposure (same beta) will have the same expected return only if they have the same dividend yield. Otherwise, the stock with the higher dividend yield will have a higher expected return to compensate for the higher tax burden associated with the dividend.
Several researchers have tested such a relation, including Black and Scholes (1974), Blume (1980), Morgan (1982), Poterba and Summers (1984), Keim (1985), Rosenberg and Marathe (1979), Miller and Scholes (1982), Chen, Grundy, and Stambaugh (1990), and Kalay
and Michaely (2000). The empirical results are mixed. Several of these studies find a positive yield coefficient, which they attribute to differential taxes.
Black and Scholes (1974) performed one of the earliest (and one of the most influential) tests. Using annual data, and a slightly different version of equation (11), they tested the tax effect hypothesis:
[
R~ -]
+(
d -d)
/d + , i=1,...,N + = R~i γ0 m γ0 βi γ1 i m m εi (12) whereR~i = the rate of return on the ith portfolio
γ0 = an intercept term that should be equal to the risk-free rate, Rf, based on the CAPM
R~m= the rate of return on the market portfolio βi = the systematic risk of the ith portfolio
γ1 = the dividend impact coefficient
di = the dividend yield on the ith portfolio, which is measured as the sum of dividends paid
during the previous year divided by the end-of-year stock price
dm= the dividend yield on the market portfolio measured over the prior 12 months εi = the error term
To test the tax effect, Black and Scholes formed portfolios of stocks and used a long-run estimate of dividend yield (the sum of prior-year dividends divided by year-end price). Their null hypothesis was that the dividend-yield coefficient is not significantly different from zero. This hypothesis cannot be rejected for the entire time period (1936 through 1966) or for any of the ten-year subperiods. Black and Scholes concluded that “... it is not possible to demonstrate that
the expected returns on high yield common stocks differ from the expected return on low yield common stocks either before or after taxes.”
In a series of studies, Litzenberger and Ramaswamy (1979, 1980, 1982) re-examined this issue.6 Their experimental design differs from that of Black and Scholes (1974) in several important aspects. They use individual instead of grouped data, and they correct for the error in variables problems in the beta estimation by using maximum likelihood procedures. Perhaps most important, they classify stock into yield classes by using a monthly definition of dividend yield, rather than a long-term dividend yield definition as in Black and Scholes (1974).
The Litzenberger and Ramaswamy experiment involves three steps. First, they estimate the systematic risk of each stock for each one of the test months. The estimation uses the market model regression. Formally,
(
R -R)
+ε j= t-60,...,t-1, β + a = R -Rit ft it it mj fj it (13)where Rmj is the return on the market portfolio during period j, Rij is the rate of return on stock i
during period j, βit is the estimated beta for stock i for period t, the riskless rate of interest during
period t is Rft, and εit is a noise term. The second stage uses the estimated beta for stock i during
month t, βit, and an estimate of stock i’s expected dividend yield for month t, dit, as independent
variables in the following cross-sectional regression for month t:
(
d -R)
+ i=1...N a + a + a = R -Rit ft 1t 2tβit 3t it ft εi (14)The experiment requires an ex-ante estimate of the test month dividend yield. They obtain the estimate of expected dividend yield for month t from past observations. For cases in which the dividends are announced at month t-1, the estimate is dt/pt-1.
When the announcement and ex-date occur in month t, Litzenberger and Ramaswamy had to estimate the market’s time t expected dividend as of the end of month t-1. The estimate they chose was the last dividend paid during the previous 12 months. If no dividends were paid during this period, they assumed that the expected dividend was zero.
They repeated the second step for every month included in the period 1936 to 1977. They estimated βit+1 by using the previous 60 months of data. They provided an updated estimate of
the expected dividend yield for each stock for each one of the test months.
This sequence of cross-sectional regressions results in a time series of a3t’s. The estimate
of a3 is the mean of this series. They compute the standard error of the estimate from the time
series of the a3t’s in a straightforward manner. Litzenberger and Ramaswamy (1979, 1980) found
that a3 was positive and significantly different from zero. Using MLE and GLS procedures,
Litzenberger and Ramaswamy corrected for the error in variables and heteroskedasticity problems presented in the data. However, the empirical regularity they documented — a positive and statistically significant dividend yield coefficient —was not sensitive to which method they used. The various procedures yielded similar estimated coefficients with minor differences in the significance level. Litzenberger and Ramaswamy interpreted their finding as consistent with Brennan’s (1970) after-tax CAPM. That is, the positive dividend yield coefficient was evidence of a dividend tax effect.
Miller and Scholes (1982) argue that the positive yield coefficient found by Litzenberger and Ramaswamy was not a manifestation of a tax effect, but an artifact of two information biases. First, Litzenberger and Ramaswamy’s estimate of the next-month dividend yield could be correlated with month t information. Of the firms paying dividends, about 40% announced
and paid the dividend (i.e., the ex-dividend day) in the same month. Using the Litzenberger and Ramaswamy yield definition assumes that the dividend month is known a priori even for ex-months in which dividends were not declared in advance.
Second, Litzenberger and Ramaswamy ignored the potential effect of dividend omission announcements. An omission announcement, which is associated with bad news, will tend to bias upward the dividend yield coefficient, since it reduces the return of the zero yield group. The effect of these informational biases is the center of the debate between Litzenberger and Ramaswamy (1982) and Miller and Scholes (1982).
Miller and Scholes showed that when they included only dividends declared in advance in the sample, or when they defined the dividend yield as the dividend yield in month t-12, the yield coefficient was statistically insignificant. Based on these results, Miller and Scholes attributed the Litzenberger and Ramaswamy results to information, rather than tax effects.
Responding to this criticism, Litzenberger and Ramaswamy (1982) constructed a dividend yield variable that incorporated only such information as investors could possess at the time. Their sample contained only stocks that either declared in month t-1 and paid in month t, or stocks that paid in month t-1 and therefore were not likely to repay in the current month. Using the “information-free” sample, Litzenberger and Ramaswamy found the yield coefficient was positive and significant. Miller and Scholes remained unconvinced.
To resolve the informational issue, Kalay and Michaely (2000) performed the Litzenberger and Ramaswamy experiment on weekly data, excluding all weeks containing both the announcement and ex-day (3.4% of the sample). They also excluded all weeks containing dividend omission announcements. Nevertheless, they found a positive and significant yield coefficient, implying that information is not the driving force behind the Litzenberger and
Ramaswamy result. The question still remains whether the positive yield coefficient found by Litzenberger and Ramaswamy can be attributed to taxes. Kalay and Michaely (2000) argue that the single-period model derived by Brennan (1970) and Litzenberger and Ramaswamy (1979) predicts cross-sectional return variation as a function of dividend yield. In contrast, the Litzenberger and Ramaswamy test of Brennan’s model is inadvertently designed to discover whether the ex-dividend period offers unusually large risk-adjusted returns (i.e., time-series return variation).
Litzenberger and Ramaswamy classified stocks as dividend-paying stocks only during the ex-dividend months. For example, they classify a stock that pays quarterly dividends to the zero dividend yield group in two thirds of the months. Therefore, when Litzenberger and Ramaswamy find a significant positive dividend yield coefficient in a Fama-Macbeth type test, it is not clear how to interpret these findings. Are their findings due to cross-sectional differences in dividend yield, which can then be interpreted as evidence consistent with the Brennan model, or are their results evidence of time-series variations in return between dividend-paying and non-dividend paying months? In other words, can we conclude from the Litzenberger and Ramaswamy results that higher-dividend-yield stocks show larger long-run (e.g., annual) risk-adjusted pretax returns (hereafter, cross-sectional return variations)? Or, do their results merely point out that stocks experience higher risk-adjusted pretax returns during their ex-month (hereafter, time-series return variations), and tell us little about the relation between long-run pretax risk-adjusted returns and yields? Time-series return variation, per se, is not evidence of a tax effect.
Since most stocks pay dividends quarterly, trying to avoid dividend income involves realizing short-term capital gains. Under U.S. tax laws, short-term capital gains are taxed as ordinary income. Thus, even though a long-term investor prefers long-term capital gains to
dividend income, he or she does not require a larger pretax risk-adjusted return during only the ex-dividend period. Therefore, the implications of the Brennan model, combined with the U.S. tax code, is that differences in tax rates between dividend income and long-term capital gains income should result in cross-sectional return variation. As do other studies (such as the ex-day studies), Kalay and Michaely find strong evidence of time-series return variation around the ex-day period. However, there is no evidence of cross-section return variation. This result does not support the Brennan’s and Litzenberger and Ramaswamy’s buy-and-hold models.
Another potential problem is whether some omitted risk factors (other than beta) that are correlated with dividend yield, rather than taxes, can explain the positive yield coefficient. As a first indication of the potential importance of some omitted risk factors, Miller and Scholes (1982) demonstrated that when the reciprocal of price, (1/P), is incorporated in the regression equation instead of the dividend yield, (D/P), its coefficient is still positive and significant. This issue was thoroughly investigated by Chen, Grundy, and Stambaugh (1990). Categorizing all dividend-paying stocks into 20 portfolios according to size and yield, they found that when they used a single risk factor, large firms with high dividend yield were the only ones to experience a positive yield coefficient; and when they used two risk factor models, the yield coefficient was significant for only one of the 20 portfolios.
As also suggested by Miller and Scholes (1982) and Hess (1983), Chen, Grundy, and Stambaugh (1990) presented evidence that dividend yield and risk measures were cross-sectionally correlated. When they allowed the risk measures to vary, they found that the yield coefficient was positive but insignificant. Chen, Grundy, and Stambaugh showed that the positive association between yield and their portfolios’ returns could be explained by a time-varying risk premium that was correlated with yield. Thus, they concluded that there was no
reliable relation between cross-sectional variation in returns and dividend yield that is a consequence of a tax penalty.
Fama and French (1993) offer an interesting insight that is relevant to this issue. They argue that the yield coefficient might capture factors other than taxes, and that those other factors might affect assets’ returns. They then show that when using the three-factor model, there is no trace of different intercepts among portfolios with different dividend yields.
Summing up, a growing body of evidence shows that within static, single-period equilibrium models, there is no convincing evidence of a significant cross-sectional relation between stocks’ returns and their dividend yields. Perhaps a more promising avenue for investigating this issue is to examine a model that allows for dynamic trading around the ex-dividend day.
5.2 Dynamic models
An important development in the literature on taxes and dividends was the realization that investors could trade dynamically to reduce their tax liability. The first paper to emphasize this aspect was that of Miller and Scholes (1978). They argued that there were a number of dynamic strategies that allowed investors to avoid taxes, and that in perfect capital markets all taxes could be avoided. This observation brings us back to the case in which dividend policy is irrelevant. However, in practice, the transaction costs of pursuing these strategies appear to be too high to make them empirically significant.
An area where dynamic strategies appear to be more empirically relevant is trading around the ex-date. A number of studies, starting with Kalay (1982), have studied the implications of this strategy. We look at both types of approach.
5.2.1. Dynamic tax avoidance strategies
Miller and Scholes (1978) suggested an ingenious strategy for avoiding taxes. By borrowing and investing the proceeds with tax-free institutions, such as insurance companies or pension funds, investors could create an interest deduction that allowed them to avoid taxes. Since there were assets that were held to offset the borrowing, the position could be closed out at an appropriate point.
Several other dynamic tax avoidance strategies were suggested by Stiglitz (1983). If individuals can easily “launder” dividends so they ’do not have to pay taxes on them, then essentially, we are back in a Miller and Modigliani world, and dividend policy is irrelevant.
However, there is little evidence that investors are actually usually this or other such strategies. Peterson, Peterson, and Ang (1985) showed that individual investors’ marginal tax on dividend income has been about double the marginal tax rate they pay on capital gains income. This evidence does not support a widespread use of tax avoidance strategies of the type described by Miller and Scholes. Rather, it suggests that the transaction costs of such strategies are too high to be useful to investors.
5.2.2. Dynamic ex-dividend day strategies
Several studies have considered dynamic trading strategies around the ex-dividend day. The basic idea is that investors can change their trading patterns around the ex-dividend day to capture or avoid the upcoming dividend. Kalay (1982) argued that in a risk-neutral world, without any restrictions or imperfections such as transaction costs, dynamic arbitrage could eliminate a tax effect in prices. Traders with the same tax rate on dividends and capital gains
will buy the stock before it goes ex-dividend and sell it just after. Without risk or transaction costs, the arbitrage will ensure that the price drop is equal to the dividend, i.e.,
(
PB-PA)
/D=1. (15)If there are transaction costs, and no price uncertainty, then
(
PB-PA)
/D must lie within a range around one. This range will be larger the greater are transaction costs. However, Kalay (1982) did not explicitly account for the risk involved in the ex-day trading.The framework used by Michaely and Vila (1995) describes the ex-day price formation within a dynamic equilibrium framework in which, because of taxes, agents have a heterogeneous valuation of a publicly traded asset. The intuition behind their model is that an investor equates the marginal benefit of trading that arises from being more heavily invested in the dividend-paying stock with the marginal cost that arises from the deviation from optimal risk sharing.
Agents trade because they have heterogeneous valuation of dividends relative to capital gains (on an after-tax basis). This framework incorporates short-term, corporate, and individual investors’ desire to trade around the ex-dividend day. The model explicitly accounts for the risk involved in the trade, and concludes that it is not arbitrage, but equilibrium, that determines prices and volume. In other words, the existence of risk precludes pure arbitrage opportunities and prices are determined in equilibrium. Consequently, no trader will attempt to take an unlimited position in the stock, regardless of his or her tax preference.
The model illustrates that although two-period models like those of Brennan (1970) or Litzenberger and Ramaswamy (1979) adequately describe the effect of taxes on portfolio holdings in a static equilibrium, they mask a qualitative difference between models of financial markets with and without taxation, namely, optimal tax-induced trading. Because of the
dynamic nature of the Michaely and Vila model, it is possible to derive volume and price behavior implications. As it turns out, they can extract the second moment of the heterogeneity distribution (i.e., the dispersion in the after-tax valuation of dividends) from the trading volume around the ex-day.
Using this framework, it is possible to show that in equilibrium, the expected price drop in relation to the dividend reflects the average preference of all traders, weighted by their risk tolerance and wealth, and the risk involved in the ex-dividend day transaction:
(
)
(
)
D /K X -= }/D P | P E -P { = E(Pr) 2e c e c α σ (16) whereE(Pr) = is the expected price drop in relation to the dividend amount (hereafter, “the premium”)
Pc = the cum-day price
Pe = the ex-day price
D = the dividend amount
σ2
ε = the ex-day variance
K = the after-tax weighted average of investors’ risk tolerance X = the supply of securities
T -1 T -1 = α i g i d
i = the relative tax preference of dividend relative to capital gains
k α k = α i i i N 1 = i
∑
∑
= the average of investors tax preferences (αi) weighted by their risk tolerance
As it turns out, unless a perfect tax clientele exists in which different groups hold different stocks rather than just different quantities of the same stock, it is not possible to infer tax rates from price alone. However, we can infer the cross-sectional distribution of tax rates by using both price and volume data. By observing the premium alone, we can infer only the weighted–average relative tax rates, not the entire distribution of tax rates for the trading population. Michaely and Vila (1995) show that the second moment of the distribution could be extracted from the volume behavior on the ex-dividend day.7
This point can be illustrated by the following example. Assume that there are three groups of traders in the marketplace with a marginal rate of substitution between dividends and capital gains income of 0.75, 1.0, and 1.25, respectively. Assume further that the average price drop relative to the dividend amount is one. Using the standard analysis, we can conclude that the second group dominates the ex-dividend day price determination.
However, this conclusion might not be valid. For example, suppose that half of the traders are from the first group and half are from the third group, and both have the same effect on prices. This market composition will also result in a relative price drop equal to the dividend amount. The only way to distinguish between the two scenarios is by incorporating volume into the analysis. In the first case, there are no gains from trade, and therefore no excess volume on the ex-dividend day. In the second case, there are gains from trade, excess volume is observed, and the particular equilibrium point is at a relative price drop equal to one. The model allows the resreacher to distinguish between such cases.
( )
-(
K /)
| }, | {D 2 1 = AV N i i 2 1 = i σ α α∑
(17)7 Boyd and Jagannathan (1994) provide a model in which proportional transactions costs faced by different classes of traders induce a non-linear relationship between ex-day price movement and dividend yield.