Accepted Manuscript
Social and Financial Efficiency of Islamic Microfinance Institutions: A Data Envelopment Analysis Application
Indra Widiarto, Ali Emrouznejad
PII: S0038-0121(15)00002-6
DOI: 10.1016/j.seps.2014.12.001
Reference: SEPS 495
To appear in: Socio-Economic Planning Sciences
Received Date: 18 July 2014 Revised Date: 22 December 2014 Accepted Date: 30 December 2014
Please cite this article as: Widiarto I, Emrouznejad A, Social and Financial Efficiency of Islamic
Microfinance Institutions: A Data Envelopment Analysis Application, Socio-Economic Planning Sciences
(2015), doi: 10.1016/j.seps.2014.12.001.
This is a PDF file of an unedited manuscript that has been accepted for publication. As a service to our customers we are providing this early version of the manuscript. The manuscript will undergo copyediting, typesetting, and review of the resulting proof before it is published in its final form. Please note that during the production process errors may be discovered which could affect the content, and all legal disclaimers that apply to the journal pertain.
M
AN
US
CR
IP
T
AC
CE
PT
ED
Social and Financial Efficiency of Islamic Microfinance
Institutions: A Data Envelopment Analysis Application
Abstract
Microfinance has been developed as alternative solution for global poverty alleviation effort in the last 30 years. Microfinance institution (MFI) has unique characteristic wherein they face double bottom line objectives of outreach to the poor and financial sustainability. This study proposes a two-stage analysis to measure Islamic Microfinance institutions (IMFIs) performance by comparing them to conventional MFIs. First, we develop a Data Envelopment Analysis (DEA) framework to measure MFIs’ efficiency in its double bottom line objectives, i.e. in terms of social and financial efficiency. In the second stage non-parametric tests are used to compare the performance and identify factors that contribute to the efficiency of IMFIs and MFIs.
Keywords: Data Envelopment Analysis, Islamic Microfinance, Microfinance Institutions, Efficiency, Performance Measurement
1. Introduction
Microfinance has been one of the solutions prescribed for global poverty alleviation over the past three decades (Koveos & Randhawa, 2004; Shaw, 2004). It has since achieved substantial attention and focus, particularly in achieving the Millennium Development Goals (MDG) of halving global poverty in 2015 (Balkenhol, 2007). It addresses formal banking system failure in eradicating vicious circle of poverty (Chowdhury & Mukhopadhaya, 2012a; Conning, 1999) by extending financing to the poor, or ‘the unbankable’ (Simanowitz & Walter, 2002) who are deemed too risky thus excluded by formal banking (Di Martino & Sarsour, 2012; Vanroose & D’Espallier, 2013). Furthermore, small loans that they demanded are considered unprofitable (Johnston & Morduch, 2008).
Ironically, microfinance institutions (MFIs) charge high interest rates; mostly even much higher than banks owing to high costs incurred from relatively small loan (Ahmed, 2002; Diop et al., 2007; Obaidullah, 2008; Rahman, 1999), subjected them to criticism (Copestake, 2007a). Moreover, MFIs face difficulty penetrating into regions with substantial Muslim
M
AN
US
CR
IP
T
AC
CE
PT
ED
population observing religious prohibition of interest (The Louis Berger Group, 2010; UN-HABITAT, 2005), creating unmet demands for financing among the poor therein (Segrado, 2005). Thus, Islamic microfinance concept had been developed as alternative for Muslim borrowers; based on Islamic financial contracts (Karim et al., 2008).
Nevertheless, the yardstick of microfinance success lies in its actual performance versus its
raison d’être of poverty alleviation, i.e. ‘the extent to which it alleviates poverty levels of its existing and potential customers’ (Nanayakkara & Iselin, 2012, p. 173). Specifically, MFIs are different from traditional financial institutions due to existence of double bottom line objectives of outreach and financial sustainability (Tulchin, 2003), i.e. aiding the poorest out of poverty whilst striving to sustain operation for long term. Thus, both outreach and financial sustainability are MFIs’ objectives (Abdelkader et al., 2012; Hermes & Lensink, 2011; Vanroose & D’Espallier, 2013) and likewise becoming standard on which their performance is judged (Yaron, 1994).
Whilst IMFIs starting to play instrumental part in Muslim-populated regions in Asia, Africa, Central Europe and Middle East and North Africa (Karim et al., 2008; Obaidullah & Khan, 2008; Parveen, 2009), there are very scant, if any, comprehensive empirical studies assessing their actual performance relative to dual objectives. Given its potential, comprehensive empirical study is dreadfully needed to assess IMFI performance vis-à-vis double bottom objectives and to compare them against conventional MFI counterparts; assessing its viability as alternative in poverty alleviation to gain wider support from governments and donors.
This study thus proposes relative efficiency as a performance criterion that can be applied equally to measure overall, social and financial aspects of MFI performance (Balkenhol, 2007). Specifically, this study proposes the use of Data Envelopment Analysis (DEA), a non-parametric linear programming-based efficiency analysis. It constructed a piece-wise frontier from all best-performing MFIs; thereafter individual MFI’s relative efficiency is calculated against MFI(s) with similar characteristics/attributes located in the frontier as its benchmark(s). From efficiency perspective, an MFI must strive for efficiency in its social and financial objectives. DEA enables different specifications to measure overall efficiency, social efficiency and financial efficiency (Gutiérrez-Nieto et al., 2009).
M
AN
US
CR
IP
T
AC
CE
PT
ED
This research seeks to contribute towards microfinance and Islamic microfinance studies, particularly in currently limited empirical studies in Islamic microfinance performance, as well as towards DEA literatures in application of DEA as an adept methodology in microfinance performance assessment. Finally, this study serves as reflection and wake-up call to IMFIs to improve future performance thus contributing towards the development of Islamic microfinance.
The rest of the paper is organised as follows: next section provides general background on microfinance, i.e. conventional and Islamic MFIs concept differences, MFI operational objectives, and application of efficiency as performance measures. Section 3 explores conceptual framework for efficiency measurement and DEA, further described in section 4 with DEA specifications used in this study. Dataset is laid out in section 5 and subsequently followed by first-stage and second-stage analysis in section 6 and 7, respectively. Results from these analyses are discussed in section 8 with direction for further research is proposed in section 9.
2. Microfinance
(a)Microfinance and Islamic Microfinance
The main role of MFI is expanding economic opportunity and financial market to the poor (Copestake et al., 2002; Seibel & Agung, 2005; Seibel, 2008; Wright & Copestake, 2004), which is considered as effective solution in achieving poverty reduction and other socioeconomic benefits (Li et al., 2011). The underlying assumption being that among causes of poverty is lack of economic opportunities, which can be bridged by microfinance (Comim, 2007) since it is regarded as capable method to assist in distribution of income support and in creation of income-generating activities (Diop et al., 2007).
Yet, relatively small loan extended by MFIs incurred similar transaction costs with large loans, which increase further when MFIs target poor borrowers due to three factors: small amounts, location of poor borrowers and group-lending method to mitigate credit risks hence high fixed costs (Diop et al., 2007). High interest rates is thus charged to cover these transaction costs (Chahine & Tannir, 2010; Conning & Morduch, 2011; Takahashi et al., 2010; Visconti & Muzigiti, 2009) with justification that borrowers return is high in percentage
M
AN
US
CR
IP
T
AC
CE
PT
ED
terms thus paying for high interest rates is not perceived as harmful for the borrowers (Ferro Luzzi & Weber, 2007; Obaidullah & Khan, 2008).
Nevertheless, high interest rate is argued to be problematic. It is documented that high interest rates combined with over-indebtedness and loan misuse often eventually led to excesses ranging from borrowers caught in spiralling debt (Hashemi et al., 2007), resulted in poor borrowers selling whatever asset they have (Parveen, 2009) to the extreme cases of microfinance-linked suicides in Andhra Pradesh, India in 2010 (Conning & Morduch, 2011; van Rooyen et al., 2012) and in Sri Lanka (Obaidullah & Mohamed-Saleem, 2008). Adverse selection increases whereby customers borrow without intention to repay (Diop et al., 2007). Moreover, MFI operatives often found acting equivalent to loan shark in boosting repayment (Servin et al., 2012). This study concurs with Armendariz de Aghion and Morduch (2005) that poor borrowers will not be able to pay continuous high interest in long term.
Islamic microfinance concept was later developed as alternative in regions with substantial Muslim population observing faith-based prohibition of interest. It aims to provide better model in addressing embedded issues of high interest rate and others in mainstream/conventional microfinance (Ahmed, 2002, 2007). Employing interest-free contracts, Islamic microfinance institution (IMFI) theoretically extends in-kind, in lieu of monetary, assistance to the poor thereby overcoming misuse and over-indebtedness (Ahmed, 2002; Obaidullah, 2008). Islamic microfinance broadens concept of microcredit-cum-trainings by incorporating charity in financing, in the form of zakah (alms) and waqf
(endowment), assisting the poorest in basic necessities and avoiding misuse of productive loans into consumption purposes (Ahmed, 2007; Wilson, 2007). Although relatively small in scale, Islamic microfinance has grown globally following the growth of wider Islamic finance industry (Karim et al., 2008).
(b) Microfinance and double bottom line objectives
Outreach and sustainability are dual objectives of MFI operation (Tulchin, 2003). Outreach is defined as social value of MFI output in six aspects, i.e. depth, breadth, length, scope, worth of users, and cost to users (Navajas et al., 2000; Schreiner, 2002). These aspects are the
M
AN
US
CR
IP
T
AC
CE
PT
ED
defined as the following: depth of outreach is defined as the extent to which MFI penetrate deeper to the poorest, breadth is measured by number of borrowers assisted, length is the time frame of microfinance service is provided to a community, scope of outreach refers to number of services variety provided (e.g. loan, savings and others), worth of users is how much clients value the service provided based on how it matches clients’ needs, and cost to users is calculated by the total costs clients have to pay for the service as the sum of price costs (interest and fee) and transaction costs. Among these aspects, the focus on outreach in most studies is on the depth and breadth of outreach (Quayes, 2012). On the other hand, sustainability is defined as permanence or the MFI ability to sustain its microcredit and other operations as a viable financial institution (Cull et al., 2007; Navajas et al., 2000). This is equally important as MFI is expected to operate in long term to have profound impact on the poor (Balkenhol, 2007; Quayes, 2012).
Morduch (1999) observed that MFIs’ sound financial performance does not guarantee depth of outreach, let alone poverty alleviation; whilst Navajas et al. (2000) examined that MFIs serve households that are either just below the poverty line – ‘the richest of the poor’ – or just above the poverty line – ‘the poorest of the rich’ – in its strive to be profitable. Schreiner (2002) concluded that the depth of outreach and financial sustainability are like conflicting objectives thus a trade-off exists: outreach is only attained by sacrificing financial sustainability or by relying more on donations or subsidies. He suggested MFIs to strive for breadth, scope and length aspects of outreach instead of depth. Studies by Hermes and Lensink (2011), von Pischke (1996), Mersland and Strøm (2008), Hermes et al. (2011) and others also focused on this trade-off.
Cull et al. (2007) suggested that MFIs can sustain their profitability by not lending the poorest, given higher cost per dollar of loan, but to the ‘less poor’ instead as overall welfare will improve. Yet, this study argued along with Ahmed (2002), that microfinance is actually a response to the failure of trickle-down development policy to alleviate poverty in most developing countries, owing to asymmetric information.
Simanowitz (2007) argued that MFI can and should manage this objectives trade-off. Paxton and Cuevas (2002) cited in Quayes (2012:3422) argued that, contrary to Diop et al. (2007), group loan schemes actually reduce costs in lending small loans hence trade-off is managed.
M
AN
US
CR
IP
T
AC
CE
PT
ED
Stiglitz (1990) supported this view since similar structure of small loans minimises costs. Regarding breadth versus depth of outreach, Quayes (2012) argued that the rapid growth of microfinance in the past two decades has spurred the growth in number of borrowers both at the industry and at the firm level yet this does not necessarily means reaching out to the poorest, as also found by Navajas et al. (2000). Since helping the poorest is the raison d’être of microfinance, the depth of outreach, which is generally measured using proxy of average loan balance per borrower, can be regarded as measure for quality of outreach whilst breadth of outreach represents quantity in outreach (Quayes, 2012). Thus, studies concerned with outreach to the poorest have focus on both; as in Armendariz and Szafarz (2011), Nanayakkara and Iselin (2012), and Simanowitz (2003). Furthermore, Haq et al. (2010), Fluckiger & Vassiliev (2007) and Gutiérrez-Nieto et al. (2009) among others, empirically observed that both outreach and financial sustainability can be pursued in best-practice MFIs.
(c) Efficiency as a measure of MFI performance
Traditional financial indicators are not sufficient to assess microfinance performance since, due to its social mission, sustainability in MFI is not necessarily limited to profitability but rather to MFI ability ‘to operate in long term without threat of bankruptcy’ (Nanayakkara, 2012, p. 94). Thus, whilst some MFIs deliberately focus on profitability to reach sustainability (e.g. bank-MFI), there exist other MFIs where profitability is not a major focus and achieve sustainability by contribution from donors or external grant, e.g. non-governmental organisation-based MFI (NGO-MFI). Using traditional financial ratios to measure MFI performance can also be ambiguous: an MFI can excel in one ratio but fail in others hence difficulty in overall performance benchmarking (Bogetoft & Otto, 2011). Furthermore, separate ratios cannot measure how different inputs concurrently affect multiple outputs in transformation process (Thanassoulis, 2001).
Due to this partiality problem, MFI stakeholders may face confusion in benchmarking overall performance of an MFI against other MFIs, which is essential to drive MFI performance improvement (Balkenhol, 2007). Fluckiger and Vassiliev (2007) added that aggregation problem occurs when all these indicators are to be combined into one assessment criterion. Likewise, basing performance to single indicator overlooks any
M
AN
US
CR
IP
T
AC
CE
PT
ED
substitutions, interactions and trade-offs between several performance measures (Bogetoft & Otto, 2011; Zhu, 2003).
Efficiency is thus proposed in this study as MFI performance measurement criterion due to its capability to cover both different aspects of microfinance and to be applied to both commercial and not-for-profit MFIs (Balkenhol, 2007). Efficiency relates usage of input to create output; traditionally defined as ratio of output over input, e.g. cost per unit, production per labour hour (Cooper et al., 2000). Yet, efficiency in microfinance studies is still in ratio form; though evolving from ‘operational efficiency’ in Micro-Banking Bulletin 1997 into five ratios in Micro-Banking Bulletin 2006 (Balkenhol, 2007), hence partiality problem.
Consequently, modern efficiency approach capable to be applied to multiple-inputs and multiple-outputs, to all types of MFIs, and to benchmark overall MFI performance is needed. One such method is Data Envelopment Analysis (DEA), described in the following sections.
3. Conceptual Framework for Efficiency Measurement
(a) Efficiency
Efficiency in production theory refers to the utilisation of inputs into outputs. It concerns with optimal combination of inputs to produce maximum outputs or producing given outputs with least quantity of inputs hence minimising waste. Farrell (1957) widened this concept into relative efficiency, i.e. the extent to which actual observable use of resources by an organisation to produce a given quality of outputs matches optimal use of these resources (Bhagavath, 2006). Farrell (1957) classified the concept of efficiency into productive (technical) efficiency, price (allocative) efficiency, and economic (cost) efficiency. Technical efficiency deals with utilisation of inputs to produce outputs relative to best practice organisations with similar characteristics (Bhat et al., 2001; Emrouznejad & Anouze, 2010); measuring the extent of wasted resources from transformation process (Masiye et al., 2006). It is influenced by managerial practice and operational scale (Thanassoulis, 2001). Allocative efficiency calculates whether resources have been allocated to produce outputs with highest possible value, i.e. with lowest possible cost (Masiye et al., 2006; Thanassoulis, 2001);
M
AN
US
CR
IP
T
AC
CE
PT
ED
indicating the influence of input prices. Cost or economic efficiency is the combination of technical and allocative efficiency; measuring organisation’s ability to produce without waste and to allocate resources in their highly valued use (Coelli et al., 2005; Masiye et al., 2006) whereby an organisation can only reach overall cost or economic efficiency if it is both technically and allocatively efficient (Thanassoulis, 2001). As the prices of inputs and outputs in microfinance context are not easily determined, e.g. number of borrowers or portfolio at risk, this study will solely focus on technical efficiency Besides these, scale efficiency calculates the impact of scale size by measuring an organisation’s technical efficiency at its current production scale relative to that at its most productive scale size (Coelli et al., 2005; Thanassoulis, 2001).
Data Envelopment Analysis
Developed by Charnes et al. (1978), Data Envelopment Analysis (DEA) is a non-parametric method that expands single input-output productive efficiency concept from Farrell (1957) into efficiency assessment in transformation process of decision-making unit (DMU) with multiple-inputs and multiple-outputs. Using linear programming, it forms a ‘floating’ piece-wise linear production frontier on top of all data as best-practice benchmark (or reference set) against which each DMU is assessed, hence the term ‘envelopment’ (Cook & Zhu, 2005; Emrouznejad & Anouze, 2010; Fluckiger & Vassiliev, 2007). Technical Efficiency is calculated as distance of DMU to reference set on the frontier; creating relative efficiency measure for all DMUs (Cook & Zhu, 2005; Cooper et al., 2004; Emrouznejad & Anouze, 2009). Since its beginning in 1978, there has been tremendous growth both in modelling and applications in DEA studies in various sectors (Emrouznejad et al., 2008). DEA excels in assessing efficiencies without a priori assumption on the distribution and production function (Cook & Zhu, 2005; Cooper et al., 2004) thus shines in situation where inputs-outputs relationship is not straightforward.
Consequently, DEA is an appropriate method for MFI assessment whereby functional relationship between multiple inputs and outputs therein are often not directly observable. MFI effort to reach its double bottom line objectives can be perceived as efficiency problem, i.e. how an MFI transforms resources (inputs) to reach these dual objectives (outputs) compared to its best practice peers. As per Gutiérrez-Nieto et al. (2009), MFI dual objectives
M
AN
US
CR
IP
T
AC
CE
PT
ED
can be perceived as social efficiency and financial efficiency. Though still scant, DEA has thus far been used in several MFI studies.
Two basic DEA models are CCR model of Charnes et al. (1978) and BCC model of Banker et al. (1984). CCR model assesses technical efficiency under Constant Return to Scale (CRS) condition hence CRS model. Multiple inputs and outputs for a given DMU are linearly aggregated into single ‘virtual’ input and output in the following manner:
= = = = = + + = = + + = = =
∑
∑
∑
∑
... ... m i i i 1 s r r r 1 s r r r 1 m i i i 1 1 1 i i 1 1 r r Virtual Input v x v x v x Virtual Output u y u y u y u y virtual outputEfficiency virtual input
v x
Whereby and are weights for observed input and for observed output , respectively. Efficiency score is assigned for each DMU in a way that maximise the ratio of weighted output to weighted input. BCC model in Banker et al. (1984) modifies CCR model by applying a more realistic assumption of Variable Returns to Scale (VRS) wherein each DMU is allowed to exhibit different returns to scale due to different environment, hence VRS model. CRS is only valid if a DMU operates at its most productive scale size yet that is often not the case. Scale efficiency causes the difference between VRS technical efficiency of a given DMU, i.e. pure technical efficiency, to its CRS technical efficiency, i.e. global technical efficiency (Coelli et al., 2005; Thanassoulis, 2001). Two approaches in basic DEA models are input-orientated, i.e. maximises proportional inputs reduction whilst holding outputs constant, and output-orientated,which maximises the proportional outputs increase whilst keeping inputs constant, as in the following equation (1) and (2), respectively.
M
AN
US
CR
IP
T
AC
CE
PT
ED
λ λ θ λ λθ
θ
= = = ≥ = ≤ = = ≥ = =∑
∑
∑
1 1 1 * : , 1, 2,. . . , ; , 1, 2,. . . , ; 1 0 , 1, 2,. . . , . n j r j r 0 j n j i j i 0 j n j j j S u b j e c t t o y y r s x x i m j n M i n (1) λ φ λ λ λφ
φ
= = = ≥ = ≤ = = ≥ = =∑
∑
∑
1 1 1 * : , 1, 2,. . . , ; , 1, 2,. . . , ; 1 0 , 1, 2,. . . , . n j r j r 0 j n j i j i 0 j n j j j S u b j e c t t o y y r s x x i m j n M a x (2)Banker et al. (1984) added
!
"# = 1in the constraint set to represent convexity constraint
for in VRS condition; ensuring a DMU to be compared only to similarly-sized DMUs with similar return to scale. Pure technical efficiency scores from BCC model is thereby greater or equal to global technical efficiency scores from CCR model as DMU is measured relative to smaller number of DMUs (Thanassoulis, 2001).
4. Measuring MFIs Performance: Social and Financial efficiency
Assessment framework
There are different approaches to assess MFIs performance as financial institutions, i.e. production or intermediation approach (Athanassopoulos, 1997; Berger & Humphrey, 1997). Under production approach, financial institutions are regarded as production units using capital and labour as inputs to produce outputs of loans, deposits, and other financial services. Conversely, under intermediary approach, they are regarded as financial intermediaries using inputs of deposits from economic agents with fund surplus to produce outputs of loans and other financial services to economic agents in deficit (Athanassopoulos, 1997; Kipesha, 2012). Thus, the role of deposit is different, i.e. as output in production approach but as input in the intermediary approach (Balkenhol, 2007; Gutiérrez-Nieto et al., 2007). Since many IMFIs and their conventional MFIs in dataset are not collecting deposit
M
AN
US
CR
IP
T
AC
CE
PT
ED
hence production approach is applied herein, as in many DEA microfinance studies (e.g. Fluckiger & Vassiliev, 2007; Gutiérrez-Nieto et al., 2009; Gutiérrez-Nieto et al., 2007; Haq et al., 2010; Hassan & Sanchez, 2009; Kipesha, 2012; Sedzro & Keita, 2009).
This research applied both output-orientated and input-orientated CCR and BCC models in its DEA analyses. Output-orientated model is used because microfinance units naturally strive to maximise outputs (dual objectives) given limited available inputs. Nevertheless, input-orientated model is also applied herein so as to provide comparison in a condition where MFIs are unable to increase outputs due to geographical, demographical or regulatory restriction thus only face option of lowering inputs to increase efficiencies. As differences in operational size may affect efficiency, BCC model using VRS assumption is intuitively more befitting to measure MFIs performance. Nevertheless, CCR model is also observed to compare to efficiency at optimal scale and to calculate scale efficiency.
Table 1: DEA Input variables
DEA input-output selection
Inputs Initial Definition Usage in literatures Unit
Assets A Total wealth available to MFI from capital and borrowings for its transformation process. It is used as inputs to represent capital for production approach.
Bassem (2008), Kipesha (2012) and Gutierrez-Nieto et al. (2009)
USD '000
Operating Expense
O Expenses related to operations, e.g. all personnel expense, depreciation and amortization, and administrative expense. It is used as input in production approach since production process will not be viable in the long run if outputs were produced at high costs hence need to be managed to avoid waste.
Gutiérrez-Nieto et al. (2007), Gutiérrez-Nieto et al. (2009), Hassan and Sanchez (2009) and Athanassopoulos (1997)
USD '000
Portfolio at Rixk 30 days
R Percentage of total loan outstanding at risk of default by having one or more principal or instalments in arrears more than 30 days. This variable is used herein as input in production approach to represent risk in transformation process as less risk is favourable for the firm.
As far as we concerned, it has not been used as input in other DEA – microfinance literatures.
%
Employee E Labour input, i.e. all individuals employed by MFI, including contract employees or advisor whether or not listed on MFI employee roster
Athanassopoulos (1997), Bassem (2008), Hassan and Sanchez (2009), Sedzro and Keita (2009), Kipesha (2012), and Haq et al. (2010)
M
AN
US
CR
IP
T
AC
CE
PT
ED
From literatures, DEA in this study utilises four inputs representing aspects of capital and labour in production and three outputs, i.e. two outputs representing outreach (social objective) and one output representing sustainability (financial objective), as presented in Table 1 and Table 2. Data thereof are obtained from MiX database1.
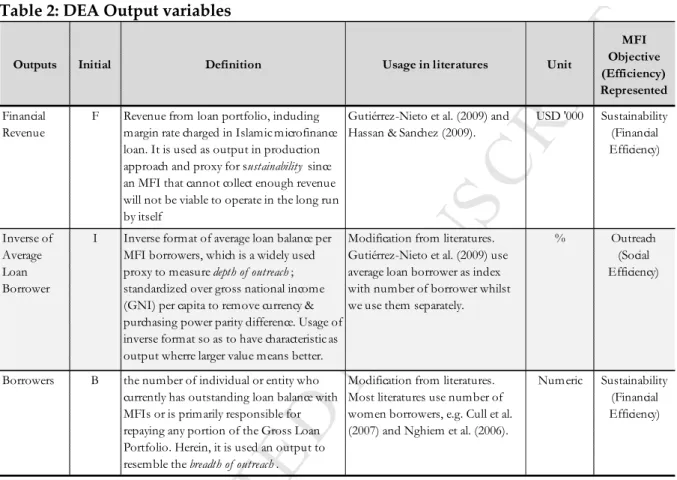
Table 2: DEA Output variables
It should be noted herewith from this input-output selection: (1) although as far as we are concerned it has never been used before in DEA-microfinance studies, we selected Portfolio at Risk 30 days as it is one of the most important indicators in microfinance literature as warning sign of future delinquency problem (Rosenberg, 2009). (2) Gutiérrez-Nieto et al. (2009) used standardized average loan balance in an index of the benefit to the poor in combination with borrowers, whilst we keep these separately as output to differentiate
quality and quantity of outreach and to avoid problem associating with the use of index as DEA input/output (Emrouznejad & Amin, 2009). (3) We upholds using number of active borrowers as output due to IMFI emphasis on family borrowers as opposed to solely women
1
Data in Microfinance Information Exchange (MiX) is collected from MFIs globally; adjusted and standardized thereafter to make it uniform and comparable. MiX also ranks its contributing MFIs’ transparency using scale of 1 to 5 diamonds for the least transparent to the most transparent.
Outputs Initial Definition Usage in literatures Unit
MFI Objective (Efficiency) Represented Financial Revenue
F Revenue from loan portfolio, including margin rate charged in Islamic microfinance loan. It is used as output in production approach and proxy for sustainability since an MFI that cannot collect enough revenue will not be viable to operate in the long run by itself
Gutiérrez-Nieto et al. (2009) and Hassan & Sanchez (2009).
USD '000 Sustainability (Financial Efficiency) Inverse of Average Loan Borrower
I Inverse format of average loan balance per MFI borrowers, which is a widely used proxy to measure depth of outreach; standardized over gross national income (GNI) per capita to remove currency & purchasing power parity difference. Usage of inverse format so as to have characteristic as output wherre larger value means better.
Modification from literatures. Gutiérrez-Nieto et al. (2009) use average loan borrower as index with number of borrower whilst we use them separately.
% Outreach (Social
Efficiency)
Borrowers B the number of individual or entity who currently has outstanding loan balance with MFIs or is primarily responsible for repaying any portion of the Gross Loan Portfolio. Herein, it is used an output to resemble the breadth of outreach.
Modification from literatures. Most literatures use number of women borrowers, e.g. Cull et al. (2007) and Nghiem et al. (2006).
Numeric Sustainability (Financial
M
AN
US
CR
IP
T
AC
CE
PT
ED
borrowers (Ahmed, 2002); thereby male head of the household and women partner will collectively be loan agreement signatories, putting thereunto repayment responsibility and discouraging loan misuse by male partner.
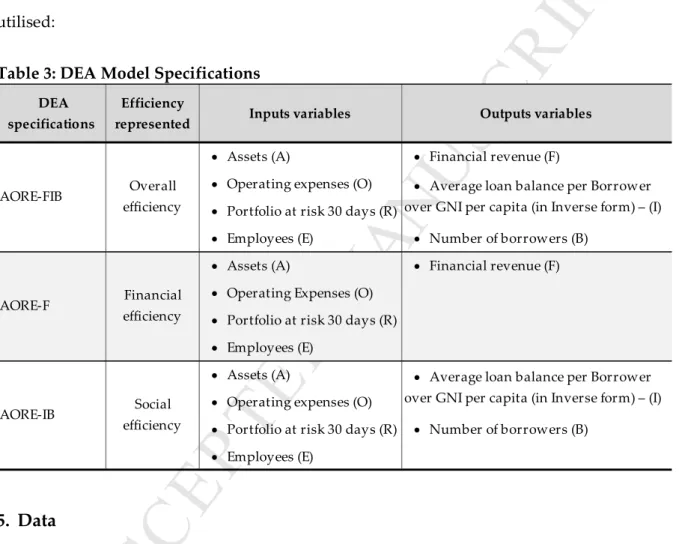
DEA model specifications
In DEA assessment for overall efficiency as well as social and financial efficiency in isolation, in common with (Gutiérrez-Nieto et al., 2009), as in Table 3 three different specifications are utilised:
Table 3: DEA Model Specifications
5. Data
This study utilises data from MiX database for 231 MFIs in three regions: Middle East and North Africa (MENA), East Asia and the Pacific (EAP) and South Asia (SA), in which most IMFIs in MiX mainly operates. Whilst most MFIs in dataset are independent firms operating in their countries/regions, some are local branch of global NGOs or banks, e.g. BRAC and FINCA, or microfinance arm of local banks, e.g. Khushhali Bank in Pakistan. MFIs herein are classified into three schemes: conventional/mainstream, Islamic, and Islamic windows. Islamic window MFIs are MFIs offering both conventional and Islamic microloans. In this research, Islamic and window MFIs are grouped together with IMFIs as they are located in
DEA specifications
Efficiency
represented Inputs variables Outputs variables
• Assets (A) • Financial revenue (F) • Operating expenses (O)
• Portfolio at risk 30 days (R)
• Employees (E) • Number of borrowers (B) • Assets (A) • Financial revenue (F) • Operating Expenses (O)
• Portfolio at risk 30 days (R) • Employees (E)
• Assets (A)
• Operating expenses (O)
• Portfolio at risk 30 days (R) • Number of borrowers (B) • Employees (E)
• Average loan balance per Borrower over GNI per capita (in Inverse form) – (I)
AORE-FIB Overall
efficiency
• Average loan balance per Borrower over GNI per capita (in Inverse form) – (I)
AORE-F Financial
efficiency
AORE-IB Social
M
AN
US
CR
IP
T
AC
CE
PT
ED
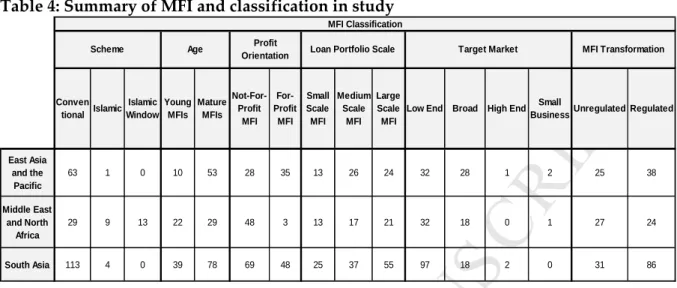
MENA region where Islamic microloan is their major product albeit offering conventional microloans. Table 4 presents summary of MFI groupings in study.
Table 4: Summary of MFI and classification in study
All monetary data in dataset are in US Dollars hence comparable. Due to missing data, only balanced data of 2009–2010 is used and statistical summary of data is reported in Table 5. Table 5: Descriptive statistics of input and output factors, for 231 MFIs & IMFIs
Mean normalization as per Sarkis (2007) is used to standardized the data to avoid “scaling” issues in calculation as magnitude differences between some inputs and outputs are very wide. − − = =
∑
1 1 1 i0 N Norm i0 in n X X X Nwhere () is value of ith input of DMU0, N is the total number of DMU in sample, and
(*+,-.is the mean-normalized value of ith input of DMU0.
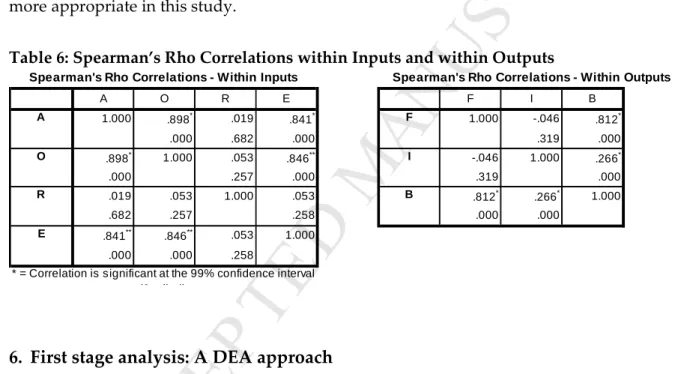
Spearman’s Rho correlation in Table 6 shows that significantly strong correlations exists between asset, operational expenses, and employee within inputs, and between financial
Conven tional Islamic Islamic Window Young MFIs Mature MFIs Not-For-Profit MFI For-Profit MFI Small Scale MFI Medium Scale MFI Large Scale MFI
Low End Broad High End Small
Business Unregulated Regulated
East Asia and the Pacific 63 1 0 10 53 28 35 13 26 24 32 28 1 2 25 38 Middle East and North Africa 29 9 13 22 29 48 3 13 17 21 32 18 0 1 27 24 South Asia 113 4 0 39 78 69 48 25 37 55 97 18 2 0 31 86 MFI Classification
Scheme Age Profit
M
AN
US
CR
IP
T
AC
CE
PT
ED
revenue and borrowers within outputs. These correlations are expected due to inputs and outputs used in this study, i.e. number of employee will have high correlation with operating expenses in inputs and number of borrower may have high correlation with financial revenue collected as outputs. Nevertheless, they are retained in the DEA specification as they are important inputs and outputs in MFI efficiency assessment. These do not necessarily imply causal relationship; DEA algorithm will assign weights to these and maximise them according to their weights. On the contrary, in the presence of high correlations, the use of parametric efficiency measurement method may not be appropriate due to multi-co-linearity problem which makes beta coefficients for correlated independent variables unreliable. The presence of multiple outputs also makes the application of DEA more appropriate in this study.
Table 6: Spearman’s Rho Correlations within Inputs and within Outputs
6. First stage analysis: A DEA approach
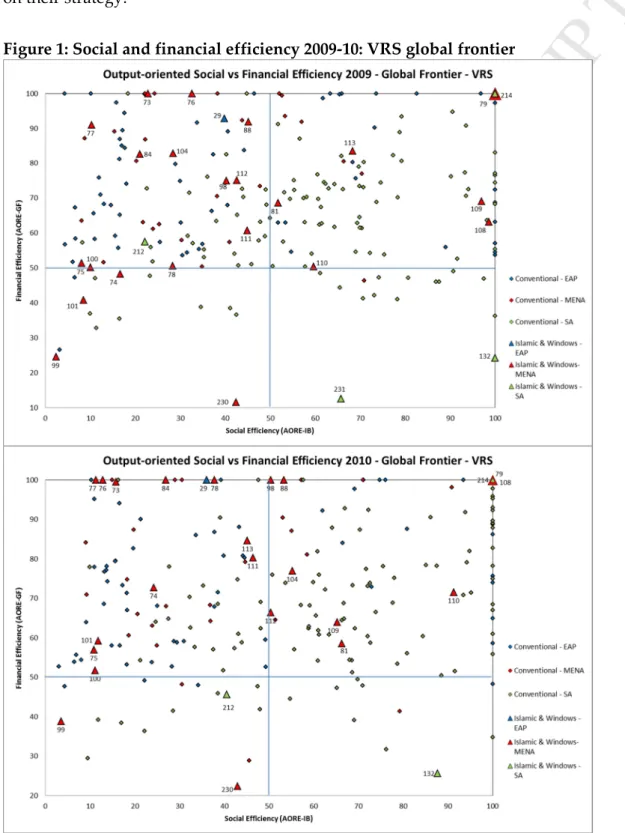
Efficiency in 2009 and 2010 for each IMFI is assessed against all MFIs in global frontier, against MFIs in its own regional frontiers and against all IMFIs in Islamic frontier. Analysis herein focuses on VRS output-orientated global frontier results, complemented with result highlights from CRS model, regional frontiers, and Islamic frontier. Thereafter, efficiency scores are plotted into XY scatterplot with social efficiency at X axis and financial efficiency at Y axis to observe MFI positioning regarding these objectives. The XY scatterplot area is divided into four quadrants counter-clockwise: from quadrant I in top right for high social – high financial efficiency quadrant area until quadrant IV in bottom right for high social efficiency – low financial efficiency area.
A O R E F I B 1.000 .898* .019 .841* 1.000 -.046 .812* .000 .682 .000 .319 .000 .898* 1.000 .053 .846** -.046 1.000 .266* .000 .257 .000 .319 .000 .019 .053 1.000 .053 .812* .266* 1.000 .682 .257 .258 .000 .000 .841** .846** .053 1.000 .000 .000 .258 F I B
* = Correlation is significant at the 99% confidence interval (2-tailed).
A
O
R
E
M
AN
US
CR
IP
T
AC
CE
PT
ED
Based on its theoretical model and mission, it is presumed that Islamic/window MFIs to have higher social efficiency than conventional MFIs whilst more established conventional MFIs to have higher financial efficiency. No presumption is established upon overall efficiency due to it being a mixture of said dual objectives.
Output-oriented DEA Analysis for global frontier
Overall efficiency (AORE-FIB specification): As seen in Table 7, facing 2009 global frontier, Islamic/window MFIs show lower mean of VRS overall efficiency (pure overall efficiency) than conventional MFIs by 75.32% versus 78.24%; a wake-up call for Islamic microfinance proponents. Scale efficiency of MFIs is higher than that of Islamic/window MFIs, i.e. 93.60% versus 92.02%, indicating that conventional MFIs on average were slightly closer to most productive scale size. Thus, these lead to higher mean CRS overall efficiency (global overall efficiency) of conventional MFIs, i.e. 73.02% against 69.10%.
Against 2010 global frontier, Islamic/window MFIs show higher mean VRS overall efficiency than conventional MFIs of 82.48% versus 79.31%, yet slightly lower mean CRS overall efficiency of 75.1% to 75.34% due to lower mean of scale efficiency of 91.29% against 95.03%. High mean scale efficiency in both schemes indicate that, on average, source of inefficiency for MFIs vis-à-vis overall objective in 2009 and 2010 is technical inefficiency, not operational scale. However, lower scale efficiency of Islamic/window MFIs hurt their performance in comparison to conventional MFIs in CRS condition.
First quartile VRS score of Islamic/window MFIs is also lower than conventional MFIs relative to 2009 global frontier, i.e. 51.41% and 65.58%, respectively; though higher at 67.84% to 66.79%, respectively relative to 2010 global frontier. Generally, IMFIs performance compared to MFIs vis-à-vis overall objective raises an alarm for its proponents.
M
AN
US
CR
IP
T
AC
CE
PT
ED
Table 7: Islamic/windows vs Conventional MFIs 2009-10 - VRS global frontier
Financial efficiency (AORE-F specification): Consistent to expectation, against 2009
meta-frontier, Islamic/window MFIs have lower mean VRS financial efficiency than conventional MFIs, i.e. 65.11% to 71.28%. Furthermore, Islamic/window MFIs also have lower mean CRS financial efficiency than IMFIs, i.e. 56.26% versus 66.53%, respectively, indicating its general farther distance to optimal scale. Against 2010 global frontier, however, Islamic/windows MFIs marginally outperform conventional MFIs in financial efficiency, i.e. 73.47% to 72.94%
M
AN
US
CR
IP
T
AC
CE
PT
ED
but underperform to MFIs in CRS condition of 61.70 to 67.56%. Conventional MFIs again have higher mean scale efficiency of 93.18% versus 86.76% relative to 2010 global frontier. In summary, whilst source of financial inefficiency for all MFIs and IMFIs is also technical inefficiency, this is an issue for Islamic/window MFIs that suffer from lower scale efficiency vis-à-vis financial objective compared to conventional MFIs, hurting their CRS efficiency. Social Efficiency (AORE-IB Specification): Surprisingly, conventional MFIs outperform IMFIs on mean VRS social efficiency relative to 2009 global frontier, i.e. 54.37% against 44.71%, also marginally higher mean scale efficiency of 81.43% to 80.30%. Moreover, 66.70% of IMFIs scored below 50.00% versus 45.60% of conventional MFIs and lowest VRS score among IMFIs and conventional MFIs are 2.42% and 3.16%, respectively. Against 2010 global frontier, conventional MFIs on average outperform Islamic MFIs with higher mean VRS social efficiency (57.03% to 48.04%) and higher mean scale efficiency (88.85% to 84.18%), albeit lowest social efficiency score among conventional MFIs is 3.00% compared to 3.24% among Islamic/window MFIs.
These results challenge initial expectation that Islamic/window MFIs, to overcome excesses from high interest rates, will outperform conventional MFIs in social efficiency. Lower mean and median VRS social efficiency of Islamic/window MFIs show that their poorer performance are attributable to higher technical inefficiency than conventional MFIs. Additionally, lower mean and median of Islamic/window MFIs’ CRS social efficiency demonstrate that lower operational scale compared to conventional MFIs further hurt IMFIs’ relative performance.
Social efficiency versus financial efficiency mapping: In Figure 1, 14 out of 27 IMFIs are plotted in quadrant II relative to frontier in 2009 indicating their strategy are leaning toward financial efficiency. Yet, 7 IMFIs are plotted in quadrant I, where 2 IMFIs are fully-efficient in both objectives thus relative balance of dual objectives is feasible. Against 2010 frontier, MFIs spread more evenly in quadrant I and quadrant II. Ten IMFIs are in quadrant I with 3 IMFIs fully-efficient in both objectives.
M
AN
US
CR
IP
T
AC
CE
PT
ED
It should be noted, however, 4 IMFIs and 3 IMFIS are mapped in quadrant III relative to 2009 and 2010 frontiers, respectively due to their low social- and financial efficiency scores. Amongst these, 2 IMFIs are mapped therein relative to both 2009 and 2010 frontiers - Reef Palestine (DMU 99) with its very low social efficiency scores and Al Amal Bank Yemen (DMU 230) with very low financial efficiency score. Thus, further investigation thus needed on their strategy.
M
AN
US
CR
IP
T
AC
CE
PT
ED
On the contrary, the biggest IMFI in Pakistan, Akhuwat (DMU 231) are mapped in Quadrant IV in both 2009 and 2010 frontiers; it has high social efficiency scores – even fully efficient relative to 2010 frontiers – but scores very low on financial efficiency. This is because they do not charge any interest or margin to their borrowers; borrowers only repay the amount they borrow without any addition – via Islamic contract called Qardh Hasan. Akhuwat cover their entire operation from voluntary donations (Obaidullah & Khan, 2008).
Results from regional and Islamic frontiers
We found the following results from three regional frontiers and Islamic frontier:
East Asia and the Pacific (EAP) frontier: On average, EAP MFIs perform impressively in mean VRS overall efficiency and VRS financial efficiency. Main source of inefficiency for both overall and financial efficiency is generally technical inefficiency in both frontiers. The only IMFI in EAP, AIM Malaysia is fully efficient in both overall and financial efficiency relative to both frontiers and fully scale-efficient in financial efficiency. This confirms the reputation of Malaysia as being the centre of effective Islamic banking and finance, with the best infrastructure in this sector.
However, social efficiency of EAP MFIs on average are mediocre in both frontiers, with mean VRS social efficiency of 57.18% (2009 frontier) and 53.06% (2010 frontier). Since mean social scale efficiency are above 90% in both frontiers, the source of this mediocre performance was generally technical inefficiency; thus penetration strategy needs to be evaluated. AIM Malaysia’s social efficiency is above average with 70.76% (2009 frontier) and 67.62% (2010 frontier) albeit mediocre scale efficiency of 64.75% and 67.55%, indicating both technical inefficiency and operational scale problems hereto.
Middle East and North Africa (MENA) regional frontier: Relative to 2009 MENA regional
frontier, conventional MFIs have higher mean and median of overall efficiency albeit Islamic/window MFIs having marginally higher overall scale efficiency. Against 2010 frontier, Islamic/window MFIs slightly outperformed conventional MFIs in this measure. Consistent with presumption, conventional MFIs generally outperform Islamic/windows MFI in financial efficiency and in financial scale efficiency in 2009 frontier; yet
M
AN
US
CR
IP
T
AC
CE
PT
ED
Islamic/windows topped them in 2010 frontier with marginally higher mean financial efficiency and mean scale efficiency. A plausible reason suggested thereto was 2010 Moroccan microfinance crisis weakening average of all conventional MFIs, not IMFIs superior performance.
Conversely, conventional MFIs defy initial presumption by outperforming Islamic MFIs in mean and media of social efficiency in both frontiers albeit higher mean social scale efficiency of Islamic/windows MFIs. This, and lower mean and median of overall and financial efficiency, indicate a serious wake-up call for IMFIs in the region that need serious attention thus call for further research.
Generally, technical inefficiency is the major source of inefficiency for overall, financial, and social efficiency for all MFIs, particularly for Islamic MFIs in social efficiency. High mean scale efficiencies indicate that MENA MFIs generally operates closer to optimal scale.
South Asia (SA) regional frontier: Four SA IMFIs in dataset outperformed SA conventional
MFIs relative to both frontiers in mean overall efficiency and overall scale efficiency, also by wide margin in mean social efficiency and mean social scale efficiency. Though consistent with initial expectation for social efficiency, these are indeed surprising given longer operation of conventional MFIs.
On the contrary, consistent with presumption, conventional SA MFIs outperform SA IMFIs in mean financial efficiency and mean financial scale efficiency in both frontiers. Wide margin differences of IMFIs scale efficiency from conventional MFIs in both frontiers indicate that Islamic MFIs are relatively farther to optimum scale hence scale problem for IMFIs; show by very low mean CRS financial efficiency of 28.92% to that of 73.32% from conventional MFIs.
Islamic frontier: Relative to own frontiers in both 2009 and 2010, Islamic/windows MFIs generally deliver satisfactory performance in overall, financial, and social efficiency. Majority of IMFIs are located in quadrant I of XY plot map. In both frontiers, mean overall efficiency and mean overall scale efficiency are above 85%, mean financial efficiency and mean financial scale efficiency are above 75%, plus mean social efficiency and mean social
M
AN
US
CR
IP
T
AC
CE
PT
ED
scale efficiency are above 77%; implying technical inefficiency as general source of inefficiency.
Exception thereto being Al Amal Bank Yemen (DMU 230), where scale inefficiency hurt its CRS overall efficiency scores in 2009 for almost 40%. Farz Foundation (DMU 214) also suffers massive financial scale inefficiency. It is fully financial-efficient in both frontiers, yet due to its very small scale efficiency, its CRS financial efficiency scores are only 13.72% (2009 frontier) and 12.33% (2010 frontier). Scale inefficiency also impairs social efficiency performance of Al Mosanid (DMU 74) and TDMN (DMU 79). TDMN was fully-efficient relative to both frontiers under VRS but only scores 36.06% (2009 frontier) and 51.49% (2010 frontier) under CRS, implying very low scale efficiency. Al Mosanid was fully social-efficient relative to 2010 frontier but its low scale efficiency leads to CRS social efficiency score of 57.45%. These may due to unstable political situation in their operation or perception problem regarding product compliance to religious law that barring them from increasing operational scale. Regardless, these deserve further investigation and attention.
7. Second stage analysis: Non-parametric Post DEA Analysis
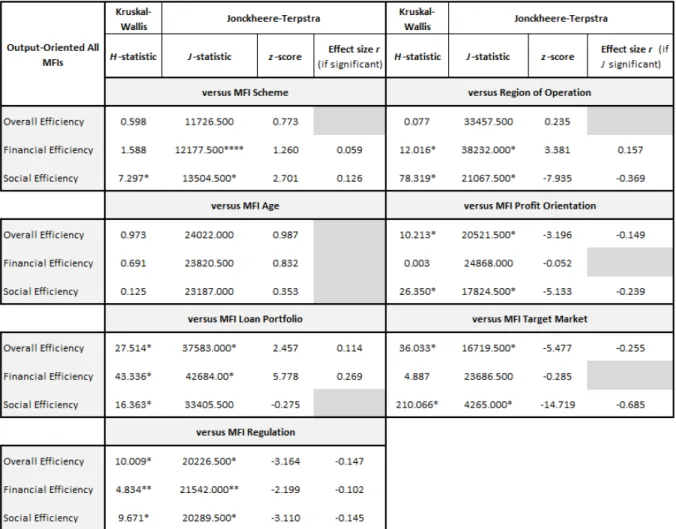
The main objective of post DEA analysis herein is testing statistical significance of performance differences observed in mean efficiency scores from DEA analysis, i.e. whether different scheme of IMFIs and MFIs significantly affect differences in MFI efficiency in the dataset for 2009-2010. Moreover, we intend to observe several factors which may affect MFI efficiency, i.e. MFI age, operational region (in global frontier), MFI profit orientation, MFI scale of operation, MFI customer targeting and MFI regulation. Non-parametric tests are utilised as post DEA analysis instead of regression analysis due to only two-year period covered herein.
Kruskal-Wallis H-test is used to analyse significant influence of aforementioned factors to MFIs performance differences. Since Kruskal-Wallis can only test statistical significance of differences not the direction of these differences, Jonckheere-Terpstra test is thereafter utilised as post hoc test in analysing whether a trend/pattern existed in median efficiency scores differences. Effect size estimate of this trend, r, is also calculated as per Rosenthal (1991:19) with magnitude of r is observed using benchmark in Cohen (1988).
Jonckheere-M
AN
US
CR
IP
T
AC
CE
PT
ED
Terpstra test is more meaningful in analysing pattern existence as it uses one-tailed test to observe effects from factors arranged in ranked order, e.g. MFIs are arranged into two ranked scheme groups to observe trend thereto: group 1 of MFIs with stricter scheme (Islamic/windows MFIs) and group 2 of MFIs with more flexible scheme (conventional MFIs), thereby a pattern can be observed from stricter to more flexible MFI scheme.
Since 2009 and 2010 efficiency scores are calculated relative to different frontier, these are not directly comparable. Thus, to make these comparable, efficiency of all MFIs is recalculated using DEA against combined 2009 and 2010 meta-frontier in global, regional, and Islamic frontiers. All MFIs data are therefore combined into 462 DMUs in global frontier assessment, thereby making MFI efficiency scores equally comparable to each other relative to single meta-frontier. Likewise, this method is performed to regional MFIs and Islamic MFIs. However, post DEA analysis on influence of MFI region of operation to efficiency is only done on global frontier as limited EAP and SA IMFI barred this in Islamic meta-frontier. Analysis herein focuses on global frontier with results from other frontiers highlighted thereafter. Post DEA results for global frontier is shown at Table 82.
Post DEA analysis I: MFI efficiency vs MFI schemes - global frontier
Post DEA analysis herein observes whether MFI schemes affect MFI efficiency scores. Kruskal-Wallis test is used in testing the statistical significance of median differences between Islamic/window – conventional MFIs and post hoc Jonckheere-Terpstra trend test is used to analyse whether trend exist in this differences by arranging MFIs in two groups as mentioned heretofore. As previously, the initial presumption is that Islamic/windows MFIs to have significant edge over conventional in social efficiency whilst conventional MFIs significantly prevail in financial efficiency. The findings are as follow:
• Higher social efficiency of conventional MFIs in VRS and CRS assumptions are found to be statistically significant in meta-frontier approach yet with small effect size of 0.126 (VRS) and 0.122 (CRS); consistent with first phase DEA results but contrasting with initial presumption. Yet, this is only confirmed in CRS input-orientated model.
2
Post DEA results for global frontier from input-orientated model is presented at Appendix 2 as comparison.
M
AN
US
CR
IP
T
AC
CE
PT
ED
• Consistent to expectation, higher financial efficiency of conventional MFIs are significant under VRS (85% confidence level) and CRS (99% confidence level) albeit small effect size of 0.059 (VRS) and 0.127 (CRS). In input-orientated model, only CRS is significant.
• Islamic/windows MFIs lead in financial efficiency in first phase DEA results relative to 2010 frontier is not found to be significant under meta-frontier approach.
• Pertaining to overall efficiency, conventional MFIs lead over Islamic/window MFIs is only found to be significant under CRS assumption (input- and output-orientated) with very small effect sizes of 0.070.
• Conventional MFIs are found to have significant higher mean scale efficiency with small effect on output-orientated (0.1333) and marginally medium effect on input-orientated (0.276); indicating closer proximity to most productive scale as per expectation.
• In social efficiency, conventional MFIs have significant higher mean scale efficiency (99% confidence level) in input-orientated model with small size of 0.174. Conversely, Islamic/window MFIs are found to have significant higher mean scale efficiency in output-orientated model under meta frontier approach but only on 85% confidence level and with negligible effect size of 0.070.
Post DEA analysis II: MFI efficiency vs MFI region of operation - global frontier
Herewith, regions in observation are arranged in three ranked order according to adoption of microfinance therein from pioneer to late adopter: starting with South Asia, EAP, and finally MENA. Assessment is only performed for global frontier due to aforementioned reason. Initial presumption is that early adopter region to microfinance will have higher financial and social efficiency due to learning curve. The findings are as follow:
• Operational region significantly affect MFI VRS and CRS financial efficiency in both models, where late adopter have higher financial efficiency: MENA followed by EAP then SA, defying initial presumption albeit with small effect sizes (r = 0.12 – 0.18).
• Result above related to technical inefficiency regarding financial objective in early adopter regions because mean financial scale efficiency is actually higher in early adopter region in both models as expected, although with very small effect size of 0.05 – 0.07.
• Operational region also influence VRS and CRS social efficiency significantly consistent with initial presumption in both models: SA have higher social efficiency, followed by
M
AN
US
CR
IP
T
AC
CE
PT
ED
EAP, then MENA. Effect sizes ranging from medium to medium large (0.34 – 0.47) showing advantage as microfinance pioneer region in outreach.
• On overall efficiency, no significant differences of MFI regions on overall efficiency from Kruskal-Wallis test or significant trend from Jonckheere-Terpstra test are found for both models. However, input-orientated model shows trend that regions adopting microfinance earlier have significant higher overall scale efficiency.
Post DEA analysis III: MFI efficiency vs MFI age – global frontier
We reclassified MFI age groups in MiX dataset, i.e. new (1-4 years), young (5-8 years), and mature (8 years plus) into two groups, i.e. group 1 of young MFIs (1-8 years) and group 2 of mature MFIs (above 8 years) due to small number of “new” MFIs. We expect that experience matters – older MFIs to have higher efficiency due to learning curve.
We found that only VRS social efficiency in input-orientated model differs significantly due to MFI age, i.e. young MFIs exhibit higher efficiency scores compared to mature MFIs with very small effect size of 0.064. This result is in contrary to expectation; it may due to the fact that young MFIs are more idealistic and aggressive in its outreach to the poor. Regarding scale efficiency, young MFIs reveal significant higher scale in overall, financial, and social efficiency in output-orientation model, i.e. defying expectation albeit small effect size ranging from 0.085 – 0.097.
Post DEA analysis IV: MFI efficiency vs MFI profit orientation – global frontier
Empirical studies suggested that the Non-Governmental Organisations (NGO)-MFIs to be more efficient (Gutiérrez-Nieto et al., 2007; Haq et al., 2010), especially in social efficiency (Chowdhury & Mukhopadhaya, 2012b). Thus, based on existing literatures, presumption in this study was that not-profit MFIs in the dataset to have higher social efficiency and for-profit MFIs to have higher financial efficiency. MFIs are thus ranked as two groups based on their profit motive, moving from not-for-profit to for-profit MFIs.
Similar significant differences due to MFI profit-orientation are found in both models whereby not-for-profit MFIs display higher VRS and CRS overall and social efficiency; with small effect sizes for overall efficiency at 0.147 – 0.165 and small to medium for social
M
AN
US
CR
IP
T
AC
CE
PT
ED
efficiency at 0.234 – 0.24. These results concur with abovementioned studies and presumption regarding social efficiency yet cannot confirm presumption on financial efficiency.
Table 8: Summary Post DEA Analysis: Global Meta-frontier Output-orientated VRS
Post DEA analysis V: MFI efficiency vs MFI loan portfolio – global frontier
Differences in MFI efficiency due to different MFI loan portfolio/scale is assessed herewith by categorising MFIs in dataset into three groups based on gross loan portfolio, i.e. from small scale (less than 2 Million USD), medium scale (2 – 8 Million USD), and large scale (larger than 8 Million USD). The objective is to observe whether MFIs that has managed to grow its portfolio, i.e. termed as “scaling-up”, still perform well in terms of social efficiency or shift its focus toward financial efficiency, i.e. existence of “mission drift” (Copestake,
M
AN
US
CR
IP
T
AC
CE
PT
ED
2007a; Mersland & Strøm, 2010). Presumptions herein are MFIs with large portfolio excel in financial efficiency yet MFIs with small portfolio shine in social efficiency. We found that:
• MFI loan scale significantly affects VRS and CRS overall and financial efficiency in both models: as MFI loan portfolio becomes larger its overall and financial efficiency tend to be higher. The effect size, r, for overall efficiency is from very small in input-orientated (0.065) to small in output-orientated (0.114). Regarding financial efficiency, the effect size is ranging from small in input-orientated (0.16) to marginally medium (0.269) in output-orientated, thus confirms the presumption.
• We observed significant differences in social efficiency due to loan size based on Kruskal-Wallis test in all models and all assumptions. However, the direction trend was only found in VRS input-orientated, i.e. the smaller loan portfolio of an MFI, the higher its social efficiency albeit small effect size (0.11). Thus, if plausible strategy to boost outreach for MFIs is only by reducing inputs, MFIs with smaller loan portfolio can perform more efficiently.
Post DEA analysis VI: MFI efficiency vs MFI target customer – global frontier
This section tests MFI efficiency differences due to different customer targeting based on average loan balance per borrower as percentage of GNI per capita. MFIs are classified into four ranked groups as per customer target in MiX, i.e. low end (maximum 20% of GNI per capita), broad (between 20% - 149% of GNI per capita), high end (between 150% - 250% of GNI per capita), and small business (over 250% of GNI per capita). Thus, trend/pattern existence moving from MFIs targeting on poorest borrowers to those targeting better-off poor can be assessed. Initial presumptions were that social efficiency will be lower but financial efficiency will be higher moving along from MFIs targeting poorest customer to those targeting well-off poor.
Results show that VRS and CRS overall and social efficiency in both models are lower as MFIs shifting its target toward well-off poor. Effect size, r, is large for social efficiency (r = 0.504 – 0.684) indicating that shifting target toward better-off customer significantly hurt social efficiency, consistent with expectation. MFIs targeting poorer borrowers are found to have significant higher overall efficiency with small to medium effect size (r = 0.23 – 0.30).
M
AN
US
CR
IP
T
AC
CE
PT
ED
Regarding financial efficiency, significant differences in VRS MFI financial due to MFI client targeting is found in output-orientated model yet ranked trend cannot be established. Nevertheless, MFIs targeting poorer clients are found to have significant higher CRS financial efficiency though with very small effects of 0.068.
Post DEA analysis VII: MFI efficiency vs MFI regulation – global frontier
Many studies focus on the effect of regulating MFI to performance as there has recently been increasing pressure to regulate MFIs in developing countries (Hartarska & Nadolnyak, 2007; Tchakoute-Tchuigoua, 2010). Lafourcade et al. (2005) argued that regulated MFIs have higher efficiency whilst Hartarska & Nadolnyak (2007) observed globally that regulating MFIs does not necessarily warrant better outreach and sustainability, besides deposit-taking authorization. Instead, Haq et al., (2010) asserted that NGO-MFIs, mostly unregulated, are the most efficient under production approach. Therefore, influence of MFI regulation on efficiency is analysed herewith by ranking MFIs in two groups: unregulated and regulated MFIs. Based on literatures, initial presumption is that unregulated MFIs excel in social efficiency due to flexibility whilst regulated MFIs lead in financial efficiency due to deposit-taking authorization.
MFI regulation is found to significantly affect VRS and CRS overall, financial, and social efficiency in both models: efficiency scores are lower should MFIs become regulated albeit small effect size (r = 0.10 – 0.16). These findings confirm presumption in social efficiency but challenge that in financial efficiency. These confirm Hartarska & Nadolnyak (2007) for MFIs in dataset that regulating MFIs do not guarantee higher performance.
Post DEA analysis results from regional and Islamic frontier
Post DEA analysis is also conducted on three regional frontiers and Islamic frontiers.
MFI efficiency vs MFI scheme: (1) Conventional MFIs in MENA meta-frontier exhibit higher VRS overall, financial, and social efficiency plus CRS financial efficiency scores in output-orientated model albeit with small effect size of 0.11 – 0.20; contrasting presumption on social efficiency yet concurring that on financial efficiency. (2) In line with presumption, in both models Islamic MFIs in SA meta-frontier have higher VRS and CRS social efficiency
M
AN
US
CR
IP
T
AC
CE
PT
ED
(very small effects of 0.07 – 0.09) whilst SA conventional MFIs display higher VRS and CRS financial efficiency (small to medium effect size of 0.12 – 0.27).
MFI efficiency vs MFI age: (1) Significant differences due to MFI age is found on VRS overall, financial and social efficiency in EAP meta-frontier for all models whereby younger MFIs tend to have higher efficiency with small to medium effect size. (2) In MENA meta-frontier, significant MFI age influences are found whereby mature MFIs tend to have higher VRS and CRS overall and social efficiency in output-orientated and CRS financial and social efficiency in input-orientated model, confirming presumption. (3) Young MFIs are significantly found to have tendency of higher VRS and CRS financial efficiency for both models in SA meta-frontier; conflicting presumption. (4) Significant findings in Islamic frontier that mature MFIs tend to have higher VRS and CRS social efficiency in output-orientated whilst young MFIs tend to have higher VRS financial efficiency in input-orientated.
MFI efficiency vs MFI profit orientation: (1) Similar significant impact and trend exist in EAP, MENA, SA, and Islamic meta-frontiers for all models whereby not-for-profit MFIs display higher social efficiency as presumed; effect size is large in EAP meta-frontier (r = 0.48 – 0.61), small to medium in Islamic meta-frontier (r = 0.26 – 0.31) yet small in others. (2) Not-for-profit MFIs exhibit significant higher overall efficiency in all models and all condition with medium effect size (r = 0.21 – 0.41). (3) Not-for-profit MFIs display higher financial efficiency in EAP, MENA, and Islamic meta-frontier (small effect size in EAP but medium in the rest) yet mature MFIs reveal high financial efficiency in SA meta-frontier with small effect size.
MFI efficiency vs MFI loan portfolio: (1) Significant differences in overall efficiency due to MFI loan portfolio are observed in all meta-frontiers for all models. However, linear trends can only be established in VRS overall efficiency in EAP meta-frontiers and in CRS overall efficiency in SA meta-frontiers albeit differently; MFIs with smaller loan portfolio exhibit higher scores (small effect size of 0.11 – 0.14) in the former but MFIs with larger loan portfolio display higher scores in the latter (r = 0.083). (2) MFI loan scale also significantly affects financial efficiency for all models in all meta-frontiers, yet patterns are only found in three frontiers: in EAP meta-frontier MFIs with smaller loan portfolio exhibit higher CRS